


 |
市場調查報告書
商品編碼
2064397
北美頁岩氣:市場佔有率分析、產業趨勢與統計、成長預測(2026-2031)North America Shale Gas - Market Share Analysis, Industry Trends & Statistics, Growth Forecasts (2026 - 2031) |
||||||

※ 本網頁內容可能與最新版本有所差異。詳細情況請與我們聯繫。
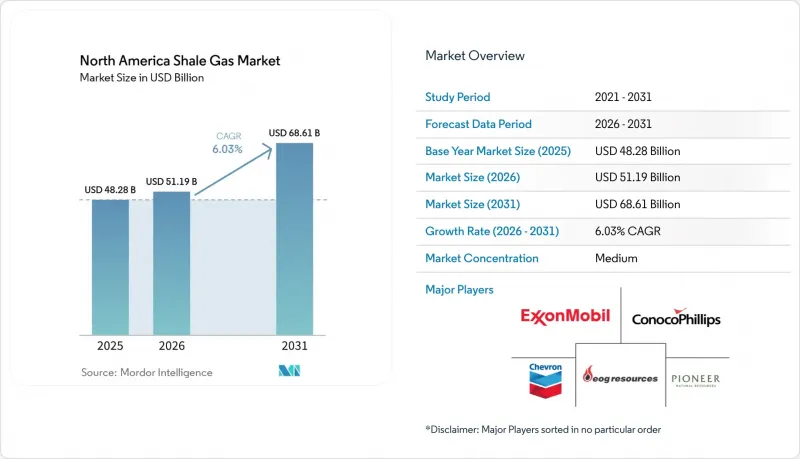
根據 Mordor Intelligence 預測,北美頁岩氣市場規模預計將從 2025 年的 482.8 億美元成長到 2026 年的 511.9 億美元,到 2031 年達到 686.1 億美元,2026 年至 2031 年的複合年成長率為 6.03%。
本報告按碳氫化合物類型(頁岩氣、頁岩油)、開採技術(僅水平鑽井、僅水力壓裂、水平鑽井與水力壓裂相結合等)、應用領域(發電、工業和石化原料、住宅和商業供暖、交通運輸)以及地區(美國、加拿大、墨西哥)進行細分。市場預測以美元(USD)為單位。
北美頁岩氣市場趨勢與洞察
水平鑽井和水力壓裂技術的廣泛應用
在二疊紀盆地和馬塞勒斯頁岩層,水平井的長度通常超過10,000英尺,每口井需要進行60至80段壓裂。雪佛龍公司的三聯壓裂平台設計將使三口井能夠在2025年前同時完井,每口井的成本低於600萬美元。哈里伯頓公司的封閉回路型壓力控制壓裂技術可將支撐劑的注入效率提高20%,並延長壓裂的半衰期。電動車輛的投入使用使井場無需柴油燃料,而馬塞勒斯頁岩層的試驗計畫則將壓裂相關的排放減少了60%。這些技術的進步提高了技術可採資源量,使北美頁岩氣市場維持6%的成長勢頭,並使營運商能夠對現有油井進行再增產,從而進一步提高採收率。
聯邦和州層級的優惠稅收激勵措施
美國聯邦法規第45I條規定,對於邊際油井的產量,每桶油當量可獲得3美元的補貼,惠及美國約30萬口生產油井。美國聯邦法規第45K條規定,傳統型燃料稅額扣抵每桶油當量可獲得6.40美元的補貼,用於支持阿巴拉契亞地區泥盆紀頁岩層的再開發。賓州的「影響費」在2024年向地方政府返還了2.62億美元,從而增強了社區對持續鑽探的支持。德克薩斯州的高成本天然氣免稅政策免除了深層水平井的資源稅,使實際稅率在投產後的前10年內從7.5%降至接近零。這些激勵措施正在加速短期鑽探,保護獨立公司免受短期價格波動的影響,並支持北美頁岩氣市場的擴張。
天然氣價格波動會影響投資決策。
亨利樞紐天然氣期貨價格波動劇烈,從2024年2月的每百萬英熱單位1.57美元飆升至2025年1月「蕨類」冬季風暴期間的6.80美元,漲幅高達333%,嚴重打擊了資本預算的信心。 2027-2028年期貨曲線均價約為每百萬英熱單位3.20美元,略高於海恩斯維爾地區現金流損益平衡所需的3美元閾值。由於德克薩斯管線擁塞狀況日益惡化,瓦哈樞紐天然氣價格較亨利樞紐天然氣價格的貼水擴大至2美元。與TTF和JKM天然氣價格的相關性使北美生產商更容易受到地緣政治衝擊的影響,導致2026年天然氣鑽探預算延後15-20%。因此,價格波動使北美頁岩氣市場預期成長率下降超過一個百分點。
細分市場分析
到2025年,頁岩氣佔北美頁岩氣市場總產量的77.5%,而頁岩油的成長速度更快,年複合成長率達6.6%。在二疊紀盆地,原油日產量達到660萬桶,天然氣日產量達到22.2億立方英尺,這使得營運商能夠透過原油業務的獲利來彌補天然氣業務的虧損。
在富含液態烴的地區,例如德拉瓦盆地,氣油比可達每桶約3500立方英尺,即使亨利樞紐油價低於每百萬英熱單位3美元,也能保證穩定的現金流。因此,大型獨立石油公司持續將鑽井鑽機從乾氣豐富的阿巴拉契亞地區轉移到以石油為主的盆地,這一趨勢正推動成長重心轉向頁岩油,同時憑藉相關的產量,維持北美頁岩氣生產市場的韌性。
其他好處:
- Excel格式的市場預測(ME)表
- 3個月的分析師支持
目錄
第1章:引言
- 研究假設和市場定義
- 調查範圍
第2章:調查方法
第3章執行摘要
第4章 市場狀況
- 市場概覽
- 市場促進因素
- 水平鑽井和水力壓裂技術的廣泛應用
- 聯邦和州層級的優惠稅收激勵措施
- 國內對低成本石化原料的需求不斷成長
- 五大湖船舶對液化天然氣燃料庫的需求不斷增加(IMO 2030 年及以後)
- 利用人工智慧進行預測性維護,減少非生產性時間
- 市場限制因素
- 天然氣價格波動會影響投資決策
- 嚴格的甲烷排放法規
- 地方政府反對地下水保護
- 供不應求
- 供應鏈分析
- 監理情勢
- 技術展望
- 波特五力分析
第5章 市場規模與成長預測
- 按烴類類型
- 頁岩氣
- 頁岩油
- 透過萃取技術
- 僅水平開挖
- 僅水力壓裂
- 水平鑽井與水力壓裂技術的結合應用
- 透過使用
- 發電
- 工業和石油化學原料
- 住宅和商業供暖
- 運輸(液化天然氣和壓縮天然氣)
- 按地區
- 美國
- 加拿大
- 墨西哥
第6章 競爭情勢
- 市場集中度
- 策略趨勢(併購、聯盟、購電協議)
- 市場佔有率分析(主要公司的市場排名和佔有率)
- 公司簡介
- Exxon Mobil Corporation
- Chevron Corporation
- ConocoPhillips
- EOG Resources Inc.
- Pioneer Natural Resources Co.
- BP plc
- Royal Dutch Shell plc
- TotalEnergies SE
- Occidental Petroleum Corporation
- Murphy Oil Corporation
- Equinor ASA
- Repsol SA
- Chesapeake Energy Corporation
- Range Resources Corporation
- Devon Energy Corporation
- Coterra Energy Inc.
- EQT Corporation
- Ovintiv Inc.
- Southwestern Energy Company
- Antero Resources Corporation
第7章 市場機會與未來展望
According to Mordor Intelligence, the north america shale gas market size is expected to increase from USD 48.28 billion in 2025 to USD 51.19 billion in 2026 and reach USD 68.61 billion by 2031, growing at a CAGR of 6.03% over 2026-2031.
This report is Segmented by Hydrocarbon Type (Shale Gas, Shale Oil), Extraction Technology (Horizontal Drilling Only, Hydraulic Fracturing Only, Combined Horizontal and More), Application (Power Generation, Industrial and Petrochemical Feedstock, Residential and Commercial Heating, Transportation), and Geography (United States, Canada, Mexico). The Market Forecasts are Provided in Terms of Value (USD).
North America Shale Gas Market Trends and Insights
Proliferation of Horizontal Drilling & Hydraulic Fracturing
Lateral lengths in the Permian and Marcellus now commonly exceed 10,000 feet, while stage counts reach 60-80 per well. Chevron's triple-frac pad design completed three wells simultaneously in 2025 and cut per-well costs below USD 6 million. Halliburton's closed-loop pressure-managed fracturing lifts proppant placement efficiency by up to 20% and prolongs fracture half-life. Electric fleets eliminate diesel at the wellsite and have lowered fracturing emissions by 60% in Marcellus field pilots. These advances enlarge technically recoverable resources, keep the shale gas production in North America market on its 6% growth track, and allow operators to re-stimulate legacy wells for incremental recovery.
Favorable Federal and State-Level Tax Incentives
USC 45I grants USD 3 per barrel-of-oil-equivalent for marginal-well output, benefiting roughly 300,000 stripper wells across the United States . The USC 45K nonconventional fuels credit pays USD 6.40 per barrel-equivalent and supports Devonian shale redevelopment in Appalachia. Pennsylvania's Impact Fee returned USD 262 million to local governments in 2024 and nurtured community backing for continued drilling. Texas' high-cost gas exemption removes severance taxes for deep horizontal wells, shrinking the effective levy from 7.5% to near zero during the first decade of production. These incentives accelerate short-cycle drilling and insulate independents from near-term price swings, supporting expansion of the shale gas production in North America market.
Volatile Natural Gas Prices Impacting Investment Decisions
Henry Hub futures ranged from USD 1.57 per MMBtu in February 2024 to USD 6.80 during Winter Storm Fern in January 2025, a 333% swing that undercut capital budgeting confidence. Forward curves for 2027-2028 average near USD 3.20, barely above the USD 3.00 threshold needed for positive cash flow in the Haynesville. Waha hub discounts widened to USD 2.00 below Henry Hub as pipeline congestion intensified in West Texas. Correlation with TTF and JKM exposes North American producers to geopolitical shocks, prompting a 15-20% deferral of 2026 gas-directed drilling budgets. Price volatility therefore subtracts over one percentage point from forecast growth in the shale gas production in North America market.
Other drivers and restraints analyzed in the detailed report include:
- Growing Domestic Demand for Low-Cost Petrochemical Feedstock
- Increasing LNG Bunkering Demand from Great Lakes Fleet (Post IMO 2030)
- Stringent Methane Emission Regulations
For complete list of drivers and restraints, kindly check the Table Of Contents.
Segment Analysis
Shale gas held 77.5% share of the shale gas production in North America market size in 2025, yet shale oil grew faster at a 6.6% CAGR. Permian output delivered 6.6 million bpd of crude with a 22.2 Bcf/d gas stream, enabling operators to cross-subsidize gas economics.
Liquids-heavy acreage such as the Delaware sub-basin posts gas-to-oil ratios near 3,500 cf/bbl, supporting cash flows even when Henry Hub prices linger below USD 3 per MMBtu. Consequently, large independents continue reallocating rigs from dry-gas Appalachia to oil-weighted basins, a trend that tilts growth toward shale oil yet leaves the shale gas production in North America market resilient on the back of associated volumes.
List of Companies Covered in this Report:
- Exxon Mobil Corporation
- Chevron Corporation
- ConocoPhillips
- EOG Resources Inc.
- Pioneer Natural Resources Co.
- BP plc
- Royal Dutch Shell plc
- TotalEnergies SE
- Occidental Petroleum Corporation
- Murphy Oil Corporation
- Equinor ASA
- Repsol SA
- Chesapeake Energy Corporation
- Range Resources Corporation
- Devon Energy Corporation
- Coterra Energy Inc.
- EQT Corporation
- Ovintiv Inc.
- Southwestern Energy Company
- Antero Resources Corporation
Additional Benefits:
- The market estimate (ME) sheet in Excel format
- 3 months of analyst support
TABLE OF CONTENTS
1 Introduction
- 1.1 Study Assumptions & Market Definition
- 1.2 Scope of the Study
2 Research Methodology
3 Executive Summary
4 Market Landscape
- 4.1 Market Overview
- 4.2 Market Drivers
- 4.2.1 Proliferation of horizontal drilling & hydraulic fracturing
- 4.2.2 Favorable federal and state-level tax incentives
- 4.2.3 Growing domestic demand for low-cost petrochemical feedstock
- 4.2.4 Increasing LNG bunkering demand from Great Lakes shipping fleet (post IMO 2030)
- 4.2.5 AI-driven predictive maintenance reducing non-productive time
- 4.3 Market Restraints
- 4.3.1 Volatile natural gas prices impacting investment decisions
- 4.3.2 Stringent methane emission regulations
- 4.3.3 Municipal ground-water conservation opposition
- 4.3.4 Limited availability of specialized proppants
- 4.4 Supply-Chain Analysis
- 4.5 Regulatory Landscape
- 4.6 Technological Outlook
- 4.7 Porter's Five Forces Analysis
- 4.7.1 Bargaining Power of Suppliers
- 4.7.2 Bargaining Power of Consumers
- 4.7.3 Threat of New Entrants
- 4.7.4 Threat of Substitute Products & Services
- 4.7.5 Intensity of Competitive Rivalry
5 Market Size & Growth Forecasts
- 5.1 By Hydrocarbon Type
- 5.1.1 Shale Gas
- 5.1.2 Shale Oil
- 5.2 By Extraction Technology
- 5.2.1 Horizontal Drilling Only
- 5.2.2 Hydraulic Fracturing Only
- 5.2.3 Combined Horizontal and Hydraulic Fracturing
- 5.3 By Application
- 5.3.1 Power Generation
- 5.3.2 Industrial and Petrochemical Feedstock
- 5.3.3 Residential and Commercial Heating
- 5.3.4 Transportation (LNG and CNG)
- 5.4 By Geography
- 5.4.1 United States
- 5.4.2 Canada
- 5.4.3 Mexico
6 Competitive Landscape
- 6.1 Market Concentration
- 6.2 Strategic Moves (M&A, Partnerships, PPAs)
- 6.3 Market Share Analysis (Market Rank/Share for key companies)
- 6.4 Company Profiles (includes Global level Overview, Market level overview, Core Segments, Financials as available, Strategic Information, Products & Services, and Recent Developments)
- 6.4.1 Exxon Mobil Corporation
- 6.4.2 Chevron Corporation
- 6.4.3 ConocoPhillips
- 6.4.4 EOG Resources Inc.
- 6.4.5 Pioneer Natural Resources Co.
- 6.4.6 BP plc
- 6.4.7 Royal Dutch Shell plc
- 6.4.8 TotalEnergies SE
- 6.4.9 Occidental Petroleum Corporation
- 6.4.10 Murphy Oil Corporation
- 6.4.11 Equinor ASA
- 6.4.12 Repsol SA
- 6.4.13 Chesapeake Energy Corporation
- 6.4.14 Range Resources Corporation
- 6.4.15 Devon Energy Corporation
- 6.4.16 Coterra Energy Inc.
- 6.4.17 EQT Corporation
- 6.4.18 Ovintiv Inc.
- 6.4.19 Southwestern Energy Company
- 6.4.20 Antero Resources Corporation
7 Market Opportunities & Future Outlook
- 7.1 White-space & Unmet-need Assessment

 頁岩氣市場:2026-2032年全球市場預測(依開採技術、產品類型、純度、價值鏈階段、油井生命週期階段及應用分類)
 美國頁岩氣:市場佔有率分析、產業趨勢與統計、成長預測(2026-2031)
 頁岩氣市場規模、佔有率和趨勢分析報告:按應用、地區和細分市場預測(2026-2033 年)
 頁岩氣市場:按技術、應用和地區分類
 2026年全球頁岩氣市場報告
 頁岩氣市場規模、佔有率及成長分析(按技術、應用及地區分類)-2026-2033年產業預測
 2025-2029年全球頁岩氣市場
 頁岩氣市場-全球產業規模、佔有率、趨勢、機會及預測(細分領域、按應用、按最終用戶、按開採方式、按地區及競爭格局,2020-2030 年預測)
 2032 年頁岩氣市場預測:按產品類型、技術、應用、最終用戶和地區進行的全球分析頁岩氣 -市場佔有率分析、產業趨勢/統計、成長預測(2025-2030)