


 |
市場調查報告書
商品編碼
2027597
綠色肥料市場機會、成長要素、產業趨勢分析及2026-2035年預測。Green Fertilizer Market Opportunity, Growth Drivers, Industry Trend Analysis, and Forecast 2026 - 2035 |
||||||
2025年全球綠肥市場價值27億美元,預計2035年將達40億美元,年複合成長率為4.1%。
綠肥市場已發展成為永續農業的關鍵組成部分,促進土壤健康、環境保護和長期生產力。綠肥不再只是傳統肥料的替代品,而是再生農業的核心投入品,幫助農民在滿足不斷變化的環境標準的同時,減少化肥的使用。推動綠肥市場發展的主要因素有兩個:一是食品生產法規的變革,二是消費者對永續種植作物日益成長的需求。生物來源、有機和礦物基肥料的創新提高了不同作物系統的養分輸送效率,從而確保更高的產量。市場動態因地區而異:在農業現代化地區,高效利用養分的解決方案被廣泛採用;而在法規成熟的地區,則更注重開發更清潔的投入品。在發展中市場,綠肥能夠增強土壤韌性,並維持土地的長期生產力。
| 市場範圍 | |
|---|---|
| 開始年份 | 2025 |
| 預測期 | 2026-2035 |
| 初始市場規模 | 27億美元 |
| 預計金額 | 40億美元 |
| 複合年成長率 | 4.1% |
預計到2025年,尿素市場佔有率將達到27.5%,到2035年將以6.8%的複合年成長率成長。隨著農民越來越重視既能維持作物產量又能減少環境影響的配方,可再生尿素的重要性日益凸顯。其多功能性和高養分利用率使其成為永續肥料策略的基礎。
預計到2025年,農業領域將佔據68.2%的市場佔有率,並在2035年之前以3.9%的複合年成長率成長。綠肥能夠提升土壤肥力,增強作物抗逆性,並支持適應氣候變遷的農業實踐。它們的角色遠不止於提供養分,更有戰略意義,能夠幫助農民在整個食品價值鏈中實現永續性目標,同時採用再生和環境高效的技術。農民越來越依賴這些肥料來維持土壤健康,並確保長期生產力。
預計到2025年,北美綠色肥料市佔率將達到30.3%。在強力的碳減排政策、可再生能源基礎設施以及清潔氫能技術發展的推動下,該地區正成為永續肥料領域的創新中心。北美擁有完善的法規結構、先進的研究設施以及低排放量農業實踐的廣泛應用,這些都為綠色肥料的發展創造了有利環境。
目錄
第1章:調查方法和範圍
第2章執行摘要
第3章業界考察
- 生態系分析
- 供應商情況
- 利潤率
- 每個階段增加的價值
- 影響價值鏈的因素
- 中斷
- 影響產業的因素
- 促進因素
- 綠色肥料提供了一種更永續的替代方案,可以促進土壤健康並減少對環境的影響。
- 有機農業的擴張
- 人們對土壤健康的興趣日益濃厚
- 產業潛在風險與挑戰
- 難以獲得
- 與傳統合成肥料相比,初始成本會更高。
- 市場機遇
- 新興的排碳權和綠色環保證書市場
- 現有氨生產設施的維修
- 促進因素
- 成長潛力分析
- 監理情勢
- 波特五力分析
- PESTEL 分析
- 價格趨勢
- 按地區
- 按肥料類型
- 未來市場趨勢
- 科技與創新趨勢
- 當前技術趨勢
- 新興技術
- 專利趨勢
- 貿易統計(HS編碼)
- 主要進口國
- 主要出口國
- 永續性和環境方面
- 永續計劃
- 減少廢棄物策略
- 生產中的能源效率
- 具有環保意識的舉措
- 考慮碳足跡
第4章 競爭情勢
- 介紹
- 企業市佔率分析
- 按地區
- 北美洲
- 歐洲
- 亞太地區
- 拉丁美洲
- 中東和非洲
- 按地區
- 企業矩陣分析
- 主要市場公司的競爭分析
- 競爭定位矩陣
- 主要進展
- 併購
- 夥伴關係與合作
- 新產品發布
- 業務拓展計劃
第5章 市場估計與預測:依肥料類型分類,2022-2035年
- 綠色硝酸銨(AN)
- 綠色硝酸銨鈣(CAN)
- 綠色尿素
- 普里盧雷亞
- 顆粒尿素
- 包覆緩釋尿素
- 其他
第6章 市場估計與預測:依技術分類,2022-2035年
- 鹼性水電電解
- 質子交換膜(PEM)
- 固體氧化物電解
第7章 市場估計與預測:依應用領域分類,2022-2035年
- 農業
- 穀類和穀類食品
- 油籽/豆類
- 水果和蔬菜
- 特種作物和藥用作物
- 其他
- 園藝
- 觀賞植物
- 溫室利用
- 苗圃
- 其他
- 林業
- 造林
- 植樹造林
- 農林業
- 其他
第8章 市場估計與預測:依地區分類,2022-2035年
- 北美洲
- 美國
- 加拿大
- 歐洲
- 德國
- 英國
- 法國
- 西班牙
- 義大利
- 其他歐洲地區
- 亞太地區
- 中國
- 印度
- 日本
- 澳洲
- 韓國
- 亞太其他地區
- 拉丁美洲
- 巴西
- 墨西哥
- 阿根廷
- 其他拉丁美洲地區
- 中東和非洲
- 沙烏地阿拉伯
- 南非
- 阿拉伯聯合大公國
- 其他中東和非洲地區
第9章:公司簡介
- Yara International ASA
- CF Industries Holdings, Inc.
- Nutrien Ltd.
- OCI NV
- BASF SE
- Fertiberia SA
- Tata Chemicals Ltd.
- Siemens Energy AG
- Nel Hydrogen
- thyssenkrupp Uhde
- Profert
- HIF Global
- Haldor Topsoe A/S
- Dyno Nobel
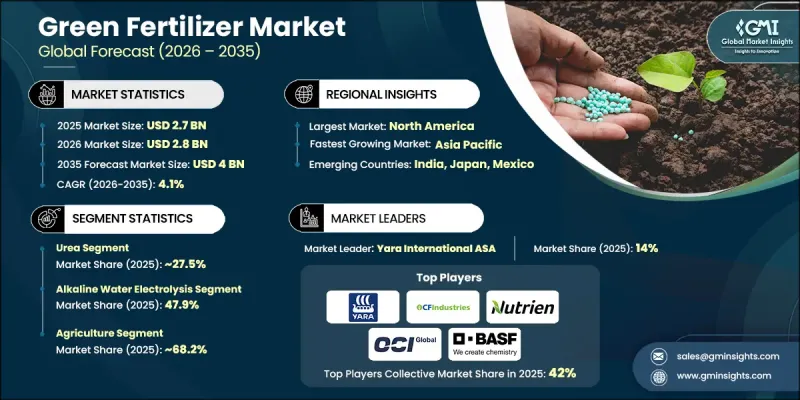
The Global Green Fertilizer Market was valued at USD 2.7 billion in 2025 and is estimated to grow at a CAGR of 4.1% to reach USD 4 billion by 2035.
The market has evolved into a vital component of sustainable agriculture, promoting soil health, environmental protection, and long-term productivity. Green fertilizers are no longer just alternatives to conventional fertilizers; they have become core inputs for regenerative agriculture, helping farmers reduce chemical usage while meeting evolving environmental standards. The market is shaped by two main drivers: regulatory changes in food production and rising demand for sustainably grown crops. Innovations in biological, organic, and mineral-based fertilizers enhance nutrient delivery across diverse crop systems, ensuring better yields. Market dynamics differ regionally, with modernizing agricultural regions adopting nutrient-efficient solutions and mature regulatory areas emphasizing cleaner input development. In developing markets, green fertilizers boost soil resilience and sustain long-term land productivity.
| Market Scope | |
|---|---|
| Start Year | 2025 |
| Forecast Year | 2026-2035 |
| Start Value | $2.7 Billion |
| Forecast Value | $4 Billion |
| CAGR | 4.1% |
The urea segment accounted for 27.5% share in 2025 and is projected to grow at a CAGR of 6.8% by 2035. Renewable urea is gaining prominence as farmers increasingly prioritize formulations that reduce environmental impact while maintaining crop performance. Its versatility and nutrient efficiency make it a cornerstone of sustainable fertilizer strategies.
The agriculture segment held a 68.2% share in 2025 and is expected to grow at a CAGR of 3.9% through 2035. Green fertilizers improve soil fertility, enhance crop resilience, and support climate-aligned farming practices. They play a strategic role beyond nutrient supply, enabling farmers to adopt regenerative and eco-efficient techniques while meeting sustainability targets across the food value chain. Farmers increasingly rely on these fertilizers to maintain soil health and ensure productivity over extended periods.
North America Green Fertilizer Market held a 30.3% share in 2025. The region is a hub for innovation in sustainable fertilizers, driven by strong carbon-reduction policies, renewable energy infrastructure, and the development of clean-hydrogen capabilities. North America benefits from a supportive regulatory framework, advanced research facilities, and growing adoption of low-emission agricultural practices, creating a favorable environment for green fertilizer growth.
Key players in the Global Green Fertilizer Market include Nutrien Ltd., CF Industries Holdings, Inc., Yara International ASA, Tata Chemicals Ltd., BASF SE, Fertiberia S.A., Dyno Nobel, Haldor Topsoe A/S, OCI N.V., Siemens Energy AG, Nel Hydrogen, thyssenkrupp Uhde, and Profert. Companies in the Green Fertilizer Market strengthen their position by investing in advanced production technologies, such as renewable urea synthesis and bio-based nutrient solutions, to improve product efficiency and sustainability. Strategic collaborations with agricultural cooperatives, research institutes, and governmental organizations enable access to new markets and regulatory insights. Firms expand geographically to emerging agricultural regions while maintaining compliance with environmental standards. Innovation in product development, such as hybrid bio-mineral blends and eco-friendly formulations, helps differentiate brands. Companies also optimize supply chains, implement precision logistics, and promote farmer education programs to increase adoption, ensure consistent availability, and reinforce long-term market leadership.
Table of Contents
Chapter 1 Methodology & Scope
- 1.1 Market scope and definition
- 1.2 Research design
- 1.2.1 Research approach
- 1.2.2 Data collection methods
- 1.3 Data mining sources
- 1.3.1 Global
- 1.3.2 Regional/Country
- 1.4 Base estimates and calculations
- 1.4.1 Base year calculation
- 1.4.2 Key trends for market estimation
- 1.5 Primary research and validation
- 1.5.1 Primary sources
- 1.6 Forecast model
- 1.7 Research assumptions and limitations
Chapter 2 Executive Summary
- 2.1 Industry 360° synopsis
- 2.2 Key market trends
- 2.2.1 Regional
- 2.2.2 Fertilizer Type
- 2.2.3 Technology
- 2.2.4 Application
- 2.3 TAM Analysis, 2026-2035
- 2.4 CXO perspectives: Strategic imperatives
- 2.4.1 Executive decision points
- 2.4.2 Critical success factors
- 2.5 Future Outlook and Strategic Recommendations
Chapter 3 Industry Insights
- 3.1 Industry ecosystem analysis
- 3.1.1 Supplier landscape
- 3.1.2 Profit margin
- 3.1.3 Value addition at each stage
- 3.1.4 Factor affecting the value chain
- 3.1.5 Disruptions
- 3.2 Industry impact forces
- 3.2.1 Growth drivers
- 3.2.1.1 Green fertilizers offer a more sustainable alternative, promoting healthier soil and reducing environmental impact
- 3.2.1.2 Growing organic farming
- 3.2.1.3 Increasing concerns for soil health
- 3.2.2 Industry pitfalls and challenges
- 3.2.2.1 Limited availability
- 3.2.2.2 The upfront cost is higher compared to traditional synthetic fertilizers
- 3.2.3 Market opportunities
- 3.2.3.1 Emerging carbon credit & green certificate markets
- 3.2.3.2 Retrofitting existing ammonia production facilities
- 3.2.1 Growth drivers
- 3.3 Growth potential analysis
- 3.4 Regulatory landscape
- 3.4.1 North America
- 3.4.2 Europe
- 3.4.3 Asia Pacific
- 3.4.4 Latin America
- 3.4.5 Middle East & Africa
- 3.5 Porter's analysis
- 3.6 PESTEL analysis
- 3.7 Price trends
- 3.7.1 By region
- 3.7.2 By Fertilizer type
- 3.8 Future market trends
- 3.9 Technology and Innovation landscape
- 3.9.1 Current technological trends
- 3.9.2 Emerging technologies
- 3.10 Patent Landscape
- 3.11 Trade statistics (HS code)
- 3.11.1 Major importing countries
- 3.11.2 Major exporting countries
- 3.12 Sustainability and environmental aspects
- 3.12.1 Sustainable practices
- 3.12.2 Waste reduction strategies
- 3.12.3 Energy efficiency in production
- 3.12.4 Eco-friendly initiatives
- 3.13 Carbon footprint consideration
Chapter 4 Competitive Landscape, 2025
- 4.1 Introduction
- 4.2 Company market share analysis
- 4.2.1 By region
- 4.2.1.1 North America
- 4.2.1.2 Europe
- 4.2.1.3 Asia Pacific
- 4.2.1.4 LATAM
- 4.2.1.5 MEA
- 4.2.1 By region
- 4.3 Company matrix analysis
- 4.4 Competitive analysis of major market players
- 4.5 Competitive positioning matrix
- 4.6 Key developments
- 4.6.1 Mergers & acquisitions
- 4.6.2 Partnerships & collaborations
- 4.6.3 New Product Launches
- 4.6.4 Expansion Plans
Chapter 5 Market Estimates and Forecast, By Fertilizer, 2022-2035 (USD Million) (Kilo Tons)
- 5.1 Key trends
- 5.2 Green Ammonium Nitrate (AN)
- 5.3 Green Calcium Ammonium Nitrate (CAN)
- 5.4 Green Urea
- 5.4.1 Prilled Urea
- 5.4.2 Granular Urea
- 5.4.3 Coated/Slow Release Urea
- 5.5 Others
Chapter 6 Market Estimates and Forecast, By Technology, 2022-2035 (USD Million) (Kilo Tons)
- 6.1 Key trends
- 6.2 Alkaline Water Electrolysis
- 6.3 Proton Exchange Membrane (PEM)
- 6.4 Solid Oxide Electrolysis
Chapter 7 Market Estimates and Forecast, By Application, 2022-2035 (USD Million) (Kilo Tons)
- 7.1 Key trends
- 7.2 Agriculture
- 7.2.1 Cereals & Grains
- 7.2.2 Oilseeds & Pulses
- 7.2.3 Fruits & Vegetables
- 7.2.4 Specialty & Medicinal Crops
- 7.2.5 Others
- 7.3 Horticulture
- 7.3.1 Ornamental Plants
- 7.3.2 Greenhouse Applications
- 7.3.3 Nurseries
- 7.3.4 Other
- 7.4 Forestry
- 7.4.1 Plantation
- 7.4.2 Reforestation
- 7.4.3 Agroforestry
- 7.4.4 Other
Chapter 8 Market Estimates and Forecast, By Region, 2022-2035 (USD Million) (Kilo Tons)
- 8.1 Key trends
- 8.2 North America
- 8.2.1 U.S.
- 8.2.2 Canada
- 8.3 Europe
- 8.3.1 Germany
- 8.3.2 UK
- 8.3.3 France
- 8.3.4 Spain
- 8.3.5 Italy
- 8.3.6 Rest of Europe
- 8.4 Asia Pacific
- 8.4.1 China
- 8.4.2 India
- 8.4.3 Japan
- 8.4.4 Australia
- 8.4.5 South Korea
- 8.4.6 Rest of Asia Pacific
- 8.5 Latin America
- 8.5.1 Brazil
- 8.5.2 Mexico
- 8.5.3 Argentina
- 8.5.4 Rest of Latin America
- 8.6 Middle East and Africa
- 8.6.1 Saudi Arabia
- 8.6.2 South Africa
- 8.6.3 UAE
- 8.6.4 Rest of Middle East and Africa
Chapter 9 Company Profiles
- 9.1 Yara International ASA
- 9.2 CF Industries Holdings, Inc.
- 9.3 Nutrien Ltd.
- 9.4 OCI N.V.
- 9.5 BASF SE
- 9.6 Fertiberia S.A.
- 9.7 Tata Chemicals Ltd.
- 9.8 Siemens Energy AG
- 9.9 Nel Hydrogen
- 9.10 thyssenkrupp Uhde
- 9.11 Profert
- 9.12 HIF Global
- 9.13 Haldor Topsoe A/S
- 9.14 Dyno Nobel
 生物炭肥料市場預測至2034年—全球原料、作物類型、生產技術、應用、最終用戶和區域分析
 緩釋肥料市場:2026-2032年全球市場預測(以包膜類型、作物類型、釋放週期、養分類型、施用方法、最終用途和銷售管道)
 緩釋肥料市場報告:按類型、形態、應用和地區分類(2026-2034年)
 2026年全球生物炭肥料市場報告幾丁質肥料市場:2026-2032年全球市場預測(按應用、類型、原料、配方和分銷管道分類)肥料包膜市場:2026-2032年全球市場預測(以包膜化學、釋放機制、包膜養分類型、外形規格、製造流程、最終用途及通路分類)化肥市場:2026-2032年全球市場預測(依產品類型、作物類型、包裝、施用方法、最終用戶和分銷管道分類)海藻土壤改良劑市場預測至 2034 年—按產品類型、海藻種類、形態、應用、養殖方法、通路和地區進行全球分析。藻類肥料市場:2026-2032年全球市場預測(依原料、產品類型、通路及應用分類)複合肥料市場:按產品類型、作物類型、物理形態和應用分類的全球市場預測,2026-2032年