


 |
市場調查報告書
商品編碼
2063887
管道服務:市場佔有率分析、產業趨勢與統計、成長預測(2026-2031 年)Pipeline Services - Market Share Analysis, Industry Trends & Statistics, Growth Forecasts (2026 - 2031) |
||||||

※ 本網頁內容可能與最新版本有所差異。詳細情況請與我們聯繫。
根據 Mordor Intelligence 預測,管道服務市場規模將從 2025 年的 452.8 億美元和 2026 年的 477.3 億美元成長到 2031 年的 648.7 億美元,2026 年至 2031 年的年複合成長率(CAGR)為 6.3%。
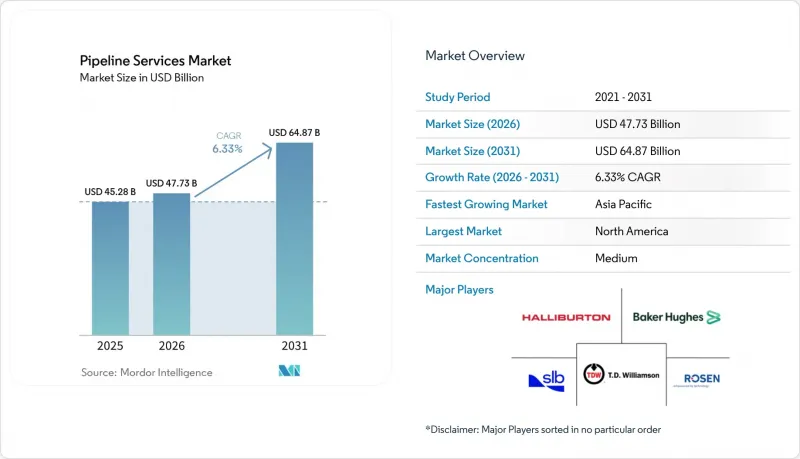
本報告按服務類型(試運行前、健康管理與監測、維護、退役等)、管道類型(石油、天然氣、成品油、水和工業管道)、應用領域(石油和天然氣等)以及地區(北美、歐洲、亞太、南美、中東和非洲)進行細分。市場預測以美元計價。
全球管道服務市場趨勢與洞察
全球石油和天然氣需求的成長正在推動管道網路的擴張。
沙烏地阿美公司投資88億美元的「天然氣主系統三期工程」和能源傳輸公司投資21億美元的「二疊紀盆地擴建工程」等大型企劃,新增了數千公里的輸氣管道,並簽訂了長達數十年的水壓測試和智慧清管服務合約。在東南亞,跨東協框架計畫在2030年建成4,500公里互聯管道,就要求試運行前專家能夠在洩漏測試中將誤報率控制在1%以下。計畫中的西非奈及利亞-摩洛哥天然氣管道橫跨13個國家,全長5,660公里,凸顯了全球新建設活動的擴張。每條管道線路都需要根據沙漠、熱帶氣候和沿海地區的具體情況,進行個性化的材料選擇、基於應力的設計以及持續的完整性監測。能夠提供整合工程、感測器安裝和合規服務的供應商,最能掌握這波新的市場需求。
老舊管線資產需要延壽服務
美國約65%的天然氣管道鋪設於1970年以前,歐洲北海管道網路的情況也類似,其平均管道使用年限超過40年。管道檢測數據顯示,管道有應力腐蝕開裂和輪胎邊緣缺陷,若不及時處理,可能導致管道破裂。安橋公司(Enbridge)耗資53億美元的幹線管道更新項目和印度耗資12億美元的海上管道完整性項目,清楚展現了巨額投資。複合材料加固、光纖聲學感測和預測分析等技術,可將管道使用壽命延長15至20年,並延緩數十億美元的更新成本。監管壓力也在不斷增加。美國管道和危險材料安全管理局(PHMSA)現已強制要求在發生嚴重事故高風險區域每五年進行一次檢查,加速了資料驅動型維護的普及。與損壞歷史指標掛鉤的保險費也進一步推動了預防性檢查週期的建立。
高昂的服務成本和停機時間的影響
對大口徑管道進行線上檢測的平均成本為每英里18,000至25,000美元,另加30%至40%的動員和數據分析費用,這對於無法享受規模經濟效益的中型企業而言是一筆不小的負擔。一條日輸油量50萬桶的原油管線停駛72小時(以每桶72美元計算),將造成3,600萬美元的運輸量損失。因此,營運商被鼓勵在獲利高峰期推遲一些非關鍵性作業。 API 1169認證檢測員的年薪高達120,000至160,000美元,而空缺率超過18%,推高了承包商的費用。原油價格的波動導致北美中游產業2024年的資本支出減少了120億美元,最佳化計畫的預算也被削減。以績效為基礎的合約(供應商承擔一定程度的績效風險)正變得越來越普遍,但這種合約在小規模營運商中尚未普及。
細分市場分析
2025年,由於營運商優先考慮延長管道壽命而非新建設,維護環節將佔管道處理和管道服務市場的56.9%。複合材料包覆、帶壓開孔隔離和雲分析等技術正在縮短維修週期,同時避免代價高昂的停機時間。結合清管器檢測數據和土壤腐蝕圖的預測演算法使營運商能夠推遲非緊急鑽探,直至達到風險閾值。隨著氫氣和二氧化碳管道的普及,以氮氣吹掃和真空乾燥為中心的試運行前服務市場佔有率正在擴大,儘管其基數仍然較小。管道完整性管理服務受益於PHMSA(管道和危險材料安全管理局)的規定,該規定要求在具有重大影響的區域進行五年一次的檢查。
檢測服務不斷發展,亞毫米級的檢測精度降低了誤報率,使人們能夠更有把握地決定是否推遲修復措施。在北海,管道退役日益受到關注,使用機器人切割和海底垃圾清除技術關閉40年歷史的管道。整合機器人技術、人工智慧增強型感測器和雲端視覺化技術的供應商,將平均維修時間縮短了35%,從而獲得了多年期綜合服務合約。因此,隨著全球維修預算的增加,與管道維護相關的管道處理和管道服務市場規模預計將持續成長。
區域分析
預計到2025年,北美將佔全球收入的36.3%,這主要得益於耗資309億美元的跨山輸油管擴建項目和安橋公司(Enbridge)的主幹線更換項目。該地區目前運作著270萬英里的管道,其中65%的管道鋪設於1970年之前,腐蝕防護是其支出計畫的核心。美國管道和危險材料安全管理局(PHMSA)的新規要求在受嚴重影響的區域進行季度甲烷調查,這加速了光學氣體成像無人機和光纖感測技術的部署。綜合服務提供者正在利用數位雙胞胎來爭取多年期的健康管理契約,而一些專業公司則在競相爭取剩餘海上管道的退役契約。
隨著中國新建1.5萬公里幹線管道,以及印度完成450公里長的梅薩納-巴廷達段管道建設,預計到2031年,亞太地區將實現7.8%的最高成長率。跨東協天然氣走廊和印尼城市供水管網的維修正在推動對洩漏檢測和非維修的需求。一家澳洲海事業者正在對一種用於深海回接作業的自主偵測車輛進行試點測試,該車輛可將作業週期縮短40%。區域監管機構正在收緊洩漏排放標準,並敦促營運商實施連續監測平台。
在歐洲,需要平衡老化的油氣資產與能源轉型專案。複合材料塗層和電化學保護技術可以將北海管道的使用壽命延長至多20年,而像HyNet North West和MosaHYc這樣的氫氣走廊則需要新的清潔技術和材料相容性測試。德國的OGE維修計畫表明,有針對性的投資可以在兩年內使現有管道具備輸送氫氣的能力。同時,從奈及利亞到摩洛哥的5,660公里天然氣管道凸顯了中東和非洲對需要健全完整性管理方案的大型企劃的龐大需求。在南美洲,儘管規模較小,但巴西鹽層下的開發正在加速海底管線完整性管理和氣體收集系統的安裝。
其他好處:
- Excel格式的市場預測(ME)表
- 3個月的分析師支持
目錄
第1章:引言
- 研究假設和市場定義
- 調查範圍
第2章:調查方法
第3章執行摘要
第4章 市場狀況
- 市場概覽
- 市場促進因素
- 全球石油和天然氣需求增加;管道網路擴張
- 增加跨國管道的資本投資和EPC合約
- 老舊管線資產需要延壽服務
- 提升營運效率:線上檢測、清管分析
- 氫氣和二氧化碳管道的出現,以及它們所需的新的清洗和試運行。
- 市場限制因素
- 高昂的服務成本和停機時間的影響
- 嚴格的健康、安全和環境合規負擔
- 由於原油和天然氣價格波動,營運維護預算已被推遲。
- 先進管道清管/機器人技術領域技術純熟勞工短缺
- 供應鏈分析
- 監理情勢
- 技術展望
- 波特五力模型
第5章 市場規模與成長預測
- 按服務類型
- 試運行前
- 完整性管理和監控
- 檢查(清管、沖洗及化學清洗、水壓試驗、乾燥等)
- 維護(包括維修和更換)
- 退休
- 按管道類型分類
- 石油管線
- 天然氣管道
- 精煉產品平臺
- 水和工業管道
- 透過使用
- 石油和天然氣
- 化工/石油化工
- 用水和污水業務
- 其他用途
- 按地區
- 北美洲
- 美國
- 加拿大
- 墨西哥
- 歐洲
- 德國
- 英國
- 法國
- 義大利
- 北歐國家
- 俄羅斯
- 其他歐洲國家
- 亞太地區
- 中國
- 印度
- 日本
- 韓國
- 東南亞國協
- 澳洲和紐西蘭
- 其他亞太國家
- 南美洲
- 巴西
- 阿根廷
- 哥倫比亞
- 其他南美國家
- 中東和非洲
- 沙烏地阿拉伯
- 阿拉伯聯合大公國
- 南非
- 奈及利亞
- 阿爾及利亞
- 其他中東和非洲國家
- 北美洲
第6章 競爭情勢
- 市場集中度
- 策略趨勢(併購、聯盟、購電協議)
- 市場佔有率分析(主要公司的市場排名和佔有率)
- 公司簡介
- Baker Hughes Company
- Halliburton Company
- Schlumberger Limited(SLB)
- ROSEN Group
- TD Williamson Inc.
- EnerMech Group
- IKM Gruppen AS
- Altus Intervention
- Penspen Limited
- LIN SCAN
- A.Hak Industrial Services
- NDT Global
- Quest Integrity
- Enduro Pipeline Services
- Dacon Inspection Services
- Onstream Pipeline Inspection
- Applus+
- SGS SA
- Intertek Group
- Gulf Interstate Engineering
第7章 市場機會與未來展望
According to Mordor Intelligence, the pipeline services market size is projected to expand from USD 45.28 billion in 2025 and USD 47.73 billion in 2026 to USD 64.87 billion by 2031, registering a CAGR of 6.33% between 2026 to 2031.
This report is Segmented by Service Type (Pre-Commissioning, Integrity Management and Monitoring, Maintenance, Decommissioning, and More), Pipeline Type (Oil, Natural-Gas, Refined-Product, and Water and Industrial), Application (Oil and Gas, and More), and Geography (North America, Europe, Asia-Pacific, South America and Middle Easrt and Africa). The Market Forecasts are Provided in Terms of Value (USD).
Global Pipeline Services Market Trends and Insights
Growing Global Oil and Gas Demand Driving Pipeline Network Expansion
Mega-projects such as Saudi Aramco's USD 8.8 billion Master Gas System Phase 3 and Energy Transfer's USD 2.1 billion Permian addition are adding thousands of kilometers of gathering and transmission lines, locking in multi-decade service contracts for hydrostatic testing and intelligent pigging . In Southeast Asia, the Trans-ASEAN framework targets 4,500 kilometers of interconnected pipelines by 2030, which will require pre-commissioning specialists able to achieve sub-1% false-call rates during leak checks . West Africa's planned Nigeria-Morocco Gas Pipeline stretches 5,660 kilometers across 13 countries, underscoring the global reach of new-build activity. Each of these corridors demands bespoke material selection, strain-based design, and continuous integrity monitoring to navigate deserts, tropical climates, and coastal crossings. Vendors capable of bundling engineering, sensor deployment, and regulatory support are best positioned to capitalize on the emerging capacity wave.
Aging Pipeline Assets Requiring Life-Extension Services
Roughly 65% of U.S. natural-gas transmission lines were installed before 1970, a profile mirrored by Europe's North Sea grid, where average asset age exceeds 40 years. Inline inspection data reveal stress-corrosion cracking and seam-weld flaws that, left unaddressed, can trigger ruptures. Enbridge's USD 5.3 billion Mainline replacement and India's USD 1.2 billion offshore integrity program illustrate the capital at stake. Composite wraps, fiber-optic acoustic sensing, and predictive analytics are extending asset life by 15-20 years, deferring billions in replacement outlays. Regulatory pressure is rising: PHMSA now mandates high-consequence area inspections every 5 years, accelerating adoption of data-driven maintenance. Insurance premiums tied to loss-history metrics further reinforce proactive inspection cycles.
High Service Cost and Downtime Impact
Large-diameter inline inspections average USD 18,000-25,000 per mile, with mobilization and data analysis adding 30-40%, a burden for midstream firms lacking scale economies. A 72-hour outage on a 500,000 bpd crude line equates to USD 36 million in lost throughput at USD 72 per barrel, incentivizing operators to defer non-critical runs during high-margin periods. Certified API 1169 inspectors command USD 120,000-160,000 salaries, and vacancy rates top 18%, inflating contractor rates. Volatile oil prices deferred USD 12 billion in North American midstream capital outlays in 2024, narrowing budgets for optimization projects. Outcome-based agreements, where vendors absorb some performance risk, are gaining ground but have yet to scale across smaller operators.
Other drivers and restraints analyzed in the detailed report include:
- Operational-Efficiency Push Through Inline Inspection and Pigging Analytics
- Emergence of Hydrogen and CO2 Pipelines Requiring Novel Cleaning and Commissioning
- Stringent HSE and Environmental Compliance Burden
For complete list of drivers and restraints, kindly check the Table Of Contents.
Segment Analysis
The maintenance segment accounted for 56.9% of the pipeline processing and pipeline services market in 2025 as operators prioritized life-extension over greenfield builds. Composite wraps, hot-tap isolation, and cloud analytics compress repair cycles while avoiding costly shutdowns. Predictive algorithms that blend pigging data with soil-corrosion maps enable operators to delay non-critical digs until risk thresholds are met. Pre-commissioning, centered on nitrogen purging and vacuum drying, is gaining share as hydrogen and CO2 lines proliferate, though from a smaller base. Integrity management services benefit from PHMSA rules mandating five-year inspection intervals in high-consequence areas.
Inspection services continue to evolve, with sub-millimeter detection lowering false-positive rates and enabling confident deferment of remediation. Decommissioning is emerging in the North Sea, where 40-year-old lines are retired via robotic cutting and subsea debris removal. Vendors able to integrate robotics, AI-enhanced sensors, and cloud visualization cut mean-time-to-repair by 35% and are rewarded with multi-year master service agreements. As a result, the pipeline processing and pipeline services market size tied to maintenance is forecast to rise in lockstep with global refurbishment budgets.
Geography Analysis
North America contributed 36.3% of global revenue in 2025, underpinned by the USD 30.9 billion Trans Mountain expansion and Enbridge's Mainline replacement. The region operates 2.7 million miles of pipelines, 65% of which were laid before 1970, placing corrosion mitigation at the center of spending plans. New PHMSA rules mandate methane surveys every six months in high-consequence areas, accelerating the adoption of optical-gas-imaging drones and fiber-optic sensing. Integrated providers leverage digital twins to win multi-year integrity deals, while niche firms capture decommissioning scopes for redundant offshore lines.
Asia-Pacific posts the quickest growth at 7.8% through 2031 as China adds 15,000 kilometers of trunk lines and India completes the 450-kilometer Mehsana-Bhatinda section. The Trans-ASEAN gas corridor and Indonesia's city-water overhaul drive demand for leak-detection and trenchless rehabilitation. Offshore operators in Australia experiment with autonomous inspection vehicles for deepwater tie-backs, cutting cycle time by 40%. Regional regulators tighten fugitive-emission standards, nudging operators toward continuous-monitoring platforms.
Europe balances aging hydrocarbon assets with energy-transition projects. Composite wraps and electrochemical protection extend North Sea pipelines by up to 20 years, while the HyNet North West and MosaHYc hydrogen corridors require novel cleaning and material-compatibility checks. Germany's OGE retrofit demonstrates how targeted investment can make legacy lines hydrogen-ready within two years. Meanwhile, Nigeria's 5,660-kilometer gas link to Morocco underscores the Middle East and Africa's appetite for mega-projects that demand robust integrity programs. South America remains smaller, yet Brazil's pre-salt developments and Argentina's Vaca Muerta shale spur subsea integrity and gathering-system installations.
- Baker Hughes Company
- Halliburton Company
- Schlumberger Limited (SLB)
- ROSEN Group
- T.D. Williamson Inc.
- EnerMech Group
- IKM Gruppen AS
- Altus Intervention
- Penspen Limited
- LIN SCAN
- A.Hak Industrial Services
- NDT Global
- Quest Integrity
- Enduro Pipeline Services
- Dacon Inspection Services
- Onstream Pipeline Inspection
- Applus+
- SGS SA
- Intertek Group
- Gulf Interstate Engineering
Additional Benefits:
- The market estimate (ME) sheet in Excel format
- 3 months of analyst support
TABLE OF CONTENTS
1 Introduction
- 1.1 Study Assumptions & Market Definition
- 1.2 Scope of the Study
2 Research Methodology
3 Executive Summary
4 Market Landscape
- 4.1 Market Overview
- 4.2 Market Drivers
- 4.2.1 Growing global oil & gas demand; pipeline network expansion
- 4.2.2 Rising cross-border pipeline CAPEX & EPC contracts
- 4.2.3 Aging pipeline assets needing life-extension services
- 4.2.4 Operational-efficiency push: inline inspection, pigging analytics
- 4.2.5 Emergence of hydrogen & CO2 pipelines needing novel cleaning/commissioning
- 4.3 Market Restraints
- 4.3.1 High service cost & downtime impact
- 4.3.2 Stringent HSE & environmental compliance burden
- 4.3.3 Volatile crude & gas prices deferring O&M budgets
- 4.3.4 Skilled-labour shortage for advanced pigging/robotics
- 4.4 Supply-Chain Analysis
- 4.5 Regulatory Landscape
- 4.6 Technological Outlook
- 4.7 Porter's Five Forces
- 4.7.1 Threat of New Entrants
- 4.7.2 Bargaining Power of Buyers
- 4.7.3 Bargaining Power of Suppliers
- 4.7.4 Threat of Substitutes
- 4.7.5 Competitive Rivalry
5 Market Size & Growth Forecasts
- 5.1 By Service Type
- 5.1.1 Pre-commissioning
- 5.1.2 Integrity Management and Monitoring
- 5.1.3 Inspection (Pigging, Flushing and Chemical Cleaning, Hydrostatic Testing, Drying, and Others)
- 5.1.4 Maintenance (Including Repair, Replace, etc.)
- 5.1.5 Decommissioning
- 5.2 By Pipeline Type
- 5.2.1 Oil Pipelines
- 5.2.2 Natural-Gas Pipelines
- 5.2.3 Refined-Product Pipelines
- 5.2.4 Water and Industrial Pipelines
- 5.3 By Application
- 5.3.1 Oil and Gas
- 5.3.2 Chemicals and Petrochemicals
- 5.3.3 Water and Waste-water Utilities
- 5.3.4 Other Applications
- 5.4 By Geography
- 5.4.1 North America
- 5.4.1.1 United States
- 5.4.1.2 Canada
- 5.4.1.3 Mexico
- 5.4.2 Europe
- 5.4.2.1 Germany
- 5.4.2.2 United Kingdom
- 5.4.2.3 France
- 5.4.2.4 Italy
- 5.4.2.5 NORDIC Countries
- 5.4.2.6 Russia
- 5.4.2.7 Rest of Europe
- 5.4.3 Asia-Pacific
- 5.4.3.1 China
- 5.4.3.2 India
- 5.4.3.3 Japan
- 5.4.3.4 South Korea
- 5.4.3.5 ASEAN Countries
- 5.4.3.6 Australia and New Zealand
- 5.4.3.7 Rest of Asia-Pacific
- 5.4.4 South America
- 5.4.4.1 Brazil
- 5.4.4.2 Argentina
- 5.4.4.3 Colombia
- 5.4.4.4 Rest of South America
- 5.4.5 Middle East and Africa
- 5.4.5.1 Saudi Arabia
- 5.4.5.2 United Arab Emirates
- 5.4.5.3 South Africa
- 5.4.5.4 Nigeria
- 5.4.5.5 Algeria
- 5.4.5.6 Rest of Middle East and Africa
- 5.4.1 North America
6 Competitive Landscape
- 6.1 Market Concentration
- 6.2 Strategic Moves (M&A, Partnerships, PPAs)
- 6.3 Market Share Analysis (Market Rank/Share for key companies)
- 6.4 Company Profiles (includes Global level Overview, Market level overview, Core Segments, Financials as available, Strategic Information, Products & Services, and Recent Developments)
- 6.4.1 Baker Hughes Company
- 6.4.2 Halliburton Company
- 6.4.3 Schlumberger Limited (SLB)
- 6.4.4 ROSEN Group
- 6.4.5 T.D. Williamson Inc.
- 6.4.6 EnerMech Group
- 6.4.7 IKM Gruppen AS
- 6.4.8 Altus Intervention
- 6.4.9 Penspen Limited
- 6.4.10 LIN SCAN
- 6.4.11 A.Hak Industrial Services
- 6.4.12 NDT Global
- 6.4.13 Quest Integrity
- 6.4.14 Enduro Pipeline Services
- 6.4.15 Dacon Inspection Services
- 6.4.16 Onstream Pipeline Inspection
- 6.4.17 Applus+
- 6.4.18 SGS SA
- 6.4.19 Intertek Group
- 6.4.20 Gulf Interstate Engineering
7 Market Opportunities & Future Outlook
- 7.1 White-space & unmet-need assessment

 智慧管道檢測市場:按技術、終端用戶產業和地區分類
 全球智慧管道檢測市場規模、佔有率、趨勢和成長分析報告(2026-2034年)
 智慧管道密封服務市場-全球產業規模、佔有率、趨勢、機會、預測:按應用、最終用途、地區和競爭格局分類,2021-2031年
 按船舶類型、推進方式、燃料類型、服務類型和最終用途產業試運行和作業支援船市場-全球預測,2026-2032年
 智慧管道清管市場規模、佔有率和成長分析(按管道類型、技術、應用和地區分類)-2026-2033年產業預測管道服務市場-全球產業規模、佔有率、趨勢、機會和預測,按服務類型、檢測服務、部署地點、地區和競爭格局分類,2020-2030 年預測
 智慧清管市場(按管道類型、技術、應用、國家和地區)-2025 年至 2032 年全球產業分析、市場規模、市場佔有率及預測智慧清管市場:2025 年至 2030 年預測
 智慧清管市場:市場佔有率分析、產業趨勢與成長預測(2025-2030 年)亞太地區智慧清管:市場佔有率分析、產業趨勢與成長預測(2025-2030 年)