


 |
市場調查報告書
商品編碼
2063828
智慧體可觀測性與管治:市場佔有率分析、產業趨勢與統計資料、成長預測(2026-2031)Agent Observability And Governance - Market Share Analysis, Industry Trends & Statistics, Growth Forecasts (2026 - 2031) |
||||||

※ 本網頁內容可能與最新版本有所差異。詳細情況請與我們聯繫。
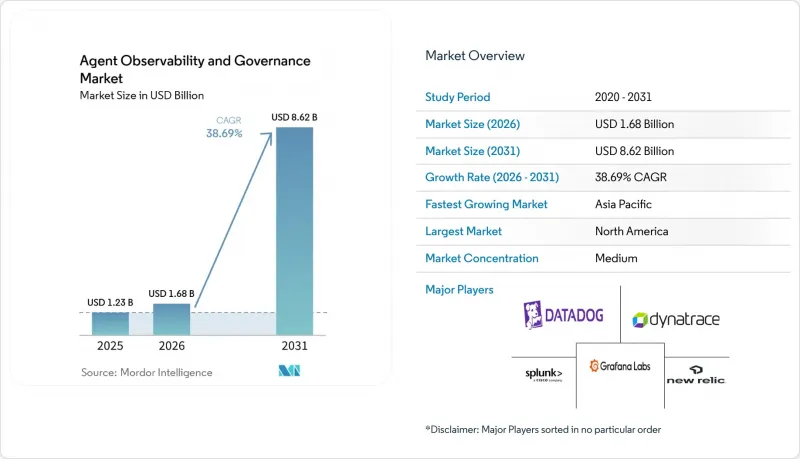
根據 Mordor Intelligence 預測,智慧體可觀測性和管治市場規模將從 2025 年的 12.3 億美元成長到 2026 年的 16.8 億美元,到 2031 年將達到 86.2 億美元,2026 年至 2031 年的複合年成長率為 38.69%。
本報告按組件(軟體和服務)、部署類型(雲端、本地部署、混合部署)、組織規模(大型企業和中小企業)、行業(銀行、金融服務和保險、醫療保健和生命科學、零售和電子商務、製造業等)以及地區進行細分。市場預測以美元計價。
全球智慧體可觀測性與管治市場趨勢及洞察
加速企業工作流程採用自主人工智慧代理
根據微軟向投資者披露的信息,財富 500 強企業採用自主代理的比例從 2024 年初的 18% 上升到 2025 年 12 月的 60%。這些代理現在可以執行採購核准、詐欺偵測和程式碼審查等任務,無需人工查核點即永續運作。雖然傳統的監控方式可以捕捉到延遲和錯誤,但卻無法捕捉到推理過程或政策合規記錄。為此, 銷售團隊在其 Agentforce 版本中整合決策級遙測功能,樹立了新的市場標準。金融監管機構也紛紛效仿,巴塞爾委員會在 2025 年 1 月的提案中強制要求對自動化信貸決策進行即時監控。商業性擴張和監管壓力的這種協同作用,使得可觀測性不再只是開發工具的購買,而是成為了董事會層面的合規優先事項。
監管機構正在加強對負責任的人工智慧實施的監督。
歐盟的《人工智慧法案》於2024年8月生效,該法案強制要求高風險系統必須具備技術文件、人工監督和審計追蹤功能,違規者將被處以最高可達全球收入7%的罰款。英國於2025年3月採納了針對特定產業的模式,賦予現有監管機構監督權。在美國,管理和預算辦公室(OMB)發布的M-24-10號備忘錄要求所有聯邦機構對其人工智慧系統進行清點和風險評估。 2025年2月,日本個人資訊保護委員會發布指導方針,呼籲對自動化決策進行可解釋性解釋。這些相互重疊的管理體制導致合規工作分散,從而使支援多司法管轄區政策範本和即時儀表板的平台更具優勢。
代理遙測缺乏互通性標準
截至2026年3月,針對特定代理的OpenTelemetry規範仍處於草案階段,導致廠商相容性緩慢。這迫使企業採用Datadog、Dynatrace或AWS的專有函式庫,增加了切換成本。 CNCF在2025年11月的一項調查發現,63%的多重雲端AI用戶將遙測碎片化列為他們面臨的三大挑戰之一。在混合環境中,由於需要手動整合三個平台的日誌,這項挑戰更加嚴峻,導致平均故障修復時間(MTTR)延長,可靠性降低。 Linux基金會於2026年初成立了一個工作小組,旨在加速標準化進程,但達成共識可能需要兩年時間。
細分市場分析
預計到2025年,軟體平台將佔總營收的68.32%,反映出企業競相使用現成的儀表板和OpenTelemetry資料擷取器來衡量人工智慧代理的趨勢。 Datadog和Dynatrace等供應商已發布LangChain、AutoGPT和Microsoft Semantic Kernel的插件,以縮短部署時間。然而,大型企業很快就意識到,將遙測技術整合到其內部風險管理和法律工作流程中,需要進行超出現有功能的客製化。
預計到2031年,服務業將以36.93%的複合年成長率成長,顯示產業結構正向外包專業知識轉變。全球顧問公司目前正將認證的人工智慧管治專家納入跨季度契約,從而推高了計費率。託管管治服務正受到無法容忍可觀測性差距的金融機構的青睞,預計代理可觀測性和管治服務的市場成長速度將超過軟體基礎設施。大多數公司缺乏將策略控制映射到代理決策路徑的內部人才,這進一步加劇了這一趨勢。
2025年,雲端採用將佔總支出的71.44%。這是因為越來越多的企業選擇與預先包裝的超大規模資料中心業者整合,例如Amazon Bedrock、Azure OpenAI和Google Cloud Vertex AI Agent Builder。公有雲的彈性擴展能力和快速的功能發布,使得公共雲端遙測成為許多企業的理想起點。然而,嚴格的資料主權法規以及對延遲高度敏感的銀行系統的特殊需求,仍然為全面遷移到雲端帶來了挑戰。
混合架構預計將以 37.13% 的複合年成長率成長,成為成長最快的部署模式。這類架構在本地部署資料收集器,過濾敏感資料有效負載,然後將清理後的元資料傳輸到雲端控制平面。 Cisco AppDynamics 和 IBM WatsonX 等解決方案正是這種分離式平面設計的典型代表。企業表示,混合模式使他們能夠在遵守本地資料保護條例的同時,受益於先進的雲端分析功能。預計混合部署將推動代理可觀測性和管治市場佔有率的成長。
區域分析
預計到2025年,北美將引領人工智慧技術發展,佔全球營收的38.27%。科技公司的早期採用、強勁的創業投資以及聯邦政府的採購要求正在加速這一領域的普及。美國管理和預算辦公室(OMB)強制要求所有政府機構對其人工智慧系統進行盤點,這推動了對提供符合FedRAMP標準的可觀測性解決方案的供應商的需求。加拿大提案的《個人資訊保護和電子文件法》(PIPEDA)修正案借鑒了歐洲的透明度法規,而墨西哥正在將對美國供應商的可觀測性要求擴展至整個美墨邊境地區(US-MCA)。
亞太地區預計將成為成長最快的地區,複合年成長率將達到41.53%。中國國務院的一項指令要求國營企業在2025年底前實施管治框架,而《生成式人工智慧安全條例(草案)》將可觀測性列為網路安全挑戰之一。日本於2025年3月制定的《負責任的人工智慧採購指南》正在加速電子產品製造商和金融機構的採用。印度的《數位個人資料保護法》正在推動公共部門開展試點項目,強制要求追蹤代理。東南亞國家正透過採用雲端原生技術堆疊來克服本地部署的局限性,從而擴大新興經濟體的代理可觀測性和管治市場。
在歐洲,人工智慧領域預計將保持穩定但緩慢的成長,這得益於人工智慧立法和ISO/IEC 42001認證的快速普及。德國的技術指南強制要求對高風險公共部門人工智慧進行遙測,而英國的行業特定監管則要求供應商提供行業專用模組。儘管該地區的總支出落後於北美,但合規性的複雜性為全端管治套件提供了永續的收入來源。南美和中東及非洲市場規模較小,但正受益於跨國公司在企業發展中部署標準化的可觀測性策略範本。
其他好處:
- Excel格式的市場預測(ME)表
- 3個月的分析師支持
目錄
第1章:引言
- 研究假設和市場定義
- 調查範圍
第2章:調查方法
第3章執行摘要
第4章 市場狀況
- 市場概覽
- 市場促進因素
- 加速企業工作流程採用自主人工智慧代理
- 加強對負責任的人工智慧實施的監管。
- 將雲端原生可觀測工具鏈納入主流
- 多智慧體LLM架構日益複雜
- 代理級安全和合規性要求的增加
- 人工智慧代理經營新創公司創業投資的創投激增。
- 市場限制因素
- 代理遙測缺乏互通性標準
- 企業平台整體擁有成本高
- 人工智慧管治框架方面具備專業知識的人員短缺
- 跨境部署中資料居住與主權面臨的障礙
- 宏觀經濟因素對市場的影響
- 產業價值鏈分析
- 監理情勢
- 技術展望
- 波特五力分析
第5章 市場規模與成長預測
- 按組件
- 軟體
- 服務
- 按實現類型
- 雲
- 現場
- 混合
- 按組織規模
- 大公司
- 小型企業
- 按行業分類
- BFSI
- 醫療保健和生命科學
- 零售與電子商務
- 製造業
- 資訊科技/通訊
- 政府/國防
- 其他工業部門
- 按地區
- 北美洲
- 美國
- 加拿大
- 墨西哥
- 南美洲
- 巴西
- 阿根廷
- 其他南美國家
- 歐洲
- 英國
- 德國
- 法國
- 義大利
- 西班牙
- 其他歐洲國家
- 亞太地區
- 中國
- 日本
- 印度
- 韓國
- 其他亞太國家
- 中東和非洲
- 中東
- 阿拉伯聯合大公國
- 沙烏地阿拉伯
- 其他中東國家
- 非洲
- 南非
- 埃及
- 其他非洲國家
- 中東
- 北美洲
第6章 競爭情勢
- 市場集中度
- 策略趨勢
- 市佔率分析
- 公司簡介
- Dynatrace Inc.
- Datadog Inc.
- New Relic Inc.
- Splunk Inc.
- Grafana Labs Inc.
- Honeycomb Inc.
- Observe Inc.
- OpenTelemetry Project(Cloud Native Computing Foundation)
- Cisco AppDynamics LLC
- LogicMonitor Inc.
- PagerDuty Inc.
- Snyk Limited
- Elastic NV
- Lightstep Inc.
- Harness Inc.
- ServiceNow Inc.
- IBM Corporation
- Microsoft Corporation
- Google LLC
- Amazon Web Services Inc.
第7章 市場機會與未來展望
According to Mordor Intelligence, the agent observability and governance market size is expected to grow from USD 1.23 billion in 2025 to USD 1.68 billion in 2026 and is forecast to reach USD 8.62 billion by 2031 at 38.69% CAGR over 2026-2031.
This report is Segmented by Component (Software and Services), Deployment Mode (Cloud, On-Premise, and Hybrid), Organization Size (Large Enterprises and Small and Medium Enterprises), Industry Vertical (BFSI, Healthcare and Life Sciences, Retail and E-Commerce, Manufacturing, and More), and Geography. The Market Forecasts are Provided in Terms of Value (USD).
Global Agent Observability And Governance Market Trends and Insights
Accelerating Adoption of Autonomous AI Agents in Enterprise Workflows
Fortune 500 deployment of autonomous agents climbed from 18% in early 2024 to 60% by December 2025, according to Microsoft investor disclosures. Agents now approve procurement, detect fraud, and review code, operating continuously without human checkpoints. Traditional monitoring captures latency and errors but fails to record reasoning chains or policy adherence. Salesforce responded by embedding decision-level telemetry in its Agentforce launch, setting a new market baseline. Financial regulators followed, with the Basel Committee's January 2025 proposal requiring real-time oversight of automated credit decisions. This convergence of commercial scale-up and regulatory pressure elevates observability from a dev-tool purchase to a boardroom compliance priority.
Increasing Regulatory Scrutiny Around Responsible AI Deployment
The European Union's AI Act, enforceable since August 2024, mandates technical documentation, human oversight, and audit trails for high-risk systems, with penalties up to 7% of global revenue. The United Kingdom adopted a sector-specific model in March 2025, assigning oversight to existing regulators. In the United States, the Office of Management and Budget memorandum M-24-10 requires every federal agency to inventory AI systems and assess their risks. Japan's privacy commission issued guidelines in February 2025 demanding explainability for automated decisions. These overlapping regimes fragment compliance, rewarding platforms that support multi-jurisdiction policy templates and real-time dashboards.
Lack of Interoperability Standards for Agent Telemetry
Agent-specific OpenTelemetry conventions remain in draft status as of March 2026, delaying cross-vendor compatibility. Enterprises, therefore, adopt proprietary libraries from Datadog, Dynatrace, or AWS, thereby increasing switching costs. A November 2025 CNCF survey showed 63% of multi-cloud AI users rank telemetry fragmentation among their top three pain points. Hybrid environments worsen the challenge when logs must be manually stitched across three platforms, extending mean-time-to-resolution and eroding confidence. Linux Foundation working groups launched in early 2026 aim to fast-track standardization, but consensus may take two years.
Other drivers and restraints analyzed in the detailed report include:
- Mainstream Shift to Cloud-Native Observability Toolchains
- Growing Complexity of Multi-Agent LLM Architectures
- High Total Cost of Ownership for Enterprise-Grade Platforms
For complete list of drivers and restraints, kindly check the Table Of Contents.
Segment Analysis
Software platforms represented 68.32% of 2025 revenue, reflecting enterprises that rushed to instrument AI agents with ready-made dashboards and OpenTelemetry collectors. Vendors such as Datadog and Dynatrace launched plug-ins for LangChain, AutoGPT, and Microsoft Semantic Kernel, shortening implementation timelines. Yet large organizations soon discovered that aligning telemetry with internal risk and legal workflows required customization beyond shrink-wrapped features.
The services segment is forecast to grow at a 36.93% CAGR through 2031, indicating a structural shift toward outsourced expertise. Global consultancies now embed certified AI governance professionals into multi-quarter engagements, driving premium billable rates. Managed-governance offerings gained traction among financial institutions that cannot tolerate observability gaps, signaling that the market for agent observability and governance services will expand faster than the software base. Skills scarcity reinforces this trend because most enterprises lack internal talent to map policy controls to agent decision paths.
Cloud deployments accounted for 71.44% of 2025 spending, as organizations increasingly opted for hyperscaler integrations that come pre-packaged with solutions such as Amazon Bedrock, Azure OpenAI, and Google Cloud Vertex AI Agent Builder. The ability to scale elastically and the availability of rapid feature releases have made public-cloud telemetry the preferred starting point for many businesses. However, strict data-sovereignty regulations and the specific needs of latency-sensitive banking systems continue to pose challenges to complete migration to the cloud.
Hybrid architectures are anticipated to grow at a compound annual growth rate (CAGR) of 37.13%, making it the fastest-growing deployment model. In these architectures, collectors are deployed on-premise to filter sensitive data payloads before forwarding sanitized metadata to a cloud-based control plane. Solutions such as Cisco AppDynamics and IBM watsonx are prime examples of this split-plane design. Enterprises have reported that hybrid models enable them to comply with regional data protection regulations while still benefiting from advanced cloud analytics. This combination is expected to drive the expansion of the agent observability and governance market share attributed to hybrid deployments.
Geography Analysis
North America led with 38.27% of 2025 revenue. Early-adopter technology companies, robust venture capital, and federal procurement mandates accelerate deployments. The Office of Management and Budget requires every agency to inventory AI systems, which funnels demand to observability vendors offering FedRAMP-ready solutions. Canada's proposed PIPEDA amendments mirror European transparency rules, while Mexico's manufacturing sector extends U.S. supplier observability requirements across the US-MCA corridor.
Asia-Pacific is projected to be the fastest-growing region, with a 41.53% CAGR. China's State Council directive forces state-owned enterprises to implement governance frameworks by the end of 2025, and draft generative-AI security rules elevate observability to a cybersecurity issue. Japan's March 2025 responsible-AI procurement guidelines accelerate adoption among electronics manufacturers and financial institutions. India's Digital Personal Data Protection Act prompts public-sector pilots that require agent tracing, and Southeast Asian nations leapfrog on-premise limitations by adopting cloud-native stacks, expanding the agent observability and governance market across emerging economies.
Europe grows at a moderate yet steady pace, underpinned by the AI Act and rapid uptake of ISO/IEC 42001 certification. Germany's technical guidelines require telemetry for high-risk public-sector AI, while the United Kingdom's sector-based oversight requires vendors to deliver vertical-specific modules. Although the region's overall spend trails North America, compliance complexity creates a durable revenue stream for full-stack governance suites. South America, the Middle East, and Africa maintain smaller bases but benefit from multinational rollouts that standardize observability policy templates across global footprints.
- Dynatrace Inc.
- Datadog Inc.
- New Relic Inc.
- Splunk Inc.
- Grafana Labs Inc.
- Honeycomb Inc.
- Observe Inc.
- OpenTelemetry Project (Cloud Native Computing Foundation)
- Cisco AppDynamics LLC
- LogicMonitor Inc.
- PagerDuty Inc.
- Snyk Limited
- Elastic N.V.
- Lightstep Inc.
- Harness Inc.
- ServiceNow Inc.
- IBM Corporation
- Microsoft Corporation
- Google LLC
- Amazon Web Services Inc.
Additional Benefits:
- The market estimate (ME) sheet in Excel format
- 3 months of analyst support
TABLE OF CONTENTS
1 INTRODUCTION
- 1.1 Study Assumptions and Market Definition
- 1.2 Scope of the Study
2 RESEARCH METHODOLOGY
3 EXECUTIVE SUMMARY
4 MARKET LANDSCAPE
- 4.1 Market Overview
- 4.2 Market Drivers
- 4.2.1 Accelerating Adoption of Autonomous AI Agents in Enterprise Workflows
- 4.2.2 Increasing Regulatory Scrutiny Around Responsible AI Deployment
- 4.2.3 Mainstream Shift to Cloud-Native Observability Toolchains
- 4.2.4 Growing Complexity of Multi-Agent LLM Architectures
- 4.2.5 Emergence of Agent-Level Security and Compliance Mandates
- 4.2.6 Venture Capital Funding Surge in AI Agent Ops Start-ups
- 4.3 Market Restraints
- 4.3.1 Lack of Interoperability Standards for Agent Telemetry
- 4.3.2 High Total Cost of Ownership for Enterprise-Grade Platforms
- 4.3.3 Shortage of Talent Skilled in AI Governance Frameworks
- 4.3.4 Data-Residency and Sovereignty Barriers in Cross-Border Deployments
- 4.4 Impact of Macroeconomic Factors on the Market
- 4.5 Industry Value Chain Analysis
- 4.6 Regulatory Landscape
- 4.7 Technological Outlook
- 4.8 Porter's Five Forces Analysis
- 4.8.1 Bargaining Power of Suppliers
- 4.8.2 Bargaining Power of Buyers
- 4.8.3 Threat of New Entrants
- 4.8.4 Threat of Substitutes
- 4.8.5 Intensity of Competitive Rivalry
5 MARKET SIZE AND GROWTH FORECASTS (VALUE)
- 5.1 By Component
- 5.1.1 Software
- 5.1.2 Services
- 5.2 By Deploymnt Mode
- 5.2.1 Cloud
- 5.2.2 On-Premise
- 5.2.3 Hybrid
- 5.3 By Organization Size
- 5.3.1 Large Enterprises
- 5.3.2 Small and Medium Enterprises
- 5.4 By Industry Vertical
- 5.4.1 BFSI
- 5.4.2 Healthcare and Life Sciences
- 5.4.3 Retail and E-Commerce
- 5.4.4 Manufacturing
- 5.4.5 IT and Telecom
- 5.4.6 Government and Defense
- 5.4.7 Other Industry Verticals
- 5.5 By Geography
- 5.5.1 North America
- 5.5.1.1 United States
- 5.5.1.2 Canada
- 5.5.1.3 Mexico
- 5.5.2 South America
- 5.5.2.1 Brazil
- 5.5.2.2 Argentina
- 5.5.2.3 Rest of South America
- 5.5.3 Europe
- 5.5.3.1 United Kingdom
- 5.5.3.2 Germany
- 5.5.3.3 France
- 5.5.3.4 Italy
- 5.5.3.5 Spain
- 5.5.3.6 Rest of Europe
- 5.5.4 Asia-Pacific
- 5.5.4.1 China
- 5.5.4.2 Japan
- 5.5.4.3 India
- 5.5.4.4 South Korea
- 5.5.4.5 Rest of Asia-Pacific
- 5.5.5 Middle East and Africa
- 5.5.5.1 Middle East
- 5.5.5.1.1 United Arab Emirates
- 5.5.5.1.2 Saudi Arabia
- 5.5.5.1.3 Rest of Middle East
- 5.5.5.2 Africa
- 5.5.5.2.1 South Africa
- 5.5.5.2.2 Egypt
- 5.5.5.2.3 Rest of Africa
- 5.5.5.1 Middle East
- 5.5.1 North America
6 COMPETITIVE LANDSCAPE
- 6.1 Market Concentration
- 6.2 Strategic Moves
- 6.3 Market Share Analysis
- 6.4 Company Profiles (includes Global Level Overview, Market Level Overview, Core Segments, Financials as available, Strategic Information, Market Rank/Share, Products and Services, Recent Developments)
- 6.4.1 Dynatrace Inc.
- 6.4.2 Datadog Inc.
- 6.4.3 New Relic Inc.
- 6.4.4 Splunk Inc.
- 6.4.5 Grafana Labs Inc.
- 6.4.6 Honeycomb Inc.
- 6.4.7 Observe Inc.
- 6.4.8 OpenTelemetry Project (Cloud Native Computing Foundation)
- 6.4.9 Cisco AppDynamics LLC
- 6.4.10 LogicMonitor Inc.
- 6.4.11 PagerDuty Inc.
- 6.4.12 Snyk Limited
- 6.4.13 Elastic N.V.
- 6.4.14 Lightstep Inc.
- 6.4.15 Harness Inc.
- 6.4.16 ServiceNow Inc.
- 6.4.17 IBM Corporation
- 6.4.18 Microsoft Corporation
- 6.4.19 Google LLC
- 6.4.20 Amazon Web Services Inc.
7 MARKET OPPORTUNITIES AND FUTURE OUTLOOK
- 7.1 White-Space and Unmet-Need Assessment

 可觀測性平台市場預測至 2034 年—按組件、部署模式、企業規模、可觀測性類型、應用、技術、最終用戶和地區分類的全球分析
 全球AI代理可觀測性市場:按提供、功能、監控模型類型、部署方式、組織規模和最終用戶行業分類—市場規模、行業動態、機會分析和預測(2026-2035年)
 資料可觀測性市場規模、佔有率和成長分析:按組件類型、資料管道架構類型、部署模型架構和地區分類-2026-2033年產業預測全球可觀測工具及平台市場:依組件、部署模式、可觀測性類型、遙測資料類型、功能及技術格局分類-市場規模、產業趨勢、機會分析及2026年至2035年預測
 IT可觀測性平台:市場佔有率分析、產業趨勢與統計數據、成長預測(2026-2031年)美國:通訊業者業務和IT服務預測(2025-2030年)
 可觀測性工具市場:按組件、資料類型和地區分類
 2026年全球大規模語言模型(LLM)推理防護措施市場報告2026年全球高效能分析設備(SAP HANA)系統、應用與資料處理諮詢服務市場報告2026年全球大規模語言模式(LLM)觀測平台市場報告