


 |
市場調查報告書
商品編碼
2063659
IT可觀測性平台:市場佔有率分析、產業趨勢與統計數據、成長預測(2026-2031年)IT Observability Platforms - Market Share Analysis, Industry Trends & Statistics, Growth Forecasts (2026 - 2031) |
||||||

※ 本網頁內容可能與最新版本有所差異。詳細情況請與我們聯繫。
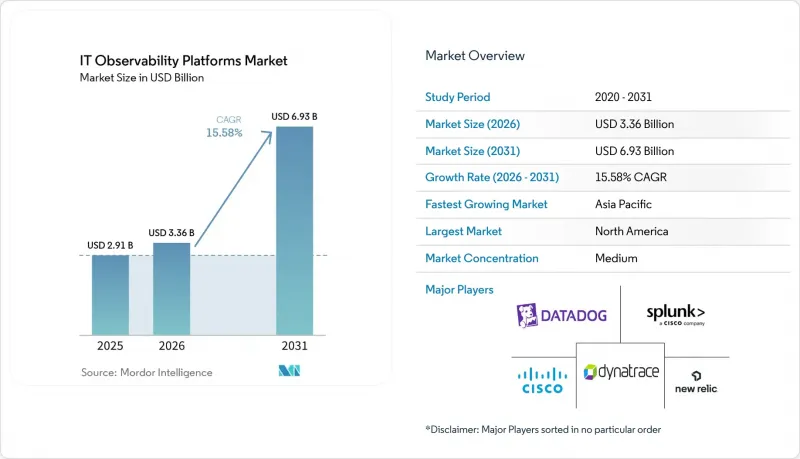
根據 Mordor Intelligence 預測,IT 可觀測平台市場將從 2025 年的 29.1 億美元成長到 2026 年的 33.6 億美元,到 2031 年達到 69.3 億美元,2026 年至 2031 年的複合年成長率為 15.58%。
本報告按組件(解決方案和服務)、應用(應用效能監控、基礎設施監控等)、最終用戶行業(IT和電信、銀行、金融服務和保險、零售和電子商務、媒體和娛樂等)、組織規模(大型企業和中小企業)以及地區進行細分。市場預測以價值(美元)為單位。
全球IT可觀測性平台市場趨勢與洞察
擴大雲端原生架構的應用
Kubernetes叢集、無伺服器函數和服務網格創建了臨時資源,取代了傳統的以主機為中心的監控方式。供應商目前正在建立能夠收集Petabyte級追蹤數據的彈性數據採集管道,而亞太地區的公司報告稱,雲端原生可觀測性帶來了 78% 的正投資回報率。 LogicMonitor 2025 版本新增了一個成本最佳化儀表板,將 GPU 使用與永續發展目標關聯起來,從而協調了 FinOps 和 GreenOps 指標。缺乏統一遙測的組織在 41% 的情況下會經歷嚴重的每週服務中斷,幾乎是全端部署中 24% 發生率的兩倍。隨著雲端原生成熟度的提高,對 IT 可觀測性平台的需求正在加速成長,這些促進因素的中期穩健性也日益鞏固。
整合人工智慧和機器學習以實現預測性洞察
AIOps正從簡單的告警關聯分析轉向自主修復。 ScienceLogic的Skylar Advisor將於2026年發布,它透過分析跨平台的工單和文檔,並推薦或實施糾正措施,從而縮短平均修復時間(MTTR)。 Elastic的AI SOC Engine融合了可觀測性和安全遙測數據,使團隊能夠以自然語言調查事件。預計到2025年,歐洲AI監控的採用率將飆升至50%,其中法國以62%的佔比領先。一項製造業案例研究表明,結合IT和營運數據的預測性維護可以實現2.6倍的投資回報率。這種顯著的生產力提升解釋了其對IT可觀測性平台市場的短期影響。
儲存和接收遙測資料的成本很高
遙測資料量每年成長超過 250%,但 70% 的預算卻用於從未查詢的日誌,這給財務管治帶來了巨大壓力。 Elastic 的研究表明,到 2025 年,97% 的公共機構將因冗餘管道而面臨意外帳單。儘管供應商現在提供智慧採樣和冷資料儲存層級,但治理成熟度仍然落後。 Sumo Logic 的 2024 年 Flex 許可計劃將透過解耦資料攝取和查詢定價來緩解帳單高峰,但這仍然需要流程變更。除非經濟狀況有所改善,否則一些公司可能會推遲平台升級,從而抑制短期成長。
細分市場分析
業務收益正以 18.28% 的複合年成長率 (CAGR) 成長,超過了 IT 可觀測平台市場的整體成長率。到 2025 年,解決方案支出將佔總支出的 67.63%,但企業越來越重視專業服務和託管服務,以簡化多重雲端遙測整合並實現 AIOps 工作流程的自動化。例如,LogicMonitor 的 AWS 遷移計畫表明,市場對供應商主導的複雜 IT 環境管理專業知識的需求日益成長。此外,採用生成式 AI 技術的政府機構正在尋求諮詢服務,以監控模型漂移並確保合規性,這進一步推動了該市場服務的普及。
對於缺乏有效IT可觀測性所需內部專業知識的中小型企業 (SME) 而言,託管服務尤其具有吸引力。計量型的套餐計劃,包括資料擷取、儲存和支持,可以幫助這些企業克服資本投資障礙,同時顯著縮短部署時間。此外,歐盟資料法的合規性要求也為審計、資料脫敏和管治等相關服務創造了新的機會。隨著開放核心平台不斷降低軟體成本,業務收益正成為供應商的策略對沖手段,即使授權收入成長放緩,也能支撐IT可觀測性平台市場的持續擴張。
到 2025 年,應用效能監控將佔總營收的 43.12%,但 AI 維運正以 22.49% 的複合年成長率 (CAGR) 高速成長,成為應用領域成長最快的細分市場。 AWS Marketplace 上提供的 Edwin AI 就是一個基於代理的自動化解決方案的典型例子,它可以將警報噪音降低高達 90%。平均修復時間 (MTTR) 超過 30 分鐘的企業正擴大採用 AIOps 解決方案來高效地對事件進行分類並自主執行腳本,從而提高營運效率並減少停機時間。
同時,在日誌管理領域,Sumo Logic 的無限資料擷取模式的推出導致了定價的商品化。這一轉變促使該領域更加重視更快的分析速度和更高的效能。 Honeycomb 計劃於 2026 年 3 月正式推出其「指標」功能,這是向整合遙測過渡的一個重要里程碑,並將為該公司在人工智慧主導的預算中佔據更大佔有率奠定基礎。同時,隨著平台整合安全資訊和事件管理 (SIEM) 功能以及可觀測性工具,安全性和合規性監控變得日益重要。這種整合凸顯了廣泛的 IT 可觀測性平台市場持續融合的趨勢,市場對全面無縫解決方案的需求也不斷成長。
區域分析
預計到2025年,北美將佔據最大的市場佔有率,達到36.74%,這主要得益於超大規模雲端服務供應商的存在以及成熟的DevOps文化。該地區高影響服務中斷的平均成本估計為每小時200萬美元,這推動了對先進解決方案的持續投資。全端平台已經證明其能夠顯著降低這些損失,許多公司報告稱損失降低了高達50%。此外,美國聯邦政府市場也是支出的主要驅動力,因為供應商正在積極尋求FedRAMP認證以滿足政府的嚴格要求。
在歐洲,監管對市場的影響顯著。 GDPR的實施以及即將訂定的資料保護法規要求企業有效管理遙測資料流,從而導致對內建資料脫敏和稽核追蹤功能的平台需求激增。法國在該地區處於領先地位,其年度預算中位數接近200萬美元,是歐洲支出最高的國家。相較之下,德國仍保持謹慎,28%的企業對可觀測性的價值提案表示不確定性。因此,歐洲各地的供應商正致力於工具整合和投資回報率(ROI)儀表板,以消除這些疑慮並提高採用率。
亞太地區是成長最快的地區,複合年成長率高達19.61%。這一成長主要得益於中國、印度和日本等國家所推行的數位主權法律。這些法律強制要求資料儲存在國內,並鼓勵採用混合解決方案。值得注意的是,該地區78%的組織報告投資報酬率(ROI)為正,62%的組織已經部署了人工智慧驅動的監控系統。印度和印尼的新創公司正在迅速採用雲端原生架構,跳過傳統工具,推動了IT可觀測性平台市場從相對較低的基數擴張。南美和中東及非洲等新興地區也在經歷成長,這得益於通訊基礎設施的現代化和公共部門的數位化舉措。然而,技能短缺和預算限制等挑戰仍然限制著這些地區的市場滲透率。
其他好處:
- Excel格式的市場預測(ME)表
- 3個月的分析師支持
目錄
第1章:引言
- 研究假設和市場定義
- 調查範圍
第2章:調查方法
第3章執行摘要
第4章 市場狀況
- 市場概覽
- 市場促進因素
- 雲端原生架構的廣泛應用
- 整合人工智慧和機器學習以實現預測性洞察
- 透過以 OpenTelemetry 為中心的標準化消除供應商鎖定
- 擴展DevOps和站點可靠性工程實踐
- 向基於消費的定價模式過渡
- 對即時安全性和合規性監控的需求日益成長
- 市場限制因素
- 儲存和接收遙測資料的成本很高
- 雲端運算和可觀測性領域的人才短缺
- 工具鏈的激增使得整合視覺化變得困難。
- 對廠商鎖定的擔憂限制了軟體的可移植性。
- 宏觀經濟因素對市場的影響
- 產業價值鏈分析
- 監理情勢
- 技術展望
- 波特五力分析
第5章 市場規模與成長預測
- 按組件
- 解決方案(平台/工具)
- 服務
- 諮詢和顧問服務
- 整合與部署
- 支援與維護
- 透過使用
- 應用效能監控
- 基礎設施監控
- 日誌管理與分析
- 安全性和合規監控
- 數位體驗監測
- 按最終用戶行業分類
- 資訊科技/通訊
- BFSI
- 零售與電子商務
- 醫療保健和生命科學
- 製造業
- 政府/公共部門
- 媒體與娛樂
- 其他終端用戶產業
- 按組織規模
- 大公司
- 小型企業
- 按地區
- 北美洲
- 美國
- 加拿大
- 墨西哥
- 南美洲
- 巴西
- 阿根廷
- 其他南美國家
- 歐洲
- 英國
- 德國
- 法國
- 義大利
- 西班牙
- 其他歐洲國家
- 亞太地區
- 中國
- 日本
- 印度
- 韓國
- 其他亞太國家
- 中東和非洲
- 中東
- 阿拉伯聯合大公國
- 沙烏地阿拉伯
- 其他中東國家
- 非洲
- 南非
- 埃及
- 其他非洲國家
- 中東
- 北美洲
第6章 競爭情勢
- 市場集中度
- 策略趨勢
- 市佔率分析
- 公司簡介
- Datadog, Inc.
- New Relic, Inc.
- Splunk Inc.
- Dynatrace, Inc.
- Cisco Systems, Inc.(AppDynamics)
- Elastic NV
- Grafana Labs, Inc.
- Honeycomb, Inc.
- Lightstep, Inc.(ServiceNow)
- LogicMonitor, Inc.
- ScienceLogic, Inc.
- Sumo Logic, Inc.
- Broadcom Inc.(DX Unified)
- Riverbed Technology LLC
- Nexthink SA
- StackState BV
- Acceldata, Inc.
- Atatus, Inc.
- Auvik Networks Inc.
- SolarWinds Corporation
第7章 市場機會與未來展望
According to Mordor Intelligence, the iT observability platforms market size is expected to increase from USD 2.91 billion in 2025 to USD 3.36 billion in 2026 and reach USD 6.93 billion by 2031, growing at a CAGR of 15.58% over 2026-2031.
This report is Segmented by Component (Solutions, and Services), Application (Application Performance Monitoring, Infrastructure Monitoring, and More), End-User Industry (IT and Telecom, BFSI, Retail and E-Commerce, Media and Entertainment, and More), Organization Size (Large Enterprises, and Small and Medium Enterprises), and Geography. The Market Forecasts are Provided in Terms of Value (USD).
Global IT Observability Platforms Market Trends and Insights
Growing Adoption of Cloud-Native Architectures
Kubernetes clusters, serverless functions, and service meshes create ephemeral resources that break traditional host-centric monitoring. Vendors now build elastic ingestion pipelines capable of petabyte-scale trace capture, while enterprises in Asia-Pacific report a 78% positive ROI from cloud-native observability. LogicMonitor's 2025 release added cost-optimization dashboards that correlate GPU usage with sustainability targets, aligning FinOps and GreenOps metrics. Organizations lacking unified telemetry suffer weekly high-impact outages in 41% of cases, almost double the 24% rate among full-stack adopters. As cloud-native maturity rises, demand for IT Observability Platforms accelerates, cementing this driver's medium-term strength.
Integration of AI and ML for Predictive Insights
AIOps is shifting from simple alert correlation toward autonomous remediation. ScienceLogic's Skylar Advisor, launched in 2026, reasons across tickets and documentation to recommend or execute fixes, shrinking mean time to resolution. Elastic's AI SOC Engine fuses observability and security telemetry, letting teams interrogate incidents in natural language. Europe saw AI monitoring adoption jump to 50% in 2025, with France leading at 62%. Manufacturing case studies show a 2.6X ROI when predictive maintenance combines IT and operational data. The clear productivity payoff explains the short-term impact on the IT Observability Platforms market.
High Telemetry Storage and Ingestion Costs
Telemetry volumes climb by more than 250% each year, yet 70% of budgets go to logs that are never queried, straining financial models. Elastic found 97% of public-sector bodies faced surprise bills in 2025 due to verbose pipelines. Vendors now offer intelligent sampling and cold-storage tiers, but governance maturity lags. Sumo Logic's 2024 Flex Licensing, which decouples ingestion from query pricing, reduces bill shock yet still demands process change. Unless economics improve, some enterprises may delay platform upgrades, capping near-term growth.
Other drivers and restraints analyzed in the detailed report include:
- Standardization Around OpenTelemetry Reducing Vendor Lock-In
- Expansion of DevOps and Site Reliability Engineering Practices
- Talent Shortage in Cloud and Observability Skill Sets
For complete list of drivers and restraints, kindly check the Table Of Contents.
Segment Analysis
Services revenue is growing at a 18.28% CAGR, outpacing overall IT Observability Platforms market growth. In 2025, solutions accounted for 67.63% of spending; however, enterprises are increasingly prioritizing professional and managed services to streamline multi-cloud telemetry integration and automate AIOps workflows. For instance, LogicMonitor's AWS migration program highlights the growing demand for vendor-led expertise in managing complex IT environments. Additionally, government agencies adopting generative AI technologies are seeking advisory packages to monitor model drift and ensure compliance, further driving the uptake of services in this market.
Managed services are particularly appealing to SMEs that often lack the in-house expertise required for effective IT observability. Consumption-based bundles, which include ingestion, storage, and support, help these businesses overcome capital expenditure barriers while significantly reducing deployment timelines. Furthermore, compliance requirements under the EU Data Act are creating new opportunities for services related to audit, data masking, and governance. As open-core platforms continue to lower software costs, service revenue is emerging as a strategic hedge for vendors, helping ensure the IT Observability Platforms market size continues to expand even if license revenue growth stabilizes.
Application performance monitoring accounted for 43.12% of 2025 revenue, yet AI operations are experiencing rapid growth, with a compound annual growth rate (CAGR) of 22.49%, making it the fastest-growing segment among applications. Edwin AI, available in the AWS Marketplace, is a prime example of agentic automation that can reduce alert noise by up to 90%. Enterprises struggling with mean time to resolution (MTTR) exceeding 30 minutes are increasingly adopting AIOps solutions to efficiently triage incidents and execute scripts autonomously, thereby improving operational efficiency and reducing downtime.
Log management, on the other hand, is undergoing pricing commoditization following Sumo Logic's introduction of an unlimited ingestion model. This shift has redirected the segment's focus toward improving the speed and performance of analytics. Honeycomb's planned general availability of its Metrics feature in March 2026 marks a significant milestone in its transition to unified telemetry, positioning the company to capture a larger share of AI-driven budgets. Meanwhile, security and compliance monitoring are becoming increasingly critical as platforms integrate Security Information and Event Management (SIEM) capabilities with observability tools. This integration highlights the ongoing convergence trend within the broader IT Observability Platforms market, where the demand for comprehensive and seamless solutions continues to grow.
Geography Analysis
North America accounted for the largest share of 36.74% in 2025, driven by the presence of hyperscale cloud providers and a well-established DevOps culture. The region's median high-impact outage costs, estimated at USD 2 million per hour, have encouraged continuous investments in advanced solutions. Full-stack platforms have already demonstrated their ability to significantly reduce these losses, with many enterprises reporting a 50% reduction. Additionally, the United States federal market has been a key driver of spending, as vendors actively pursue FedRAMP authorizations to meet stringent government requirements.
Europe demonstrates a strong regulatory influence on the market. The implementation of GDPR and the upcoming Data Act mandate that companies manage telemetry flows effectively, thereby increasing demand for platforms equipped with built-in masking and audit-trail capabilities. France leads the region with median annual budgets nearing USD 2 million, reflecting the highest spending levels in Europe. In contrast, Germany remains more cautious, with 28% of firms still uncertain about the value proposition of observability. As a result, vendors across the continent are focusing on tool consolidation and ROI dashboards to address these concerns and enhance adoption rates.
Asia-Pacific is the fastest-growing geography, with a compound annual growth rate (CAGR) of 19.61%. The region's growth is fueled by digital sovereignty laws in countries such as China, India, and Japan, which require data storage within the country and have prompted the adoption of hybrid solutions. Notably, 78% of organizations in the region report positive returns on investment (ROI), and 62% have already implemented AI-driven monitoring systems. Startups in India and Indonesia are rapidly adopting cloud-native architectures, bypassing legacy tools and driving the expansion of the IT Observability Platforms market from a relatively low base. Emerging regions, including South America, the Middle East, and Africa, are also experiencing growth, driven by telecom modernization and public-sector digitalization initiatives. However, challenges such as skills shortages and budget constraints continue to limit market penetration in these areas.
- Datadog, Inc.
- New Relic, Inc.
- Splunk Inc.
- Dynatrace, Inc.
- Cisco Systems, Inc. (AppDynamics)
- Elastic N.V.
- Grafana Labs, Inc.
- Honeycomb, Inc.
- Lightstep, Inc. (ServiceNow)
- LogicMonitor, Inc.
- ScienceLogic, Inc.
- Sumo Logic, Inc.
- Broadcom Inc. (DX Unified)
- Riverbed Technology LLC
- Nexthink SA
- StackState B.V.
- Acceldata, Inc.
- Atatus, Inc.
- Auvik Networks Inc.
- SolarWinds Corporation
Additional Benefits:
- The market estimate (ME) sheet in Excel format
- 3 months of analyst support
TABLE OF CONTENTS
1 INTRODUCTION
- 1.1 Study Assumptions and Market Definition
- 1.2 Scope of the Study
2 RESEARCH METHODOLOGY
3 EXECUTIVE SUMMARY
4 MARKET LANDSCAPE
- 4.1 Market Overview
- 4.2 Market Drivers
- 4.2.1 Growing Adoption of Cloud-Native Architectures
- 4.2.2 Integration of AI and ML for Predictive Insights
- 4.2.3 Standardization Around OpenTelemetry Reducing Vendor Lock-In
- 4.2.4 Expansion of DevOps and Site Reliability Engineering Practices
- 4.2.5 Shift Toward Consumption-Based Pricing Models
- 4.2.6 Rising Demand for Real-Time Security and Compliance Monitoring
- 4.3 Market Restraints
- 4.3.1 High Telemetry Storage and Ingestion Costs
- 4.3.2 Talent Shortage in Cloud and Observability Skill Sets
- 4.3.3 Tool-Chain Sprawl Complicating Unified Visibility
- 4.3.4 Vendor Lock-In Concerns Limiting Portability
- 4.4 Impact of Macroeconomic Factors on the Market
- 4.5 Industry Value Chain Analysis
- 4.6 Regulatory Landscape
- 4.7 Technological Outlook
- 4.8 Porter's Five Forces Analysis
- 4.8.1 Bargaining Power of Suppliers
- 4.8.2 Bargaining Power of Buyers
- 4.8.3 Threat of New Entrants
- 4.8.4 Threat of Substitutes
- 4.8.5 Intensity of Competitive Rivalry
5 MARKET SIZE AND GROWTH FORECASTS (VALUE)
- 5.1 By Component
- 5.1.1 Solutions (Platforms/Tools)
- 5.1.2 Services
- 5.1.2.1 Consulting and Advisory
- 5.1.2.2 Integration and Deployment
- 5.1.2.3 Support and Maintenance
- 5.2 By Application
- 5.2.1 Application Performance Monitoring
- 5.2.2 Infrastructure Monitoring
- 5.2.3 Log Management and Analytics
- 5.2.4 Security and Compliance Monitoring
- 5.2.5 Digital Experience Monitoring
- 5.3 By End-user Industry
- 5.3.1 IT and Telecom
- 5.3.2 BFSI
- 5.3.3 Retail and E-commerce
- 5.3.4 Healthcare and Life Sciences
- 5.3.5 Manufacturing
- 5.3.6 Government and Public Sector
- 5.3.7 Media and Entertainment
- 5.3.8 Other End-user Industries
- 5.4 By Organization Size
- 5.4.1 Large Enterprises
- 5.4.2 Small and Medium Enterprises
- 5.5 By Geography
- 5.5.1 North America
- 5.5.1.1 United States
- 5.5.1.2 Canada
- 5.5.1.3 Mexico
- 5.5.2 South America
- 5.5.2.1 Brazil
- 5.5.2.2 Argentina
- 5.5.2.3 Rest of South America
- 5.5.3 Europe
- 5.5.3.1 United Kingdom
- 5.5.3.2 Germany
- 5.5.3.3 France
- 5.5.3.4 Italy
- 5.5.3.5 Spain
- 5.5.3.6 Rest of Europe
- 5.5.4 Asia-Pacific
- 5.5.4.1 China
- 5.5.4.2 Japan
- 5.5.4.3 India
- 5.5.4.4 South Korea
- 5.5.4.5 Rest of Asia-Pacific
- 5.5.5 Middle East and Africa
- 5.5.5.1 Middle East
- 5.5.5.1.1 United Arab Emirates
- 5.5.5.1.2 Saudi Arabia
- 5.5.5.1.3 Rest of Middle East
- 5.5.5.2 Africa
- 5.5.5.2.1 South Africa
- 5.5.5.2.2 Egypt
- 5.5.5.2.3 Rest of Africa
- 5.5.5.1 Middle East
- 5.5.1 North America
6 COMPETITIVE LANDSCAPE
- 6.1 Market Concentration
- 6.2 Strategic Moves
- 6.3 Market Share Analysis
- 6.4 Company Profiles (includes Global Level Overview, Market Level Overview, Core Segments, Financials as available, Strategic Information, Market Rank/Share, Products and Services, Recent Developments)
- 6.4.1 Datadog, Inc.
- 6.4.2 New Relic, Inc.
- 6.4.3 Splunk Inc.
- 6.4.4 Dynatrace, Inc.
- 6.4.5 Cisco Systems, Inc. (AppDynamics)
- 6.4.6 Elastic N.V.
- 6.4.7 Grafana Labs, Inc.
- 6.4.8 Honeycomb, Inc.
- 6.4.9 Lightstep, Inc. (ServiceNow)
- 6.4.10 LogicMonitor, Inc.
- 6.4.11 ScienceLogic, Inc.
- 6.4.12 Sumo Logic, Inc.
- 6.4.13 Broadcom Inc. (DX Unified)
- 6.4.14 Riverbed Technology LLC
- 6.4.15 Nexthink SA
- 6.4.16 StackState B.V.
- 6.4.17 Acceldata, Inc.
- 6.4.18 Atatus, Inc.
- 6.4.19 Auvik Networks Inc.
- 6.4.20 SolarWinds Corporation
7 MARKET OPPORTUNITIES AND FUTURE OUTLOOK
- 7.1 White-Space and Unmet-Need Assessment

 可觀測性平台市場預測至 2034 年—按組件、部署模式、企業規模、可觀測性類型、應用、技術、最終用戶和地區分類的全球分析
 全球AI代理可觀測性市場:按提供、功能、監控模型類型、部署方式、組織規模和最終用戶行業分類—市場規模、行業動態、機會分析和預測(2026-2035年)
 資料可觀測性市場規模、佔有率和成長分析:按組件類型、資料管道架構類型、部署模型架構和地區分類-2026-2033年產業預測全球可觀測工具及平台市場:依組件、部署模式、可觀測性類型、遙測資料類型、功能及技術格局分類-市場規模、產業趨勢、機會分析及2026年至2035年預測
 智慧體可觀測性與管治:市場佔有率分析、產業趨勢與統計資料、成長預測(2026-2031)美國:通訊業者業務和IT服務預測(2025-2030年)
 可觀測性工具市場:按組件、資料類型和地區分類
 2026年全球大規模語言模型(LLM)推理防護措施市場報告2026年全球高效能分析設備(SAP HANA)系統、應用與資料處理諮詢服務市場報告2026年全球大規模語言模式(LLM)觀測平台市場報告