


 |
市場調查報告書
商品編碼
2063665
平台工程和內部開發者平台(IDP):市場佔有率分析、行業趨勢和統計數據以及成長預測(2026-2031 年)Platform Engineering And Internal Developer Platform (IDP) - Market Share Analysis, Industry Trends & Statistics, Growth Forecasts (2026 - 2031) |
||||||

※ 本網頁內容可能與最新版本有所差異。詳細情況請與我們聯繫。
根據 Mordor Intelligence 預測,平台工程和內部開發者平台 (IDP) 的市場規模預計將從 2026 年的 104.4 億美元成長到 2031 年的 315.7 億美元,2026 年至 2031 年的複合年成長率為 24.77%。
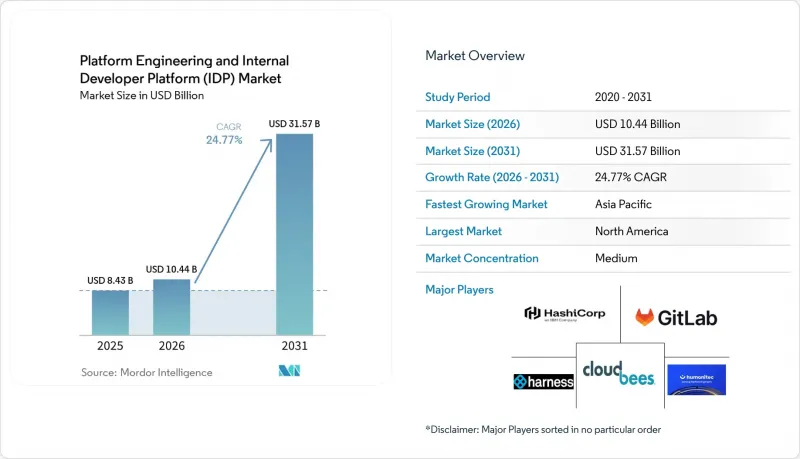
本報告按平台組件(例如基礎設施自動化層)、部署模式(本地部署、雲端部署、混合部署)、組織規模(大型企業、中小企業)、最終用戶產業(例如技術軟體和金融服務)以及地區進行細分。市場預測以美元計價。
全球平台工程與內部開發者平台 (IDP) 市場趨勢與洞察
加速向雲端原生架構轉型
預計到 2025 年,雲端原生工作負載將佔生產環境的 82%,但 Kubernetes 的引入,以及其 50 多種核心資源類型(每種類型都有數十個配置參數),大大增加了運維負擔。目前,內部開發平台預設配置命名空間、資料擷取和策略包,從而避免了 YAML 檔案的氾濫,並縮短了發布週期。在諾基亞 5G 核心網路等早期部署中,消除手動叢集漂移已使每次發布節省了數百小時的工程工作量。金融機構透過將巴塞爾協議 III 和審計日誌策略直接整合到範本中,在不影響產品交付速度的情況下確保了合規性。隨著託管 Kubernetes 服務不斷增加邊緣運算和多網路功能,抽象層對於保持開發者體驗的簡潔性仍然至關重要。
對提高開發人員生產力的需求日益成長
在採用該平台之前,開發人員每周大約有 35% 的時間花費在基礎設施任務上,這拖慢了功能開發的步伐。營運成熟平台的企業報告稱,部署頻率提高了近 40%,平均恢復時間縮短了約 25%。這些指標轉化為更強的競爭優勢。由於 Shopify 遷移到可組合的管理介面,101 個團隊現在每天可以處理 6700 萬次頁面瀏覽量。這得歸功於平台主導的自動化。諸如 GDPR 之類的法規結構將「隱私設計」原則納入黃金路徑,從而無需開發人員手動處理敏感資料。憑藉每月約 1000 美元的經濟實惠的 SaaS 訂閱,這些生產力提升也正在惠及資源有限的中型企業。
前期投入龐大,用於建構內部平台。
建造一個可用於生產環境的平台通常需要 3-5 名全職工程師,耗時長達 18 個月,僅人事費用就高達 15 萬至 65 萬美元,這還不包括工具和雲端費用。如此巨大的資金壓力迫使許多中小企業 (SME) 放棄市場,儘管中小企業佔全球企業的大多數,但到 2025 年,其支出僅佔總支出的 38.62%。持續的功能迭代、定期的安全性修補程式和使用者體驗的改進都推高了生命週期成本,促使一些公司採用訂閱式服務。 Software Defined Automation 在完成 1000 萬美元的種子輪過程後,於 2026 年 2 月獲得 ISO 27001 認證,這清楚地表明了合規成本是如何推高整體成本的。
細分市場分析
預計到 2025 年,開發人員的自助服務入口網站將佔總收入的 34.87%,這反映出企業早期階段對工作流程自動化的重視。由於門戶仍然是開發者創建新服務的主要入口,因此預計其在平台工程和內部開發者平台市場規模中的領先主導將繼續保持。同時,受 OpenTelemetry 的推動,可觀測性和遙測領域預計將以 25.77% 的年成長率成長。 OpenTelemetry 要求在所有黃金路徑中採用「追蹤優先」的設計理念。如今,整合套件已將指標、追蹤和日誌整合到初始框架中,所有微服務無需開發者執行額外步驟即可發送數據,從而確保在效能下降影響用戶之前將其捕獲。
同時,將持續整合/持續交付 (CI/CD)編配整合到平台藍圖中已成為一種趨勢,67% 的受訪者認為 GitOps 是 2025 年的最佳交付模式。基礎設施自動化元件(例如 Pulumi 的 OpenAPI 版本)將各種雲端 REST 端點抽象化到統一的 API 之後,從而促進多提供者工作流程。管治和安全層整合了 Open Policy Agent,在准入控制器階段強制執行安全防護措施。綜上所述,這些因素表明平台工程和內部開發者平台 (IDP) 市場正在從獨立模組轉向“意見包”,以最大限度地減少配置債務。
到 2025 年,由於成熟的託管 Kubernetes 服務降低了維運負擔,雲端部署將佔平台工程和內部開發人員平台市場的 46.32%。然而,混合拓樸預計將以 35.37% 的年均成長率成長,比整體市場複合年成長率高出 10 個百分點以上。這項轉變的驅動力來自監管要求,例如歐洲的《數位營運彈性法案》,該法案要求銀行在開發環境中利用公共雲端的可擴展性的同時,維護本地災害復原區。平台抽象整合了這些不同的環境,為開發人員提供統一的 API,無論其工作負載最終位於何處。
沃達豐檢驗的OpenShift 模式展示了 GitOps 如何將邊緣叢集與集中式管理叢集同步。雖然本地部署對於與空氣間隙的防禦工作負載仍然至關重要,但Oracle等公司推出的主權雲端正在削弱純粹本地部署的必要性。隨著多重雲端採用率的提高,平台藍圖必須隱藏特定於提供者的底層機制。這種設計轉變正在推動混合環境的發展,並將獨立於供應商的編配確立為必要功能。
區域分析
北美地區Kubernetes普及率高,平台團隊組成較早,預計到2025年將佔全球收入的41.68%。美國公司正將PCI-DSS 4.0和SOC 2 Type 2控制措施直接整合到其黃金流程中,使開發人員能夠發布程式碼而無需受合規性審查的困擾。該地區的薪資水準比DevOps基準值高出27%,這吸引了大量人才,但也加劇了招募壓力。因此,企業正在將重複性的平台維護任務自動化。加拿大和墨西哥也遵循類似的路徑,對其資料管道進行現代化改造,以管理受類似GDPR法規監管的跨國資料流。
亞太地區正以24.89%的複合年成長率快速成長,這主要得益於印度和中國強制推行的主權雲。因此,建構一個抽象層來處理跨區域的工作負載,並提供統一的開發者介面,顯得特別重要。雲端原生運算基金會(CNCF)最近的一項調查顯示,該地區87%的公司已經實施或正在規劃平台項目,這表明平台工程和內部開發者平台市場將持續保持兩位數的成長。日本和韓國在成熟應用階段處於徵兆,而印度的科技服務巨頭正在整合內部平台,以實現面向全球客戶的服務交付標準化。人才短缺問題依然嚴峻,因此人工智慧驅動的平台正在填補營運上的空白。
歐洲的市佔率維持適中,但在《數位營運彈性法案》、《網路與資訊安全指令II》(NIS II)和《一般資料保護規則》(GDPR)在軟體供應鏈保障方面交叉的領域,採用率正在加速提升。在英國、德國和法國,支出主要集中在依賴平台級策略制定的銀行和電信用例。南美洲的採用率才剛起步。巴西和阿根廷正在進行核心銀行系統的現代化改造,但小規模的IT生態系統阻礙了其普及。在中東和非洲,阿拉伯聯合大公國和沙烏地阿拉伯在需要平台抽象的主權雲方面處於領先地位,而撒哈拉以南非洲則面臨基礎設施不平衡的問題。
其他好處:
- Excel格式的市場預測(ME)表
- 3個月的分析師支持
目錄
第1章:引言
- 研究假設和市場定義
- 調查範圍
第2章:調查方法
第3章執行摘要
第4章 市場狀況
- 市場概覽
- 市場促進因素
- 加速向雲端原生架構轉型
- 對提高開發人員生產力的需求日益成長
- Kubernetes 變得越來越複雜,需要進行抽象。
- 大型企業平台團隊的擴張
- 軟體供應鏈合規性要求日益提高
- AI驅動的DevOps工具鏈的出現
- 市場限制因素
- 建立內部平台需要大量的初始投資。
- 平台工程師短缺
- 與舊有系統整合面臨的挑戰
- 自助服務入口網站的安全問題
- 宏觀經濟因素對市場的影響
- 產業價值鏈分析
- 監理情勢
- 技術展望
- 波特五力分析
第5章 市場規模與成長預測
- 平台組件
- 基礎設施自動化層
- 面向開發人員的自助服務門戶
- CI/CD編配
- 可觀測性和遙測
- 管治和安全措施
- 部署模式
- 現場
- 雲
- 混合
- 按組織規模
- 大公司
- 中小企業
- 按最終用戶行業分類
- 科技與軟體
- 金融服務
- 電訊
- 醫療保健和生命科學
- 零售與電子商務
- 製造業
- 能源公用事業
- 政府/公共部門
- 其他終端用戶產業
- 按地區
- 北美洲
- 美國
- 加拿大
- 墨西哥
- 南美洲
- 巴西
- 阿根廷
- 其他南美國家
- 歐洲
- 英國
- 德國
- 法國
- 義大利
- 西班牙
- 其他歐洲國家
- 亞太地區
- 中國
- 日本
- 印度
- 韓國
- 其他亞太國家
- 中東和非洲
- 中東
- 阿拉伯聯合大公國
- 沙烏地阿拉伯
- 其他中東國家
- 非洲
- 南非
- 埃及
- 其他非洲國家
- 中東
- 北美洲
第6章 競爭情勢
- 市場集中度
- 策略趨勢
- 市佔率分析
- 公司簡介
- Humanitec GmbH
- OpsLevel Inc.
- Port.io Ltd.
- Armory Inc.
- Harness Inc.
- Platform.sh SAS
- CloudBees Inc.
- D2iQ Inc.
- Upbound Inc.
- Pulumi Corporation
- Weaveworks Ltd.
- GitLab Inc.
- Atlassian Corporation Plc
- Red Hat Inc.
- HashiCorp Inc.
- Circle Internet Services Inc.
- Okteto Inc.
- ReleaseHub Inc.
- Mirantis Inc.
- Syntasso Ltd.
第7章 市場機會與未來展望
According to Mordor Intelligence, the platform engineering and internal developer platform (IDP) market size is expected to increase from USD 10.44 billion in 2026 to reach USD 31.57 billion by 2031, growing at a CAGR of 24.77% over 2026-2031.
This report is Segmented by Platform Component (Infrastructure Automation Layer, and More), Deployment Mode (On-Premise, Cloud, and Hybrid), Organization Size (Large Enterprises, and Small and Medium Enterprises), End-User Industry (Technology and Software, Financial Services, and More), and Geography. The Market Forecasts are Provided in Terms of Value (USD).
Global Platform Engineering And Internal Developer Platform (IDP) Market Trends and Insights
Accelerating Shift to Cloud-Native Architectures
Cloud-native workloads grew to 82% of production estates in 2025, but the operational burden ballooned as Kubernetes introduced more than 50 core resource types, each carrying dozens of configuration parameters. Internal developer platforms now provision namespaces, ingress, and policy bundles by default, eliminating YAML sprawl and shortening release cycles. Early deployments, such as Nokia's 5G core, saved hundreds of engineering hours per release by removing manual cluster drift. Financial institutions layer Basel III and audit logging policies directly into templates, ensuring regulatory alignment without slowing product delivery. As managed Kubernetes services add edge and multi-networking features, abstraction layers will remain pivotal for keeping the developer experience simple.
Rising Demand for Developer Productivity Gains
Prior to platform adoption, developers devoted roughly 35% of their week to infrastructure tasks, stalling feature velocity. Organizations running mature platforms report near-40% boosts in deployment frequency and around 25% faster mean-time-to-recovery, metrics that translate into sharper competitive positioning. Shopify's migration to a composable admin interface processed 67 million daily page views across 101 teams, an achievement made possible by platform-driven automation. Regulatory frameworks such as GDPR embed privacy-by-design principles into golden paths so developers never manually handle sensitive data. Affordable SaaS subscriptions, priced near USD 1,000 per month, extend these productivity gains to resource-constrained mid-market firms.
High Upfront Investment in Building Internal Platforms
A production-grade platform often needs three to five full-time engineers for up to 18 months, equating to labor costs between USD 150,000 and USD 650,000 before tooling or cloud fees. This capital hurdle sidelines many small and medium-sized enterprises, which accounted for only 38.62% of 2025 spending despite representing the majority of global businesses. Continuous feature evolution, routine security patching, and user-experience refinement compound lifetime costs, prompting some firms to adopt subscription offerings. Software Defined Automation's path to ISO 27001 certification in February 2026, following a USD 10 million seed round, highlights how compliance overhead inflates the total price tag.
Other drivers and restraints analyzed in the detailed report include:
- Increasing Kubernetes Complexity Necessitating Abstraction
- Expansion of Platform Teams in Large Enterprises
- Talent Shortage of Platform Engineers
For complete list of drivers and restraints, kindly check the Table Of Contents.
Segment Analysis
Developer self-service portals captured 34.87% of 2025 revenue, reflecting early enterprise emphasis on workflow automation. This slice of the platform engineering and internal developer platform market size is expected to retain leadership as portals remain the primary touchpoint for developers creating new services. Observability and telemetry pieces, however, are set to grow 25.77% annually, driven by OpenTelemetry adoption that mandates trace-first design across all golden paths. Integrated suites now fold metrics, traces, and logs into the initial scaffolding, so every microservice emits data without extra developer steps, ensuring that performance regressions are caught before they impact users.
A parallel trend favors CI/CD orchestration woven into platform blueprints, with 67% of 2025 respondents citing GitOps as their delivery pattern of choice. Infrastructure automation components, exemplified by Pulumi's OpenAPI release, abstract diverse cloud REST endpoints behind uniform APIs, easing multi-provider workflows. Governance and security layers embed the Open Policy Agent to enforce guardrails at admission controller time. Collectively, these pieces suggest the platform engineering and internal developer platform (IDP) market will shift from discrete modules toward opinionated bundles that minimize configuration debt.
Cloud deployment held 46.32% of the platform engineering and internal developer platform market share in 2025, thanks to mature managed Kubernetes services that lower operational lift. Yet hybrid topologies are projected to compound at 35.37% each year, more than 10 percentage points above the headline CAGR. Driving the swing are regulatory mandates, such as Europe's Digital Operational Resilience Act, that push banks to maintain on-premises disaster-recovery zones even as they leverage public-cloud elasticity for dev environments. Platform abstraction stitches together these disparate estates, presenting developers with a single API regardless of where workloads eventually land.
Vodafone's validated OpenShift patterns exemplify how GitOps keeps edge clusters in sync with centralized control planes. On-prem deployments remain mandatory for air-gapped defense workloads, yet the arrival of sovereign cloud options from Oracle and others is eroding the case for purely local installations. As multi-cloud adoption climbs, platform blueprints must mask provider-specific primitives, a design shift that fuels hybrid growth and cements vendor-agnostic orchestration as table stakes.
Geography Analysis
North America held 41.68% of 2025 revenue due to deep Kubernetes penetration and early formation of platform teams. Enterprises in the United States weave PCI-DSS 4.0 and SOC 2 Type 2 controls directly into golden paths, enabling developers to ship code without wrangling compliance minutiae. The region's salary premium, 27% above DevOps baselines, creates talent gravity but also strains hiring pipelines, prompting firms to automate repetitive platform maintenance tasks. Canada and Mexico follow similar trajectories, modernizing pipelines to manage cross-border data flows governed by GDPR-inspired statutes.
Asia-Pacific is expanding at a 24.89% CAGR, fueled by sovereign-cloud mandates in India and China that make abstraction layers indispensable for multi-region workloads behind unified developer interfaces. The latest Cloud Native Computing Foundation pulse shows that 87% of regional enterprises are either implementing or planning platform programs, an indicator that the platform engineering and internal developer platform markets will post sustained double-digit growth. Japan and South Korea dominate mature adoption, while India's technology-services giants embed internal platforms to standardize global client delivery. Talent shortages remain acute, so AI-guided platforms fill operational gaps.
Europe maintains a mid-tier share but is accelerating where the Digital Operational Resilience Act, the Network and Information Security Directive 2, and GDPR converge on software supply-chain assurance. The United Kingdom, Germany, and France channel spending into banking and telecom use cases that rely on platform-level policy codification. South America's penetration is nascent; Brazil and Argentina are modernizing core banking, yet smaller IT ecosystems are curbing uptake. In the Middle East and Africa, the United Arab Emirates and Saudi Arabia anchor sovereign-cloud investments that require platform abstraction, whereas sub-Saharan Africa faces infrastructure gaps.
- Humanitec GmbH
- OpsLevel Inc.
- Port.io Ltd.
- Armory Inc.
- Harness Inc.
- Platform.sh SAS
- CloudBees Inc.
- D2iQ Inc.
- Upbound Inc.
- Pulumi Corporation
- Weaveworks Ltd.
- GitLab Inc.
- Atlassian Corporation Plc
- Red Hat Inc.
- HashiCorp Inc.
- Circle Internet Services Inc.
- Okteto Inc.
- ReleaseHub Inc.
- Mirantis Inc.
- Syntasso Ltd.
Additional Benefits:
- The market estimate (ME) sheet in Excel format
- 3 months of analyst support
TABLE OF CONTENTS
1 INTRODUCTION
- 1.1 Study Assumptions and Market Definition
- 1.2 Scope of the Study
2 RESEARCH METHODOLOGY
3 EXECUTIVE SUMMARY
4 MARKET LANDSCAPE
- 4.1 Market Overview
- 4.2 Market Drivers
- 4.2.1 Accelerating Shift to Cloud-Native Architectures
- 4.2.2 Rising Demand for Developer Productivity Gains
- 4.2.3 Increasing Kubernetes Complexity Necessitating Abstraction
- 4.2.4 Expansion of Platform Teams in Large Enterprises
- 4.2.5 Growing Compliance Requirements for Software Supply Chains
- 4.2.6 Emergence of AI-Augmented DevOps Toolchains
- 4.3 Market Restraints
- 4.3.1 High Upfront Investment in Building Internal Platforms
- 4.3.2 Talent Shortage of Platform Engineers
- 4.3.3 Integration Challenges with Legacy Systems
- 4.3.4 Security Concerns Around Self-Service Portals
- 4.4 Impact of Macroeconomic Factors on the Market
- 4.5 Industry Value Chain Analysis
- 4.6 Regulatory Landscape
- 4.7 Technological Outlook
- 4.8 Porter's Five Forces Analysis
- 4.8.1 Bargaining Power of Suppliers
- 4.8.2 Bargaining Power of Buyers
- 4.8.3 Threat of New Entrants
- 4.8.4 Threat of Substitutes
- 4.8.5 Intensity of Competitive Rivalry
5 MARKET SIZE AND GROWTH FORECASTS (VALUE)
- 5.1 By Platform Component
- 5.1.1 Infrastructure Automation Layer
- 5.1.2 Developer Self-Service Portal
- 5.1.3 CI/CD Orchestration
- 5.1.4 Observability and Telemetry
- 5.1.5 Governance and Security Controls
- 5.2 By Deployment Mode
- 5.2.1 On-Premise
- 5.2.2 Cloud
- 5.2.3 Hybrid
- 5.3 By Organization Size
- 5.3.1 Large Enterprises
- 5.3.2 Small and Medium-Sized Enterprises (SMEs)
- 5.4 By End-user Industry
- 5.4.1 Technology and Software
- 5.4.2 Financial Services
- 5.4.3 Telecommunications
- 5.4.4 Healthcare and Life Sciences
- 5.4.5 Retail and E-Commerce
- 5.4.6 Manufacturing
- 5.4.7 Energy and Utilities
- 5.4.8 Government and Public Sector
- 5.4.9 Other End-User Industries
- 5.5 By Geography
- 5.5.1 North America
- 5.5.1.1 United States
- 5.5.1.2 Canada
- 5.5.1.3 Mexico
- 5.5.2 South America
- 5.5.2.1 Brazil
- 5.5.2.2 Argentina
- 5.5.2.3 Rest of South America
- 5.5.3 Europe
- 5.5.3.1 United Kingdom
- 5.5.3.2 Germany
- 5.5.3.3 France
- 5.5.3.4 Italy
- 5.5.3.5 Spain
- 5.5.3.6 Rest of Europe
- 5.5.4 Asia-Pacific
- 5.5.4.1 China
- 5.5.4.2 Japan
- 5.5.4.3 India
- 5.5.4.4 South Korea
- 5.5.4.5 Rest of Asia-Pacific
- 5.5.5 Middle East and Africa
- 5.5.5.1 Middle East
- 5.5.5.1.1 United Arab Emirates
- 5.5.5.1.2 Saudi Arabia
- 5.5.5.1.3 Rest of Middle East
- 5.5.5.2 Africa
- 5.5.5.2.1 South Africa
- 5.5.5.2.2 Egypt
- 5.5.5.2.3 Rest of Africa
- 5.5.5.1 Middle East
- 5.5.1 North America
6 COMPETITIVE LANDSCAPE
- 6.1 Market Concentration
- 6.2 Strategic Moves
- 6.3 Market Share Analysis
- 6.4 Company Profiles (includes Global Level Overview, Market Level Overview, Core Segments, Financials as available, Strategic Information, Market Rank/Share, Products and Services, Recent Developments)
- 6.4.1 Humanitec GmbH
- 6.4.2 OpsLevel Inc.
- 6.4.3 Port.io Ltd.
- 6.4.4 Armory Inc.
- 6.4.5 Harness Inc.
- 6.4.6 Platform.sh SAS
- 6.4.7 CloudBees Inc.
- 6.4.8 D2iQ Inc.
- 6.4.9 Upbound Inc.
- 6.4.10 Pulumi Corporation
- 6.4.11 Weaveworks Ltd.
- 6.4.12 GitLab Inc.
- 6.4.13 Atlassian Corporation Plc
- 6.4.14 Red Hat Inc.
- 6.4.15 HashiCorp Inc.
- 6.4.16 Circle Internet Services Inc.
- 6.4.17 Okteto Inc.
- 6.4.18 ReleaseHub Inc.
- 6.4.19 Mirantis Inc.
- 6.4.20 Syntasso Ltd.
7 MARKET OPPORTUNITIES AND FUTURE OUTLOOK
- 7.1 White-Space and Unmet-Need Assessment

 價格最佳化與管理軟體市場規模、佔有率及成長分析:按應用程式、部署類型、組織規模、定價功能、最終用戶和地區分類-2026-2033年產業預測
 全球GPU即服務市場(至2040年):按組件、部署模式、經營模式、企業規模、應用、最終用戶、地區和主要參與者分類
 人力資本管理與薪資核算整合平台:市場佔有率分析、產業趨勢與統計及成長預測(2026-2031 年)
 2026年全球清潔管理軟體市場報告2026年全球價格優化與管理軟體市場報告2026年全球雲端田野歷史資料庫市場報告
 2026-2030年全球平台工程工具市場
 平台工程市場預測至2032年:按組件、平台使用者、技術、最終用戶和地區分類的全球分析全球GPU即服務(GPUaaS)市場:未來預測(至2032年)-依服務模式、部署方式、GPU類型、組織規模、應用程式、最終用戶和地區進行分析2025年全球雲端財務營運市場報告