


 |
市場調查報告書
商品編碼
2063387
DDoS防護與緩解安全:市佔率分析、產業趨勢與統計及成長預測(2026-2031年)DDOS Protection And Mitigation Security - Market Share Analysis, Industry Trends & Statistics, Growth Forecasts (2026 - 2031) |
||||||

※ 本網頁內容可能與最新版本有所差異。詳細情況請與我們聯繫。
根據 Mordor Intelligence 預測,DDoS 防護和緩解安全市場規模預計將在 2025 年達到 72.1 億美元,在 2026 年達到 84.8 億美元,並在 2031 年達到 181.7 億美元。
預計從 2026 年到 2031 年,其複合年成長率將達到 16.46%。
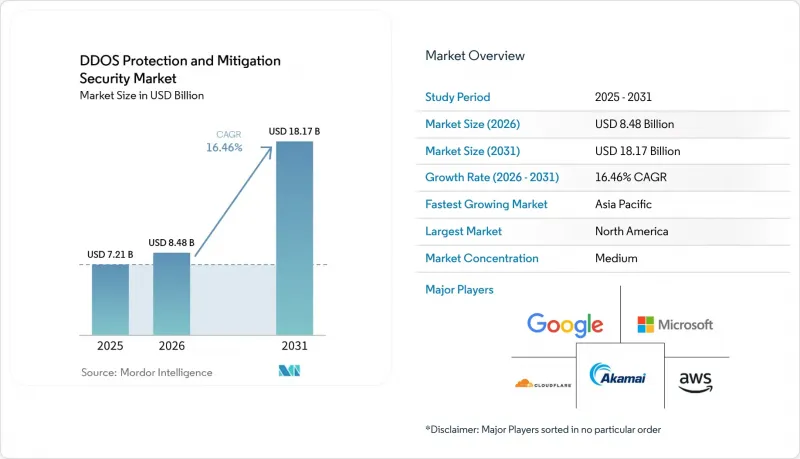
本報告按元件(硬體、軟體、服務)、部署類型(本地部署、雲端部署)、組織規模(中小企業、大型企業)、最終用戶產業(IT與電信、銀行、金融服務和保險、其他)以及地區進行細分。市場預測以美元計價。
全球DDoS防護與緩解安全市場趨勢及洞察
複雜多向量攻擊激增
2024年8月,Google以前所未有的速度緩解了每秒3.98億次HTTP/2快速重置請求。這表明,現代攻擊宣傳活動正在融合基於流量、基於協定和基於應用的攻擊向量。攻擊者擴大利用協定特性來繞過速率限制,迫使企業採用行為分析來分析合法流量,而不再僅依賴靜態簽章。每次事件的平均修復成本高達250萬美元,與2024年企業安全預算年增45%形成鮮明對比。由於攻擊同時跨越網路層、應用層和DNS層,買家優先考慮的是整個攻擊向量的整合可見性。因此,DDoS防禦和緩解安全市場更傾向於提供關聯遙測資料的平台,而不是獨立的設備。
物聯網和邊緣設備的普及
思科預測,到2030年,全球將有293億台連網設備,每台設備都可能成為殭屍網路節點。工業IoT的部署正在擴大攻擊面,但許多營運技術(OT)網路仍缺乏線上緩解措施。邊緣工作負載使傳統的流量清洗變得複雜,因為將流量路由到遠端中心無法滿足工業控制所必需的低於10毫秒的延遲要求。因此,製造企業正在部署本地或混合硬體,將檢測功能部署在靠近機器的位置,同時確保雲端容量能夠應對流量激增。類似的趨勢也出現在5G網路切片中,其中精細化的邊緣措施對於應對針對特定服務層的定向攻擊至關重要。
先進緩解方案高成本
企業級平台需要簽訂價值 5 萬至 50 萬美元的年度契約,對於許多中小企業來說太昂貴。加上培訓和調優成本,總擁有成本翻倍,迫使預算緊張的企業只能依賴防火牆等局部解決方案。雖然供應商提供付費使用制方案,但簡化服務和強大的 AI 高級方案之間仍然存在功能差距。由此產生的兩極化導致 DDoS 防護和緩解安全市場並非按威脅暴露程度分類,而是按消費能力分類。
細分市場分析
2024年,服務在DDoS防護和緩解安全市場中佔46.33%的佔有率,凸顯了技能匱乏迫使企業外包的現實。託管服務供應商提供全天候監控和事件回應服務,而78%的企業發現難以在內部維持這種服務。然而,軟體在DDoS防護和緩解安全市場中的佔比成長最快,其中人工智慧平台預計到2031年將以18.16%的複合年成長率成長。自適應演算法能夠即時學習攻擊模式並自動調整緩解閾值,這是僅靠硬體設備無法實現的。儘管如此,在需要微秒響應的領域,例如高頻交易(確定性延遲至關重要),硬體仍然必不可少。因此,一種混合的「服務+軟體」方案正在興起,該方案以客戶管理的回應引擎為核心,提供專業的運維管理。這種組合使客戶能夠在保持管理控制的同時,將全天候維運工作委託給專家團隊。
硬體供應商正透過將加速器和遙測資料饋送整合到可直接與雲端清洗池對接的設備中,來應對利潤率下滑的問題。 Cloudflare 的 Magic Transit 在尖峰時段期每秒可處理 3,200 萬個 HTTP 請求,這充分展現了雲端佇列如何與本地封包過濾相輔相成。隨著監管審計要求端到端可追溯性,能夠記錄跨服務、軟體和硬體元素流量的整合解決方案正成為採購的優先事項。因此,在一個日益趨向統一管理的生態系統中,服務仍然是收入基礎,軟體是成長的驅動力,而硬體則成為延遲解決方案。
到2024年,雲端採用佔總營收的63.21%,反映出買家對具有韌性的經濟模式的偏好。考慮到購置成本、折舊免稅額和人事費用,超大規模雲端中基於容量的緩解措施比同等本地容量的成本低60%至70%。 AWS Shield Advanced 可自動擴展以應對Terabit特級流量激增,無需容量規劃,凸顯了其實用模式的有效性。 DDoS防護和緩解安全市場涵蓋一些細分領域,在這些領域,資料主權和亞毫秒延遲需要本地檢測,尤其是在支付處理和工業自動化領域。
因此,混合模式正逐漸成為主流。三分之二的大型企業正在將雲端頻寬與本地智慧整合,確保應用層過濾盡可能靠近來源伺服器執行。邊緣運算提高了分散式策略一致性的需求,因為流量現在會流經雲端、核心網路和邊緣網路。因此,競相爭取新部署的供應商必須提供一個集中編配的平台,實現「一次感知,處處應用」。隨著 5G 部署的推進,邊緣節點的數量不斷增加,架構配置正朝著更重視雲端突發和本地應用的方向發展。
區域分析
到2025年,北美將佔全球整體收入的39.61%,這得益於每年超過180億美元的穩定聯邦支出。矽谷領先的雲端供應商和新創公司正在加速產品迭代周期,使本地用戶能夠儘早測試和採用新興功能。加拿大也展現出類似的成熟度,這得益於其與美國零信任框架一致的關鍵基礎設施指導方針。
亞太地區正經歷最快的成長,DDoS防護和緩解安全市場預計到2031年將以17.93%的複合年成長率成長。中國的網路安全法強制要求本地數據存儲,這促進了將國內篩檢中心與國際骨幹網路容量相結合的混合部署。印度的「數位印度」舉措促使聯邦政府在2024年增加了34%的網路安全支出,反映出其政策正從邊界防禦轉向主動韌性。日本優先考慮製造業的運作和智慧工廠的連續性,這為低延遲硬體周邊設備創造了巨大的商機。
歐盟NIS2指令設定了2024年10月的最後期限,以確保關鍵基礎設施的整體韌性。因此,預計採購週期將集中在2024-2025年,因為營運商需要位於歐盟境內的經認證的篩檢節點。北歐國家在雲端運算應用方面處於領先地位,而德國則傾向於採用混合架構以滿足嚴格的資料保護法律。在中東和非洲,大型企劃和國有石油公司的數位轉型推動了雲端運算的成長,但熟練人員的短缺阻礙了其應用。在南美洲,由於銀行監管更加嚴格,雲端運算的應用正在逐步擴大,但貨幣波動可能會延遲資本投資。
其他好處
- Excel格式的市場預測(ME)表
- 3個月的分析師支持
目錄
第1章:引言
- 研究假設和市場定義
- 調查範圍
第2章:調查方法
第3章執行摘要
第4章 市場狀況
- 市場概覽
- 市場促進因素
- 複雜多向量攻擊激增
- 物聯網和邊緣設備的普及
- 雲端服務的快速普及
- 零信任架構實作要求
- DDoS攻擊代理服務的廣泛應用。
- 將人工智慧應用於即時緩解
- 市場限制因素
- 先進緩解措施成本高昂
- 中小企業意識水準低
- 對自動化防禦中誤報的擔憂
- 不斷發展的加密標準阻礙了流量偵測。
- 產業價值鏈分析
- 監理情勢
- 技術展望
- 宏觀經濟因素的影響
- 波特五力分析
第5章 市場規模與成長預測
- 按組件
- 硬體
- 軟體
- 服務
- 按實現類型
- 現場
- 雲
- 按組織規模
- 小型企業
- 大公司
- 按最終用戶行業分類
- 資訊科技/通訊
- BFSI
- 政府
- 電子商務與零售
- 衛生保健
- 按地區
- 北美洲
- 美國
- 加拿大
- 墨西哥
- 歐洲
- 德國
- 英國
- 法國
- 俄羅斯
- 其他歐洲國家
- 亞太地區
- 中國
- 日本
- 印度
- 韓國
- 澳洲
- 其他亞太國家
- 中東和非洲
- 中東
- 沙烏地阿拉伯
- 阿拉伯聯合大公國
- 其他中東國家
- 非洲
- 南非
- 埃及
- 其他非洲地區
- 中東
- 南美洲
- 巴西
- 阿根廷
- 南美洲其他地區
- 北美洲
第6章 競爭情勢
- 市場集中度
- 策略趨勢
- 市佔率分析
- 公司簡介
- Cloudflare Inc.
- Akamai Technologies Inc.
- Amazon Web Services Inc.
- Microsoft Corporation
- Google LLC
- Imperva Inc.
- Radware Ltd.
- Netscout Systems Inc.
- Verisign Inc.
- Neustar Security Services Inc.
- Arbor Networks Inc.
- F5 Inc.
- Corero Network Security plc
- Link11 GmbH
- StackPath LLC
- Nexusguard Ltd.
- CenturyLink Communications LLC(Lumen Technologies)
- Fastly Inc.
- Limelight Networks Inc.(Edgio Inc.)
- NSFOCUS Technologies Group Co. Ltd.
第7章 市場機會與未來展望
According to Mordor Intelligence, the dDoS protection and mitigation security market size is projected to be USD 7.21 billion in 2025, USD 8.48 billion in 2026, and reach USD 18.17 billion by 2031, growing at a CAGR of 16.46% from 2026 to 2031.
This report is Segmented by Component (Hardware, and Software, Services), Deployment Mode (On-Premises, and Cloud), Organization Size (Small and Medium Enterprises, and Large Enterprises), End-User Industry (IT and Telecom, BFSI, and More), and Geography. The Market Forecasts are Provided in Terms of Value (USD).
Global DDOS Protection And Mitigation Security Market Trends and Insights
Surge in Sophisticated Multi-Vector Attacks
Google mitigated an unprecedented 398 million HTTP/2 rapid-reset requests per second in August 2024, demonstrating how modern campaigns blend volumetric, protocol, and application vectors. Attackers are increasingly exploiting protocol quirks that bypass rate-limiting, compelling organizations to adopt behavioral analytics that profile legitimate traffic instead of relying solely on static signatures. Recorded average remediation costs of USD 2.5 million per incident underscore why enterprise security budgets increased by 45% year-over-year in 2024. As attacks traverse network, application, and DNS layers simultaneously, buyers prioritize unified visibility across vectors. Accordingly, the DDoS protection and mitigation security market favors platforms supplying correlated telemetry rather than standalone appliances.
Proliferation of IoT and Edge Devices
Cisco projects 29.3 billion connected devices by 2030, each of which could be a potential node in a botnet. Industrial IoT rollouts magnify attack surfaces, yet many operational technology networks still lack inline mitigation. Edge workloads complicate legacy scrubbing, because detouring traffic to distant centers breaches the sub-10 millisecond latency envelope critical for industrial control. Manufacturing companies, therefore, procure on-premises or hybrid hardware, keeping inspection proximate to machines while reserving cloud capacity for volumetric overflow. The same dynamic arises in 5G network slices, where targeted assaults on specific service tiers necessitate fine-grained policy enforcement at the edge.
High Cost of Advanced Mitigation Solutions
Enterprise-grade platforms, which require annual commitments of USD 50,000 to USD 500,000, price out many SMEs. The total cost of ownership doubles once training and tuning are added, nudging budget-constrained firms toward partial coverage that relies on firewalls alone. While vendors respond with pay-as-you-go tiers, functional gaps persist between simplified offerings and AI-rich premium bundles. The resulting bifurcation segments the DDoS protection and mitigation security market around spending power rather than threat exposure.
Other drivers and restraints analyzed in the detailed report include:
- Rapid Adoption of Cloud-Based Services
- Mandates for Zero-Trust Architecture
- Limited Awareness Among SMEs
For complete list of drivers and restraints, kindly check the Table Of Contents.
Segment Analysis
Services captured 46.33% of the DDoS protection and mitigation security market share in 2024, emphasizing how skill shortages compel outsourcing. Managed service providers supply 24/7 monitoring and incident response that 78% of organizations find difficult to sustain in-house. The DDoS protection and mitigation security market size allocation toward software, however, is rising fastest, with AI-enabled platforms forecast to grow at an 18.16% CAGR through 2031. Adaptive algorithms learn attack patterns in real time, automatically retuning mitigation thresholds, a feature that hardware appliances alone cannot emulate. Yet hardware remains vital for microsecond-sensitive sectors such as high-frequency trading, where deterministic latency is paramount. Hybrid service-plus-software bundles therefore emerge, offering managed expertise around customer-controlled policy engines. This combination allows clients to maintain oversight while delegating 24/7 operations to specialized personnel.
Hardware vendors address margin pressure by embedding accelerators and telemetry feeds into appliances that integrate directly with cloud scrubbing pools. Cloudflare's Magic Transit processed 32 million HTTP requests per second during peak events, evidencing how cloud queuing complements on-premises packet filtering. As regulatory audits demand end-to-end traceability, integrated solutions that log traffic across services, software, and hardware elements gain procurement preference. Consequently, services remain the revenue anchor, software the growth engine, and hardware the latency hedge in an ecosystem increasingly orchestrated from unified dashboards.
Cloud deployments accounted for 63.21% of 2024 revenue, reflecting buyers' preference for elastic economics. Volumetric mitigation in hyperscale clouds costs 60-70% less than comparable on-premises capacity when factoring in purchase, depreciation, and staffing. AWS Shield Advanced auto-scales to absorb terabit-class floods with no capacity planning, validating the utility model. Nevertheless, the DDoS protection and mitigation security market size encompasses niches where data sovereignty and sub-millisecond latency necessitate local inspection, particularly in payment clearing or industrial automation.
Hybrid patterns consequently prevail. Two-thirds of large enterprises blend cloud bandwidth with on-premises intelligence, ensuring that application-layer filtering remains closest to the origin servers. Edge computing amplifies the need for distributed policy coherence because traffic now traverses cloud, core, and edge. Vendors competing for new deployments must therefore supply centrally orchestrated platforms that detect once and enforce everywhere. As 5G rollouts increase the number of edge nodes, the architecture mix further favors cloud bursting backed by local enforcement.
Geography Analysis
North America retained 39.61% of global revenue in 2025, anchored by consistent federal spending that tops USD 18 billion annually. Large cloud vendors and start-ups clustered in Silicon Valley accelerate product cycles, allowing local buyers to pilot emerging features early. Canada reflects a similar level of maturity, bolstered by critical infrastructure guidelines that align with U.S. zero-trust frameworks.
The Asia-Pacific region registers the swiftest expansion, with the DDoS protection and mitigation security market size in the region projected to grow at a 17.93% CAGR through 2031. China's Cybersecurity Law requires localized data residency, prompting hybrid deployments that blend domestic scrubbing centers with international backbone capacity. India's Digital India initiative raised federal cyber outlays 34% in 2024, reflecting a policy pivot from perimeter defense toward proactive resilience. Japan prioritizes manufacturing uptime and smart-factory continuity, creating sizable opportunities for low-latency hardware adjuncts.
Europe's NIS2 directive imposes October 2024 deadlines for resilience across critical infrastructure. Procurement cycles are consequently expected to concentrate in 2024-2025 as operators seek certified, EU-domiciled scrubbing nodes. Nordic countries lead in cloud adoption, while Germany favors hybrid architectures to satisfy strict data-protection statutes. The Middle East and Africa show nascent growth driven by smart-city megaprojects and national oil company digitization, but face skills shortages that slow penetration. South America gradually scales adoption as banking regulation tightens, yet currency volatility can defer capital spending.
- Cloudflare Inc.
- Akamai Technologies Inc.
- Amazon Web Services Inc.
- Microsoft Corporation
- Google LLC
- Imperva Inc.
- Radware Ltd.
- Netscout Systems Inc.
- Verisign Inc.
- Neustar Security Services Inc.
- Arbor Networks Inc.
- F5 Inc.
- Corero Network Security plc
- Link11 GmbH
- StackPath LLC
- Nexusguard Ltd.
- CenturyLink Communications LLC (Lumen Technologies)
- Fastly Inc.
- Limelight Networks Inc. (Edgio Inc.)
- NSFOCUS Technologies Group Co. Ltd.
Additional Benefits:
- The market estimate (ME) sheet in Excel format
- 3 months of analyst support
TABLE OF CONTENTS
1 INTRODUCTION
- 1.1 Study Assumptions and Market Definition
- 1.2 Scope of the Study
2 RESEARCH METHODOLOGY
3 EXECUTIVE SUMMARY
4 MARKET LANDSCAPE
- 4.1 Market Overview
- 4.2 Market Drivers
- 4.2.1 Surge in Sophisticated Multi-Vector Attacks
- 4.2.2 Proliferation of IoT and Edge Devices
- 4.2.3 Rapid Adoption of Cloud-Based Services
- 4.2.4 Mandates for Zero-Trust Architecture
- 4.2.5 Growing Availability of DDoS-for-Hire Services
- 4.2.6 Integration of AI for Real-Time Mitigation
- 4.3 Market Restraints
- 4.3.1 High Cost of Advanced Mitigation Solutions
- 4.3.2 Limited Awareness Among SMEs
- 4.3.3 False Positive Concerns in Automated Defenses
- 4.3.4 Evolving Encryption Standards Hindering Traffic Inspection
- 4.4 Industry Value Chain Analysis
- 4.5 Regulatory Landscape
- 4.6 Technological Outlook
- 4.7 Impact of Macroeconomic Factors
- 4.8 Porter's Five Forces Analysis
- 4.8.1 Threat of New Entrants
- 4.8.2 Bargaining Power of Buyers
- 4.8.3 Bargaining Power of Suppliers
- 4.8.4 Threat of Substitutes
- 4.8.5 Competitive Rivalry
5 MARKET SIZE AND GROWTH FORECASTS (VALUE)
- 5.1 By Component
- 5.1.1 Hardware
- 5.1.2 Software
- 5.1.3 Services
- 5.2 By Deployment Mode
- 5.2.1 On-Premises
- 5.2.2 Cloud
- 5.3 By Organization Size
- 5.3.1 Small and Medium Enterprises
- 5.3.2 Large Enterprises
- 5.4 By End-User Industry
- 5.4.1 IT and Telecom
- 5.4.2 BFSI
- 5.4.3 Government
- 5.4.4 E-Commerce and Retail
- 5.4.5 Healthcare
- 5.5 By Geography
- 5.5.1 North America
- 5.5.1.1 United States
- 5.5.1.2 Canada
- 5.5.1.3 Mexico
- 5.5.2 Europe
- 5.5.2.1 Germany
- 5.5.2.2 United Kingdom
- 5.5.2.3 France
- 5.5.2.4 Russia
- 5.5.2.5 Rest of Europe
- 5.5.3 Asia-Pacific
- 5.5.3.1 China
- 5.5.3.2 Japan
- 5.5.3.3 India
- 5.5.3.4 South Korea
- 5.5.3.5 Australia
- 5.5.3.6 Rest of Asia-Pacific
- 5.5.4 Middle East and Africa
- 5.5.4.1 Middle East
- 5.5.4.1.1 Saudi Arabia
- 5.5.4.1.2 United Arab Emirates
- 5.5.4.1.3 Rest of Middle East
- 5.5.4.2 Africa
- 5.5.4.2.1 South Africa
- 5.5.4.2.2 Egypt
- 5.5.4.2.3 Rest of Africa
- 5.5.4.1 Middle East
- 5.5.5 South America
- 5.5.5.1 Brazil
- 5.5.5.2 Argentina
- 5.5.5.3 Rest of South America
- 5.5.1 North America
6 COMPETITIVE LANDSCAPE
- 6.1 Market Concentration
- 6.2 Strategic Moves
- 6.3 Market Share Analysis
- 6.4 Company Profiles (includes Global Level Overview, Market Level Overview, Core Segments, Financials as Available, Strategic Information, Market Rank/Share for Key Companies, Products and Services, and Recent Developments)
- 6.4.1 Cloudflare Inc.
- 6.4.2 Akamai Technologies Inc.
- 6.4.3 Amazon Web Services Inc.
- 6.4.4 Microsoft Corporation
- 6.4.5 Google LLC
- 6.4.6 Imperva Inc.
- 6.4.7 Radware Ltd.
- 6.4.8 Netscout Systems Inc.
- 6.4.9 Verisign Inc.
- 6.4.10 Neustar Security Services Inc.
- 6.4.11 Arbor Networks Inc.
- 6.4.12 F5 Inc.
- 6.4.13 Corero Network Security plc
- 6.4.14 Link11 GmbH
- 6.4.15 StackPath LLC
- 6.4.16 Nexusguard Ltd.
- 6.4.17 CenturyLink Communications LLC (Lumen Technologies)
- 6.4.18 Fastly Inc.
- 6.4.19 Limelight Networks Inc. (Edgio Inc.)
- 6.4.20 NSFOCUS Technologies Group Co. Ltd.
7 MARKET OPPORTUNITIES AND FUTURE OUTLOOK
- 7.1 White-Space and Unmet-Need Assessment

 DDoS防護與緩解安全市場:全球市場預測,2026-2032年DDoS防護與緩解市場:2026-2032年全球市場預測(按服務類型、攻擊媒介、部署類型、組織規模和最終用戶分類)
 DDoS防護與緩解市場規模、佔有率及成長分析:依服務產品、部署類型、應用領域、組織規模、產業及地區分類-2026-2033年產業預測
 分散式阻斷服務 (DDoS) 防護市場:按元件、部署模式、應用程式、最終使用者和區域分類
 2026年全球DDoS防護與緩解安全市場報告2026年全球DDoS防護與緩解市場報告
 DDoS防護與緩解安全市場分析及預測(至2035年):依類型、產品、服務、技術、組件、應用、部署類型、最終用戶及解決方案分類
 DDoS攻擊緩解:市場佔有率分析、產業趨勢與統計、成長預測(2026-2031年)
 DDoS防護與緩解安全市場-全球產業規模、佔有率、趨勢、機會及預測:按組件、部署模式、產業、地區及競爭對手分類,2021-2031年
 DDoS防護與緩解安全市場規模、佔有率及成長分析(按部署類型、服務類型、解決方案類型、最終用戶產業和地區分類)-2026-2033年產業預測