


 |
市場調查報告書
商品編碼
1939643
DDoS攻擊緩解:市場佔有率分析、產業趨勢與統計、成長預測(2026-2031年)Distributed Denial Of Service (DDoS) Protection - Market Share Analysis, Industry Trends & Statistics, Growth Forecasts (2026 - 2031) |
||||||
※ 本網頁內容可能與最新版本有所差異。詳細情況請與我們聯繫。
據估計,DDoS 防護市場規模將從 2025 年的 47.3 億美元成長到 2026 年的 53.8 億美元。
預計到 2031 年將達到 102.8 億美元,2026 年至 2031 年的複合年成長率為 13.82%。
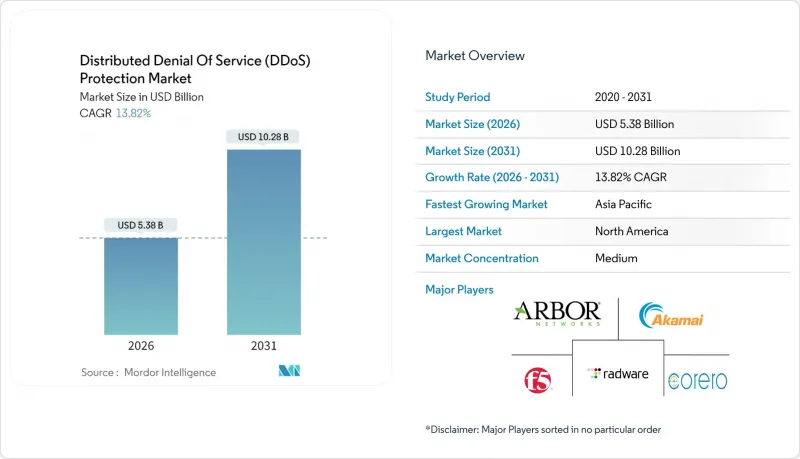
此次擴張的促進因素包括多向量Terabit特級安全事件的日益頻繁、監管要求的不斷加強以及混合和雲端緩解模式的普及。以解決方案為中心的產品將在2024年保持61.23%的市場佔有率,這印證了企業對整合式可程式防禦系統的需求。雲端優先部署佔據了近一半的潛在市場,但隨著企業在延遲、控制和合規性之間尋求平衡,混合架構正在迅速崛起。區域趨勢依然重要,北美地區將繼續保持領先地位,預計2024年將佔據39.34%的收入佔有率,而亞太地區則憑藉5G的快速部署和物聯網的蓬勃發展,以14.89%的複合年成長率成長。
全球DDoS攻擊緩解市場趨勢及洞察
多向量攻擊的頻率日益增加
有史以來規模最大的攻擊事件發生在2025年,流量高達6.3Tbps,這凸顯了攻擊方式從簡單的流量型攻擊向複雜的通訊協定和應用層攻擊的轉變,這種轉變使傳統的基於規則的設備不堪重負,並加速了自適應人工智慧驅動平台的普及。通訊服務供應商和金融機構仍然是高價值的攻擊目標,世界各地的監管機構都要求關鍵基礎設施營運商證明其具備強大的韌性。
快速轉向雲端和混合響應模式
短期突發性攻擊的興起,使得彈性持久的雲端安全防護至關重要。然而,對延遲敏感的工作負載仍需要本地部署的安全防禦,從而推動了混合雲環境的需求。超大規模雲端與專業安全公司合作,幫助中小企業滿足新的合規要求,同時彌補技能差距。
中小企業自有設備整體擁有成本高昂
資本密集硬體和持續的簽章更新仍然是中小企業面臨的障礙,因此需要訂閱式雲端清洗和託管 SOC 服務相結合的方式。
細分市場分析
到2025年,解決方案領域將佔總收入的60.65%,因為越來越多的組織尋求整合式、可程式設計的防禦方案,以應對從L3/4層流量攻擊到L7層應用程式泛光利用等各種威脅。雖然網路層防護仍將佔據該領域最大佔有率,但由於能夠模仿合法用戶行為的AI驅動型機器人的興起,高級機器人防護領域預計將以15.05%的複合年成長率成長。供應商正在整合機器學習分類器、設備指紋識別和即時挑戰機制,以抵禦人員編制和憑證囤積攻擊。隨著供應商整合,託管服務和專業服務在合規報告和全天候監控方面的重要性日益凸顯。解決方案和服務之間的相互作用凸顯了DDoS防護市場轉向基於結果的合約模式的趨勢。
混合配置的日益普及要求本地設備、雲端流量淨化中心和容器化網路功能之間進行協作。隨著產品功能的融合,差異化優勢正轉向以 API 為中心的整合、攻擊取證深度和零信任支援。能夠將行為分析與可操作情報結合的供應商,將更有利於利用監管機構日益成長的壓力,在關鍵領域展現出可驗證的韌性。
2025年,基於雲端的防禦方案將佔據DDoS防護市場規模的49.02%,利用彈性頻寬池和全球任播路由技術,能夠抵禦每秒數太比特的攻擊。全天候運作模式可確保秒級回應,這在當今頻繁出現的亞分鐘級「脈衝式」攻擊中至關重要。同時,混合架構到2031年將以15.25%的複合年成長率成長,企業將低延遲的本地檢測與雲端規模的流量清洗相結合,以應對流量高峰。這種靈活的方法既能最大限度地降低資本支出和營運複雜性,又能滿足各司法管轄區的數據限制。
本地部署設備在金融交易平台、國防機構和需要微秒響應的媒體廣播公司中仍佔有一席之地。然而,即使是這些垂直行業也擴大採用分層雲端容量來應對高流量溢出。在站點、篩檢節點和 SIEM 平台之間持續進行 API 驅動的遙測資料交換正成為 DDoS 防護市場的一項基本要求。
DDoS攻擊緩解市場報告按組件(解決方案、服務)、部署類型(雲端、本地部署、混合部署)、組織規模(中小企業、大型企業)、最終用戶產業(政府與國防、銀行、金融服務與保險、其他)以及地區進行細分。市場預測以美元計價。
區域分析
北美39.05%的市佔率凸顯了其成熟但又動盪的市場環境。金融、SaaS和能源產業是高價值目標。網路安全和基礎設施安全局 (CISA) 的指南日益要求即時遙測資料共用和零信任實踐,從而推動供應商和客戶在事件回應方面進行更深入的合作。投資重點在於加密流量偵測和機器學習驅動的異常評分。
亞太地區以14.65%的複合年成長率展現出最強勁的成長動能。數位經濟每年新增數千萬寬頻和行動用戶,擴大了殭屍網路的招募潛力。該地區的通訊業者正與安全廠商合作,在其5G核心網路中部署邊緣清洗節點,以降低跳數延遲並改善用戶體驗。日本和澳洲的監管機構現已要求關鍵基礎設施營運商提交季度彈性報告,這進一步提振了對DDoS防護市場的整體需求。
在歐洲,如何在嚴格的隱私法規和日益複雜的網路攻擊之間取得平衡是一項挑戰。 NIS2 指示規定,對於防禦措施不足的企業,將處以最高相當於全球營業額 2% 的罰款,這加速了企業向經認證的多租戶防禦服務的轉型。中歐和東歐的公共產業面臨著出於政治動機的泛光攻擊,這促使它們採用基於人工智慧的流量分類和主權資料託管保障相結合的技術。拉丁美洲、中東和非洲正在成為殭屍網路和定向攻擊的新來源地,因此,DDoS 防護市場需要製定能夠考慮區域特徵的、情境感知型的防禦策略。
其他福利:
- Excel格式的市場預測(ME)表
- 分析師支持(3個月)
目錄
第1章 引言
- 研究假設和市場定義
- 調查範圍
第2章調查方法
第3章執行摘要
第4章 市場情勢
- 市場概覽
- 市場促進因素
- 多向量太比Terabit攻擊頻率不斷增加
- 快速過渡到雲端和混合緩解模式
- 物聯網、5G 和邊緣連接設備的興起
- 人工智慧驅動的「DDoS即服務」市場降低了進入門檻
- 關鍵基礎設施法規強制要求具備韌性(例如,NIS2、CISA)
- 在網路邊緣部署基於SDN的可程式清洗機制
- 市場限制
- 中小企業自備設備高成本
- 網路安全專業人員短缺
- 由於加密攻擊流量比例不斷增加,可見性受到限制。
- 誤報導致自身系統停機的風險
- 監管環境
- 技術展望
- 波特五力分析
- 新進入者的威脅
- 買方的議價能力
- 供應商的議價能力
- 替代品的威脅
- 競爭對手之間的競爭
- 用例和案例研究
第5章 市場規模與成長預測
- 按組件
- 解決方案
- 網路層保護
- 應用層保護
- DNS保護
- 高階機器人防護
- 服務
- 專業服務
- 託管服務
- 解決方案
- 透過部署模式
- 雲
- 本地部署
- 混合
- 按組織規模
- 小型企業
- 主要企業
- 按最終用戶行業分類
- 政府和國防部
- 銀行、金融服務和保險
- 資訊科技與通訊
- 醫療保健和生命科學
- 零售與電子商務
- 媒體與娛樂
- 能源與公共產業
- 製造業
- 其他終端用戶產業
- 按地區
- 北美洲
- 美國
- 加拿大
- 墨西哥
- 南美洲
- 巴西
- 阿根廷
- 南美洲其他地區
- 歐洲
- 英國
- 德國
- 法國
- 義大利
- 西班牙
- 俄羅斯
- 其他歐洲地區
- 亞太地區
- 中國
- 日本
- 印度
- 韓國
- 澳洲和紐西蘭
- 亞太其他地區
- 中東和非洲
- 中東
- 沙烏地阿拉伯
- 阿拉伯聯合大公國
- 土耳其
- 其他中東地區
- 非洲
- 南非
- 奈及利亞
- 其他非洲地區
- 中東
- 北美洲
第6章 競爭情勢
- 市場集中度
- 策略趨勢
- 市佔率分析
- 公司簡介
- NETSCOUT Systems, Inc.
- Akamai Technologies, Inc.
- F5, Inc.
- Imperva, Inc.
- Radware Ltd.
- Corero Network Security plc
- Neustar, Inc.
- Cloudflare, Inc.
- Nexusguard Limited
- DOSarrest Internet Security Limited
- VeriSign, Inc.
- Amazon Web Services, Inc.
- Microsoft Corporation
- Google LLC
- Check Point Software Technologies Ltd.
- Fortinet, Inc.
- A10 Networks, Inc.
- Fastly, Inc.
- Alibaba Cloud Computing Co., Ltd.
- StackPath, LLC
- GCore Labs SA
- Link11 GmbH
- Lumen Technologies, Inc.
- Sucuri, Inc.
第7章 市場機會與未來展望
DDoS protection market size in 2026 is estimated at USD 5.38 billion, growing from 2025 value of USD 4.73 billion with 2031 projections showing USD 10.28 billion, growing at 13.82% CAGR over 2026-2031.
This expansion is fueled by the mounting frequency of multi-vector, terabit-scale incidents, strengthened regulatory mandates, and the widespread embrace of hybrid and cloud-based mitigation models. Solution-centric offerings maintained dominance with 61.23% share in 2024, underscoring enterprise demand for integrated, programmable defenses. Cloud-first deployments accounted for nearly half the addressable opportunity, yet hybrid architectures are gaining ground as organizations balance latency, control, and compliance. Regional dynamics remain pivotal: North America led with 39.34% revenue share in 2024, while Asia Pacific is advancing at a 14.89% CAGR, driven by rapid 5G rollouts and surging IoT adoption.
Global Distributed Denial Of Service (DDoS) Protection Market Trends and Insights
Escalating frequency of multi-vector attacks
A record 6.3 Tbps event in 2025 highlighted the jump from volumetric floods to blended protocol and application-layer campaigns, overwhelming legacy rule-based appliances and escalating procurement of adaptive, AI-driven platforms. Communication service providers and financial institutions remain high-value targets, and global regulators now require demonstrated resilience for critical infrastructure operators.
Rapid migration to cloud and hybrid mitigation models
Elastic, always-on cloud scrubbing has become indispensable as short-burst attacks spike; however, latency-sensitive workloads keep on-premises defenses relevant, accelerating hybrid demand. Partnerships between hyperscale clouds and security specialists are bridging skills gaps for SMEs while meeting emerging compliance obligations.
High TCO of on-prem appliances for SMEs
Capex-heavy hardware plus ongoing signature updates remain prohibitive for smaller enterprises, steering demand toward subscription-based cloud scrubbing paired with managed SOC services.
Other drivers and restraints analyzed in the detailed report include:
- Expansion of IoT-, 5G-, and edge-connected devices
- AI-powered "DDoS-as-a-Service" marketplaces lowering entry barriers
- Shortage of skilled cybersecurity professionals
For complete list of drivers and restraints, kindly check the Table Of Contents.
Segment Analysis
Solutions commanded 60.65% revenue in 2025 as enterprises sought unified, programmable defenses capable of spanning L3/4 volumetric floods and L7 application abuses. Within this umbrella, network-layer protection retained the largest slice, yet advanced bot mitigation is forecast to rise at a 15.05% CAGR, driven by AI-enabled bots that mimic legitimate user behavior. Vendors are embedding machine-learning classifiers, device fingerprinting, and real-time challenge mechanisms to blunt credential-stuffing and inventory hoarding. Services-managed and professional-continue to gain relevance as organizations consolidate suppliers for compliance reporting and 24X7 monitoring. The interplay of solutions and services underscores a shift toward outcome-based contracting across the DDoS protection market.
Growing adoption of hybrid topologies demands orchestration between on-premises hardware, cloud scrubbing centers, and containerized network functions. As offerings converge, differentiation pivots on API-centric integration, attack-forensics depth, and zero-trust alignment. Solution vendors that blend behavioral analytics with actionable intelligence are positioned to capitalize on rising regulatory pressure for demonstrable resiliency across critical sectors.
Cloud-based defenses captured 49.02% of the DDoS protection market size in 2025, offering elastic bandwidth pools and global anycast routing to absorb multi-Tbps assaults. Always-on models ensure response within seconds, a necessity amid sub-minute "pulse" attacks. Meanwhile, hybrid architectures are projected to expand at a 15.25% CAGR through 2031 as enterprises merge low-latency, on-premises detection with cloud-scale scrubbing during surge periods. This flexible posture satisfies jurisdictional data constraints while minimizing capex and operational complexity.
On-premises appliances retain niche traction among financial trading platforms, defense agencies, and media broadcasters that demand micro-second mitigation. However, even these verticals are layering cloud capacity for volumetric overflow. Continuous API-driven telemetry exchange between sites, scrubbing nodes, and SIEM platforms is becoming table stakes across the DDoS protection market.
The Distributed Denial of Service (DDoS) Protection Market Report is Segmented by Component (Solutions, and Services), Deployment Mode (Cloud, On-Premises, and Hybrid), Organization Size (Small and Medium Enterprises, and Large Enterprises), End-User Industry (Government and Defense, Banking, Financial Services and Insurance, and More), and Geography. The Market Forecasts are Provided in Terms of Value (USD),
Geography Analysis
North America's 39.05% share underscores a mature yet volatile landscape. High-value targets include finance, SaaS, and energy. CISA directives increasingly require real-time telemetry sharing and zero-trust alignment, prompting deeper vendor-customer collaboration on incident response. Investments prioritize encrypted-traffic inspection and machine-learning-driven anomaly scoring.
Asia Pacific exhibits the strongest growth trajectory at 14.65% CAGR. Digital economies are onboarding tens of millions of new broadband and mobile subscribers annually, amplifying botnet recruitment potential. Regional telcos partner with security vendors to deploy edge scrubbing nodes across 5G core networks, reducing hop latency and improving customer experience. Regulatory agencies in Japan and Australia now mandate quarterly resilience reporting for critical infrastructure operators, reinforcing demand across the DDoS protection market.
Europe balances stringent privacy mandates with elevated attack sophistication. NIS2 imposes fines up to 2% of global turnover for inadequate defenses, accelerating migration toward certified, multi-tenant mitigation services. Central and Eastern European utilities face politically motivated flood attacks, driving adoption of AI-guided traffic classification coupled with sovereign data-hosting guarantees. Latin America, the Middle East, and Africa represent emerging vectors both for botnet origination and targeted campaigns, necessitating localized, context-aware defense strategies within the DDoS protection market.
- NETSCOUT Systems, Inc.
- Akamai Technologies, Inc.
- F5, Inc.
- Imperva, Inc.
- Radware Ltd.
- Corero Network Security plc
- Neustar, Inc.
- Cloudflare, Inc.
- Nexusguard Limited
- DOSarrest Internet Security Limited
- VeriSign, Inc.
- Amazon Web Services, Inc.
- Microsoft Corporation
- Google LLC
- Check Point Software Technologies Ltd.
- Fortinet, Inc.
- A10 Networks, Inc.
- Fastly, Inc.
- Alibaba Cloud Computing Co., Ltd.
- StackPath, LLC
- GCore Labs S.A.
- Link11 GmbH
- Lumen Technologies, Inc.
- Sucuri, Inc.
Additional Benefits:
- The market estimate (ME) sheet in Excel format
- 3 months of analyst support
TABLE OF CONTENTS
1 INTRODUCTION
- 1.1 Study Assumptions and Market Definition
- 1.2 Scope of the Study
2 RESEARCH METHODOLOGY
3 EXECUTIVE SUMMARY
4 MARKET LANDSCAPE
- 4.1 Market Overview
- 4.2 Market Drivers
- 4.2.1 Escalating frequency of multi-vector, terabit-scale attacks
- 4.2.2 Rapid migration to cloud and hybrid mitigation models
- 4.2.3 Expansion of IoT-, 5G- and edge-connected devices
- 4.2.4 AI-powered "DDoS-as-a-Service" marketplaces lowering entry barriers
- 4.2.5 Critical-infrastructure regulations mandating resiliency (e.g., NIS2, CISA)
- 4.2.6 Adoption of programmable SDN-based scrubbing at the network edge
- 4.3 Market Restraints
- 4.3.1 High TCO of on-prem appliances for SMEs
- 4.3.2 Shortage of skilled cyber-security professionals
- 4.3.3 Rising share of encrypted attack traffic limiting visibility
- 4.3.4 Risk of false-positive mitigation causing self-inflicted downtime
- 4.4 Regulatory Landscape
- 4.5 Technological Outlook
- 4.6 Porter's Five Forces Analysis
- 4.6.1 Threat of New Entrants
- 4.6.2 Bargaining Power of Buyers
- 4.6.3 Bargaining Power of Suppliers
- 4.6.4 Threat of Substitutes
- 4.6.5 Intensity of Competitive Rivalry
- 4.7 Use Case and Case Studies
5 MARKET SIZE AND GROWTH FORECASTS (VALUE)
- 5.1 By Component
- 5.1.1 Solution
- 5.1.1.1 Network-layer protection
- 5.1.1.2 Application-layer protection
- 5.1.1.3 DNS protection
- 5.1.1.4 Advanced bot mitigation
- 5.1.2 Service
- 5.1.2.1 Professional services
- 5.1.2.2 Managed services
- 5.1.1 Solution
- 5.2 By Deployment Mode
- 5.2.1 Cloud
- 5.2.2 On-Premises
- 5.2.3 Hybrid
- 5.3 By Organization Size
- 5.3.1 Small and Medium Enterprises
- 5.3.2 Large Enterprises
- 5.4 By End-User Industry
- 5.4.1 Government and Defense
- 5.4.2 Banking, Financial Services and Insurance
- 5.4.3 Information Technology and Telecommunications
- 5.4.4 Healthcare and Life Sciences
- 5.4.5 Retail and E-commerce
- 5.4.6 Media and Entertainment
- 5.4.7 Energy and Utilities
- 5.4.8 Manufacturing
- 5.4.9 Other End-User Industries
- 5.5 By Geography
- 5.5.1 North America
- 5.5.1.1 United States
- 5.5.1.2 Canada
- 5.5.1.3 Mexico
- 5.5.2 South America
- 5.5.2.1 Brazil
- 5.5.2.2 Argentina
- 5.5.2.3 Rest of South America
- 5.5.3 Europe
- 5.5.3.1 United Kingdom
- 5.5.3.2 Germany
- 5.5.3.3 France
- 5.5.3.4 Italy
- 5.5.3.5 Spain
- 5.5.3.6 Russia
- 5.5.3.7 Rest of Europe
- 5.5.4 Asia Pacific
- 5.5.4.1 China
- 5.5.4.2 Japan
- 5.5.4.3 India
- 5.5.4.4 South Korea
- 5.5.4.5 Australia and New Zealand
- 5.5.4.6 Rest of Asia Pacific
- 5.5.5 Middle East and Africa
- 5.5.5.1 Middle East
- 5.5.5.1.1 Saudi Arabia
- 5.5.5.1.2 United Arab Emirates
- 5.5.5.1.3 Turkey
- 5.5.5.1.4 Rest of Middle East
- 5.5.5.2 Africa
- 5.5.5.2.1 South Africa
- 5.5.5.2.2 Nigeria
- 5.5.5.2.3 Rest of Africa
- 5.5.5.1 Middle East
- 5.5.1 North America
6 COMPETITIVE LANDSCAPE
- 6.1 Market Concentration
- 6.2 Strategic Moves
- 6.3 Market Share Analysis
- 6.4 Company Profiles (includes Global-level Overview, Market-level Overview, Core Segments, Financials, Strategic Information, Market Rank/Share, Products and Services, Recent Developments)
- 6.4.1 NETSCOUT Systems, Inc.
- 6.4.2 Akamai Technologies, Inc.
- 6.4.3 F5, Inc.
- 6.4.4 Imperva, Inc.
- 6.4.5 Radware Ltd.
- 6.4.6 Corero Network Security plc
- 6.4.7 Neustar, Inc.
- 6.4.8 Cloudflare, Inc.
- 6.4.9 Nexusguard Limited
- 6.4.10 DOSarrest Internet Security Limited
- 6.4.11 VeriSign, Inc.
- 6.4.12 Amazon Web Services, Inc.
- 6.4.13 Microsoft Corporation
- 6.4.14 Google LLC
- 6.4.15 Check Point Software Technologies Ltd.
- 6.4.16 Fortinet, Inc.
- 6.4.17 A10 Networks, Inc.
- 6.4.18 Fastly, Inc.
- 6.4.19 Alibaba Cloud Computing Co., Ltd.
- 6.4.20 StackPath, LLC
- 6.4.21 GCore Labs S.A.
- 6.4.22 Link11 GmbH
- 6.4.23 Lumen Technologies, Inc.
- 6.4.24 Sucuri, Inc.
7 MARKET OPPORTUNITIES AND FUTURE OUTLOOK
- 7.1 White-space and Unmet-need Assessment
 DDoS防護與緩解市場:2026-2032年全球市場預測(按服務類型、攻擊媒介、部署類型、組織規模和最終用戶分類)
 DDoS防護與緩解安全:市佔率分析、產業趨勢與統計及成長預測(2026-2031年)
 DDoS防護與緩解市場規模、佔有率及成長分析:依服務產品、部署類型、應用領域、組織規模、產業及地區分類-2026-2033年產業預測
 分散式阻斷服務 (DDoS) 防護市場:按元件、部署模式、應用程式、最終使用者和區域分類DDoS防護與緩解安全市場:依組件、部署模式、類型、組織規模與產業分類-2026-2032年全球市場預測
 2026年全球DDoS防護與緩解安全市場報告2026年全球DDoS防護與緩解市場報告
 DDoS防護與緩解安全市場分析及預測(至2035年):依類型、產品、服務、技術、組件、應用、部署類型、最終用戶及解決方案分類
 DDoS防護與緩解安全市場-全球產業規模、佔有率、趨勢、機會及預測:按組件、部署模式、產業、地區及競爭對手分類,2021-2031年
 DDoS防護與緩解安全市場規模、佔有率及成長分析(按部署類型、服務類型、解決方案類型、最終用戶產業和地區分類)-2026-2033年產業預測