


 |
市場調查報告書
商品編碼
2063366
威脅建模工具:市場佔有率分析、產業趨勢與統計資料、成長預測(2026-2031 年)Threat Modeling Tools - Market Share Analysis, Industry Trends & Statistics, Growth Forecasts (2026 - 2031) |
||||||
※ 本網頁內容可能與最新版本有所差異。詳細情況請與我們聯繫。
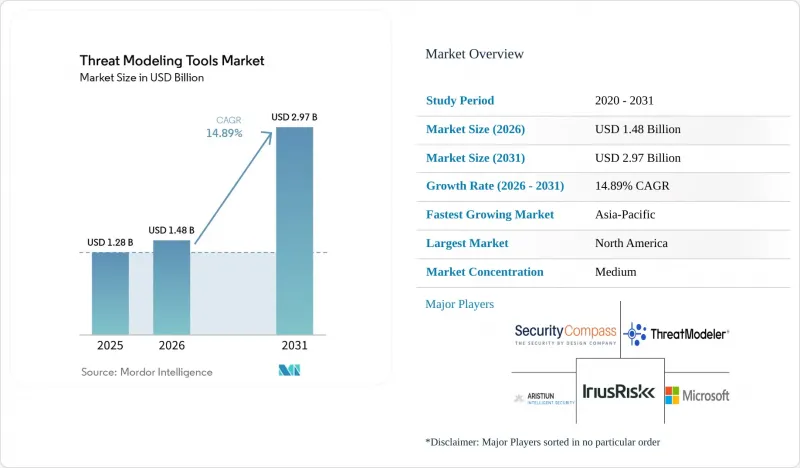
據 Mordor Intelligence 稱,威脅建模工具市場在 2025 年的價值為 12.8 億美元,預計到 2031 年將從 2026 年的 14.8 億美元成長到 29.7 億美元,在預測期(2026-2031 年)內的複合年成長率為 14.89%。
本報告按部署類型(雲端、本地部署、混合部署)、工具類型(企業商業平台、開放原始碼/社群版、其他)、組織規模(大型企業、中小企業)、最終用戶產業(銀行、金融服務和保險 (BFSI)、IT 和電信、製造業、其他)以及地區進行細分。市場預測以美元 (USD) 計價。
全球威脅建模工具市場趨勢與洞察
加強對安全軟體開發的監管要求
世界各國政府正在將自願性最佳實踐轉化為具有約束力的採購標準。歐盟的《網路韌性法案》要求數位產品製造商記錄產品整個生命週期內的威脅模型,該法案計劃於2027年9月全面實施。在美國,第14144號行政命令強制要求聯邦軟體供應商根據美國國家標準與技術研究院(NIST)的安全軟體開發框架(SSDF)進行自我認證,將威脅建模提升為基本要求。巴西的《網路安全法框架》草案預計將設立一個國家機構,該機構有權將不符合標準的供應商排除在公共合約之外。沙烏地阿拉伯的《非關鍵國家基礎設施網路安全控制措施》將威脅評估義務擴展到員工人數僅六人的公司。這些法規共同擴大了以合規主導的威脅建模工具市場潛在基本客群。
針對軟體供應鏈的網路攻擊激增。
備受矚目的安全事件表明,僅靠邊界控制無法遏制依賴轉移帶來的風險。 2026年3月,攻擊者在axios npm套件中植入後門,從超過18,000個下游程式碼庫中竊取憑證。 TeamPCP宣傳活動利用植入木馬的Python工件入侵了多個產業的建構系統。 2024年2月,Change Healthcare因第三方憑證外洩而遭受攻擊,導致超過1億名病患的處方箋處理中斷。這些事件迫使企業採用相關平台來繪製依賴關係、產生攻擊樹並持續檢驗緩解措施,推動了威脅建模工具市場的成長。
缺乏熟練的威脅建模專家
全球網路安全人才缺口超過350萬,能夠將系統設計轉化為攻擊樹的從業人員更是鳳毛麟角。沿岸地區87%的雇主表示難以招募合格人員,促使沙烏地阿拉伯啟動了一項計劃,旨在到2030年培養2萬名專家。人才短缺正在減緩威脅建模工具的普及,因為平台自動化無法完全取代專家判斷,從而限制了威脅建模工具的市場滲透率,尤其是在複雜的營運技術(OT)環境中。
細分市場分析
隨著受監管企業將本地資料管理與雲端的可擴展性相結合,預計到2031年,混合環境的採用率將以15.44%的複合年成長率成長。儘管到2025年,雲端產品在威脅建模工具市場中佔據了53.52%的佔有率,但沙烏地阿拉伯和阿拉伯聯合大公國的國家主權法規正在將工作負載轉向仍然依賴遠端分析的主權雲端配置。因此,威脅建模工具市場正在轉向那些能夠在不重複資料的情況下跨環境同步模型的供應商。
多重雲端的普及進一步加劇了混合雲的需求。資產分佈在 AWS、Azure 和 Google Cloud 等雲端平台上,但仍需使用單一的風險評估標準進行評估。思科以 Splunk 為中心的產品組合支援跨 Amazon S3 和本地日誌儲存的聯合分析,這表明,當企業拒絕集中儲存敏感遙測資料時,供應商如何確保收入。因此,混合雲功能正成為大型競標中的實際要求,從而保持了威脅建模工具市場的強勁勢頭。
儘管具備行動引擎、視覺化儀錶板和審計追蹤等功能的企業級商業套件預計在2025年仍將保持43.41%的市場佔有率,但它們正面臨著來自「威脅即程式碼」(Threat-as-Code)產品的快速市場佔有率侵蝕,這些產品可直接整合到Git工作流程中。 「威脅即程式碼」威脅建模工具市場的擴張,源自於安全團隊對YAML和JSON定義的偏好,這些定義能夠隨著拉取請求的更新而演進,從而使管治與基礎設施即程式碼(Infrastructure-as-Code)的發布節奏保持一致。
像 Threagile 和 OWASP Threat Dragon 這樣的開放原始碼舉措降低了採用門檻,尤其對中小企業而言更是如此;而付費產品則透過機率攻擊圖和量化風險評分來脫穎而出。像 securiCAD 這樣的模擬工具可以模擬 IT 和 OT(營運技術)融合的整個網路中的級聯故障,從而解決通用圖表產品無法應對的挑戰。這種多樣性使得威脅建模工具市場能夠在保持適度細分的同時,依然保持高度的創新水準。
區域分析
預計到2025年,北美將成為領先市場,佔全球銷售額的39.11%。聯邦政府強制性自我聲明將威脅建模列為先決條件,這為上述預測提供了佐證。許多主要供應商的總部設在美國,並已形成緊密的區域合作夥伴和顧問生態系統,加速了平台部署。加拿大《關鍵網路系統保護法》將類似的義務擴展至電信和能源公司,進一步擴大了區域需求。
在歐洲,自《網路安全韌性法案》頒布以來,威脅建模的應用已十分普遍。德國、法國和義大利的汽車、工業和消費性電子產品製造商現在都將威脅建模視為在歐洲市場推出產品的強制性要求。隨著2027年合規性評估截止日期的臨近,多年期平台協議的簽署正在加速,這將為威脅建模工具市場帶來可觀的收入。
亞太地區是成長最快的地區,複合年成長率達16.13%。中國已修訂《網路安全法》,強制要求為關鍵基礎設施提供服務的供應商進行安全開發審查。印度的《數位個人資料保護法》強制要求資料受託人進行風險評估,而日本修訂後的《網路安全戰略》則強調供應鏈保障。總而言之,這些指南為熟悉當地合規要求的供應商提供了巨大的潛在市場。
中東和非洲正成為混合雲端的典範。沙烏地阿拉伯向DSShield投資2.03億美元(5,410萬美元),並批准了新的託管安全營運中心(MSOC)許可,這表明該國致力於發展本地專業技術;而阿拉伯聯合大公國已在其當前預算中撥款超過20億美元用於網路安全。南美洲也緊跟在後。巴西的第538/2025號決議和正在審議的《網路安全法案》正在將威脅建模製度化,應用於金融和公共部門系統,從而推動威脅建模工具市場進入新的領域。
其他好處
- Excel格式的市場預測(ME)表
- 3個月的分析師支持
目錄
第1章:引言
- 研究假設和市場定義
- 調查範圍
第2章:調查方法
第3章執行摘要
第4章 市場狀況
- 市場概覽
- 市場促進因素
- 加強對安全軟體開發的監管要求
- 針對軟體供應鏈的網路攻擊激增。
- 在 DevSecOps 管線中引入左移安全
- 增強與人工智慧驅動的程式碼生成平台的整合
- 基礎設施即程式碼 (IAC) 中對威脅建模的需求日益成長
- 在安全關鍵型物聯網系統中採用威脅建模標準
- 市場限制因素
- 缺乏熟練的威脅建模專家
- 較高的初始實施和整合成本
- 缺乏對新興邊緣運算架構的支持
- 零散的開放原始碼替代方案阻礙了商業應用。
- 產業價值鏈分析
- 監理情勢
- 技術展望
- 波特五力分析
- 宏觀經濟因素對市場的影響
第5章 市場規模與成長預測
- 按實現類型
- 基於雲端的
- 本地部署
- 混合型
- 新產品
- 企業商業平台
- 開放原始碼/社群版
- 威脅即程式碼/CLI 工具
- 以圖表為中心的工具
- 模擬和攻擊圖工具
- 按組織規模
- 大公司
- 中小企業
- 按行業分類的最終用戶
- BFSI
- 資訊科技/通訊
- 醫療保健和生命科學
- 政府/國防
- 零售與電子商務
- 能源與公共產業
- 製造業
- 其他終端用戶產業
- 按地區
- 北美洲
- 美國
- 加拿大
- 墨西哥
- 歐洲
- 德國
- 英國
- 法國
- 義大利
- 其他歐洲國家
- 亞太地區
- 中國
- 日本
- 印度
- 韓國
- 澳洲
- 其他亞太國家
- 中東和非洲
- 中東
- 沙烏地阿拉伯
- 阿拉伯聯合大公國
- 其他中東國家
- 非洲
- 南非
- 埃及
- 其他非洲地區
- 中東
- 南美洲
- 巴西
- 阿根廷
- 南美洲其他地區
- 北美洲
第6章 競爭情勢
- 市場集中度
- 策略趨勢
- 市佔率分析
- 公司簡介
- ThreatModeler Software Inc.
- IriusRisk Limited
- Security Compass Inc.
- Foreseeti AB
- Aristiun Inc.
- CAIRIS Services Ltd.
- OWASP Foundation
- Microsoft Corporation
- Threagile UG
- ThreatSpec Ltd.
- Lucid Software Inc.
- Miro International GmbH
- Splunk Inc.
- Cisco Systems, Inc.
- SecureFlag Ltd.
- Tutamen GmbH
- Amazon Web Services, Inc.
- Kenna Security LLC
- International Business Machines Corporation
- Devici LLC
第7章 市場機會與未來展望
According to Mordor Intelligence, the threat modeling tools market size was valued at USD 1.28 billion in 2025 and is estimated to grow from USD 1.48 billion in 2026 to reach USD 2.97 billion by 2031, at a CAGR of 14.89% during the forecast period (2026-2031).
This report is Segmented by Deployment Mode (Cloud-Based, On-Premise, and Hybrid), Tool Type (Enterprise Commercial Platforms, Open-Source/Community Editions, and More), Organization Size (Large Enterprises, and Small and Medium-Sized Enterprises (SMEs)), End-User Vertical (BFSI, IT and Telecom, Manufacturing, and More), and Geography. The Market Forecasts are Provided in Terms of Value (USD).
Global Threat Modeling Tools Market Trends and Insights
Growing Regulatory Mandates For Secure Software Development
Governments are converting voluntary best practices into binding procurement criteria. The European Union's Cyber Resilience Act compels digital-product makers to document threat models across the product lifecycle, with full enforcement slated for September 2027. In the United States, Executive Order 14144 obliges federal software suppliers to self-attest against the NIST Secure Software Development Framework, elevating threat modeling to a baseline requirement. Brazil's draft Cybersecurity Legal Framework would create a national authority empowered to bar non-conforming vendors from public contracts. Saudi Arabia's Non-Critical National Infrastructure Cybersecurity Controls extend mandatory threat assessments to firms with as few as six employees. These statutes collectively expand the compliance-driven addressable base for the threat modeling tools market.
Surge In Cyberattacks Targeting Software Supply Chains
High-profile incidents prove that perimeter controls cannot contain transitive dependency risks. In March 2026, attackers back-doored the axios npm package, harvesting credentials from more than 18,000 downstream repositories. The TeamPCP campaign exploited trojanized Python artifacts to compromise build systems across multiple industries. The February 2024 Change Healthcare breach, triggered by compromised third-party credentials, disrupted prescription processing for over 100 million patients. These events are driving companies to adopt platforms that map dependencies, generate attack trees, and validate mitigations continuously, thereby fueling growth of the threat modeling tools market.
Lack Of Skilled Threat Modeling Professionals
The worldwide cybersecurity talent gap exceeds 3.5 million roles, and practitioners who can translate system designs into attack trees are rarer still. Gulf-region employers report that 87% struggle to hire qualified staff, prompting Saudi Arabia to launch programs that aim to train 20,000 specialists by 2030. Because platform automation cannot fully replace expert judgment, staffing shortages dampen adoption velocity, especially for complex operational-technology environments, limiting penetration of the threat modeling tools market.
Other drivers and restraints analyzed in the detailed report include:
- Shift-Left Security Adoption In DevSecOps Pipelines
- Increasing Integration With AI-Driven Code Generation Platformsdels
- High Initial Setup And Integration Costs
For complete list of drivers and restraints, kindly check the Table Of Contents.
Segment Analysis
Hybrid installations are projected to grow at a 15.44% CAGR to 2031 as regulated entities combine on-premise data custodianship with cloud scalability. Although cloud delivery held 53.52% of the threat modeling tools market share in 2025, national sovereignty rules in Saudi Arabia and the United Arab Emirates are steering workloads toward sovereign-cloud configurations that still rely on remote analytics. The threat modeling tools market size is consequently shifting toward vendors that synchronize models across environments without duplicating data.
Hybrid demand is reinforced by multi-cloud adoption, where assets reside in AWS, Azure, and Google Cloud yet must be evaluated through a single risk lens. Cisco's Splunk-anchored portfolio enables federated analytics across Amazon S3 and local log stores, illustrating how vendors capture spend when enterprises refuse to centralize sensitive telemetry. As such, hybrid capabilities are becoming a de-facto checklist item in large tenders, sustaining momentum for the threat modeling tools market.
Enterprise commercial suites retained 43.41% revenue share in 2025, due to policy engines, visual dashboards, and audit trails, yet they face rapid erosion from threat-as-code products that slot directly into Git workflows. The threat modeling tools market size for threat-as-code is expanding because security teams prefer YAML or JSON definitions that evolve with pull requests, aligning governance with the pace of infrastructure-as-code releases.
Open-source initiatives such as Threagile and OWASP Threat Dragon reduce experimental friction, especially for SMEs, whereas paid offerings differentiate through probabilistic attack graphs and quantitative risk scoring. Simulation tools like securiCAD model cascading failures across converged information-technology and operational-technology networks, addressing gaps that generic diagramming products cannot. This variety keeps the threat modeling tools market moderately fragmented yet highly innovative.
Geography Analysis
North America topped revenue at 39.11% in 2025, underpinned by mandatory federal self-attestation forms that list threat modeling as a prerequisite. Most leading vendors are headquartered in the United States, creating a dense local ecosystem of partners and consultants that accelerates platform rollouts. Canada's Critical Cyber Systems Protection Act extends similar obligations to telecommunications and energy operators, enlarging regional demand.
Europe follows with widespread uptake after the Cyber Resilience Act entered into force. Automotive, industrial, and consumer-electronics manufacturers in Germany, France, and Italy now consider threat modeling non-negotiable when placing products on the European market. Conformity-assessment deadlines for 2027 are prompting multi-year platform deals, contributing substantial revenue to the threat modeling tools market.
Asia-Pacific is the fastest-growing territory at a 16.13% CAGR. China amended its Cybersecurity Law to impose secure-development reviews on vendors serving critical infrastructure, India's Digital Personal Data Protection Act requires risk assessments for data fiduciaries, and Japan's revamped Cybersecurity Strategy stresses supply-chain assurance. Collectively, these directives open large addressable pools for providers fluent in local compliance dialects.
The Middle East and Africa region is emerging as a hybrid-cloud showcase. Saudi Arabia's SAR 203 million (USD 54.10 million) investment in DSShield and new licensing for managed security operations centers demonstrate national commitment to local expertise, while the United Arab Emirates earmarked over USD 2 billion for cybersecurity in its current budget. South America is following suit: Brazil's Resolution 538/2025 and pending cybersecurity bill institutionalize threat modeling for financial and public-sector systems, nudging the threat modeling tools market into fresh territory.
- ThreatModeler Software Inc.
- IriusRisk Limited
- Security Compass Inc.
- Foreseeti AB
- Aristiun Inc.
- CAIRIS Services Ltd.
- OWASP Foundation
- Microsoft Corporation
- Threagile UG
- ThreatSpec Ltd.
- Lucid Software Inc.
- Miro International GmbH
- Splunk Inc.
- Cisco Systems, Inc.
- SecureFlag Ltd.
- Tutamen GmbH
- Amazon Web Services, Inc.
- Kenna Security LLC
- International Business Machines Corporation
- Devici LLC
Additional Benefits:
- The market estimate (ME) sheet in Excel format
- 3 months of analyst support
TABLE OF CONTENTS
1 INTRODUCTION
- 1.1 Study Assumptions and Market Definition
- 1.2 Scope of the Study
2 RESEARCH METHODOLOGY
3 EXECUTIVE SUMMARY
4 MARKET LANDSCAPE
- 4.1 Market Overview
- 4.2 Market Drivers
- 4.2.1 Growing Regulatory Mandates for Secure Software Development
- 4.2.2 Surge in Cyberattacks Targeting Software Supply Chains
- 4.2.3 Shift-Left Security Adoption in DevSecOps Pipelines
- 4.2.4 Increasing Integration with AI-Driven Code Generation Platforms
- 4.2.5 Rise of Infrastructure-as-Code Threat Modeling Demand
- 4.2.6 Adoption of Threat Modeling Standards in Safety-Critical IoT Systems
- 4.3 Market Restraints
- 4.3.1 Lack of Skilled Threat Modeling Professionals
- 4.3.2 High Initial Setup and Integration Costs
- 4.3.3 Limited Support for Emerging Edge Computing Architectures
- 4.3.4 Fragmented Open-Source Alternatives Diluting Commercial Adoption
- 4.4 Industry Value Chain Analysis
- 4.5 Regulatory Landscape
- 4.6 Technological Outlook
- 4.7 Porter's Five Forces Analysis
- 4.7.1 Bargaining Power of Suppliers
- 4.7.2 Bargaining Power of Buyers
- 4.7.3 Threat of New Entrants
- 4.7.4 Threat of Substitutes
- 4.7.5 Intensity of Competitive Rivalry
- 4.8 Impact of Macroeconomic Factors on the Market
5 MARKET SIZE AND GROWTH FORECASTS (VALUE)
- 5.1 By Deployment Mode
- 5.1.1 Cloud-Based
- 5.1.2 On-Premise
- 5.1.3 Hybrid
- 5.2 By Tool Type
- 5.2.1 Enterprise Commercial Platforms
- 5.2.2 Open-Source / Community Editions
- 5.2.3 Threat-as-Code / CLI Tools
- 5.2.4 Diagramming-Centric Tools
- 5.2.5 Simulation and Attack-Graph Tools
- 5.3 By Organization Size
- 5.3.1 Large Enterprises
- 5.3.2 Small and Medium-Sized Enterprises (SMEs)
- 5.4 By End-User Vertical
- 5.4.1 BFSI
- 5.4.2 IT and Telecom
- 5.4.3 Healthcare and Life Sciences
- 5.4.4 Government and Defense
- 5.4.5 Retail and E-Commerce
- 5.4.6 Energy and Utilities
- 5.4.7 Manufacturing
- 5.4.8 Other End-User Verticals
- 5.5 By Geography
- 5.5.1 North America
- 5.5.1.1 United States
- 5.5.1.2 Canada
- 5.5.1.3 Mexico
- 5.5.2 Europe
- 5.5.2.1 Germany
- 5.5.2.2 United Kingdom
- 5.5.2.3 France
- 5.5.2.4 Italy
- 5.5.2.5 Rest of Europe
- 5.5.3 Asia-Pacific
- 5.5.3.1 China
- 5.5.3.2 Japan
- 5.5.3.3 India
- 5.5.3.4 South Korea
- 5.5.3.5 Australia
- 5.5.3.6 Rest of Asia-Pacific
- 5.5.4 Middle East and Africa
- 5.5.4.1 Middle East
- 5.5.4.1.1 Saudi Arabia
- 5.5.4.1.2 United Arab Emirates
- 5.5.4.1.3 Rest of the Middle East
- 5.5.4.2 Africa
- 5.5.4.2.1 South Africa
- 5.5.4.2.2 Egypt
- 5.5.4.2.3 Rest of Africa
- 5.5.4.1 Middle East
- 5.5.5 South America
- 5.5.5.1 Brazil
- 5.5.5.2 Argentina
- 5.5.5.3 Rest of South America
- 5.5.1 North America
6 COMPETITIVE LANDSCAPE
- 6.1 Market Concentration
- 6.2 Strategic Moves
- 6.3 Market Share Analysis
- 6.4 Company Profiles (includes Global level Overview, Market level overview, Core Segments, Financials as available, Strategic Information, Market Rank/Share for key companies, Products and Services, and Recent Developments)
- 6.4.1 ThreatModeler Software Inc.
- 6.4.2 IriusRisk Limited
- 6.4.3 Security Compass Inc.
- 6.4.4 Foreseeti AB
- 6.4.5 Aristiun Inc.
- 6.4.6 CAIRIS Services Ltd.
- 6.4.7 OWASP Foundation
- 6.4.8 Microsoft Corporation
- 6.4.9 Threagile UG
- 6.4.10 ThreatSpec Ltd.
- 6.4.11 Lucid Software Inc.
- 6.4.12 Miro International GmbH
- 6.4.13 Splunk Inc.
- 6.4.14 Cisco Systems, Inc.
- 6.4.15 SecureFlag Ltd.
- 6.4.16 Tutamen GmbH
- 6.4.17 Amazon Web Services, Inc.
- 6.4.18 Kenna Security LLC
- 6.4.19 International Business Machines Corporation
- 6.4.20 Devici LLC
7 MARKET OPPORTUNITIES AND FUTURE OUTLOOK
- 7.1 White-space and Unmet-Need Assessment
 人工智慧語意智慧市場預測至2034年:按組件、部署模式、技術、應用、最終用戶和地區分類的全球分析人工智慧驅動的威脅情報市場預測至2034年:按組件、安全類型、部署模式、組織規模、最終用戶和地區分類的全球分析
 威脅情報:市場佔有率分析、產業趨勢與統計、成長預測(2026-2031 年)
 威脅建模工具市場規模、佔有率和趨勢分析報告:按組件、部署類型、企業規模、行業、地區和細分市場預測(2026-2033 年)
 威脅情報市場:依組件、威脅情報類型、應用、部署模式和組織規模分類-2026年至2032年全球市場預測威脅建模工具市場:按組件、部署模式、用例、組織規模和產業分類-2026-2032年全球市場預測
 威脅建模工具市場分析及預測(至 2035 年):類型、產品類型、服務、技術、組件、應用、部署模式、最終用戶、功能、解決方案威脅情報市場分析及預測(至 2035 年):類型、產品類型、服務、技術、組件、應用、部署模式、最終用戶、解決方案、交付模式
 2026年全球威脅欺騙平台市場報告2026年全球人工智慧驅動威脅情報市場報告