


 |
市場調查報告書
商品編碼
2063252
渦輪機滴油:市場佔有率分析、行業趨勢和統計數據、成長預測(2026-2031 年)Turbine Drip Oil - Market Share Analysis, Industry Trends & Statistics, Growth Forecasts (2026 - 2031) |
||||||
※ 本網頁內容可能與最新版本有所差異。詳細情況請與我們聯繫。
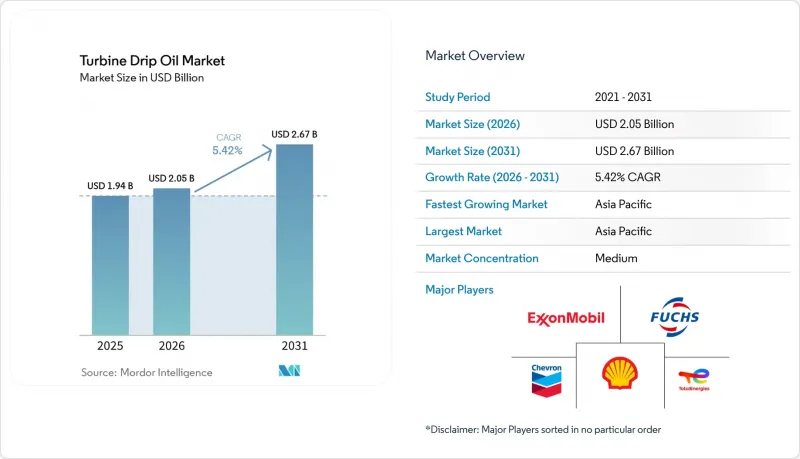
根據 Mordor Intelligence 預測,渦輪滴油市場規模預計將在 2025 年達到 19.4 億美元,2026 年達到 20.5 億美元,到 2031 年達到 26.7 億美元,2026 年至 2031 年的複合年成長率為 5.42%。
本報告按類型(礦物油、合成油、生物基油)、黏度等級(低黏度、中黏度、其他)、應用(蒸氣渦輪、燃氣渦輪機、其他)、最終用戶(發電廠、製造商、其他)和地區(北美、歐洲、亞太、南美、中東和非洲)進行細分。市場預測以美元計價。
全球渦輪機滴油市場趨勢與洞察
火力發電和水力發電的成長
H級聯合循環燃氣燃氣渦輪機的前置作業時間已延長至2030年,這反映了全球範圍內用高效燃氣渦輪機取代老舊燃煤電廠的趨勢,這些燃氣渦輪機的熱效率可達約60%。波蘭和多明尼加共和國的新建設案將分別採用優質ISO VG 46滴油,其更換週期為16,000小時。水電建設也在穩步推進。預計到2024年,光是中國就將新增14.4吉瓦的水力發電裝置容量,將持續推動對經濟高效、防水性能優異的ISO VG 46礦物油的需求。
工業渦輪機和旋轉機械的需求
液化裝置、中游壓縮站和煉廠天然氣壓縮機組需要黏度指數為140或更高(根據ASTM D3427標準,5分鐘內即可脫氣)的快速脫氣潤滑油。阿拉斯加液化天然氣公司80萬馬力的製冷壓縮機,加上Venture Global Prakmins二期擴建項目,將需要數十萬公升初始渦輪機油。 Susk Energy和Energy Transfer的類似現代化改造專案正在推動北美天然氣管網對合成ISO VG 32潤滑油的需求成長。
環境和安全法規
美國環保署的船舶通用許可證規定,船尾管潤滑油的生物分解率必須超過90%,迫使供應商改用酯類和聚乙二醇(PAG)類化學品,而這些化學品的成本是傳統II類潤滑油的兩倍。歐洲化學品管理局(ECHA)的CLP法規將某些未經處理的基料列為致癌性,加速了歐洲向氫化和合成替代品的轉變。中國的GB 11120-2011標準現要求黏度指數不低於90,閃點不低於200 度C,逐步淘汰低品質礦物油。
細分市場分析
到2025年,礦物油在汽輪機滴油市場仍將佔67.8%的佔有率,這主要得益於其價格優勢,僅為合成油的三分之一到五分之一。這些配方在汽輪機油穩定性測試中可達到2000至4000小時的使用壽命,足以滿足水輪機和低壓蒸氣組的性能要求。合成油雖然價格較高,但其更換週期是礦物油的六倍,且具有更優異的破乳性能,能夠滿足聯合循環燃氣渦輪機的規格要求。生物基油正以9.5%的複合年成長率快速成長,這得益於美國環保署(EPA)和歐盟生態標章法規的推動。對三羥甲基丙烷酯的研究已成功開發出黏度指數接近160、流點低於-40 度C的產品。
預計到2025年,中等黏度等級(ISO VG 32–68)潤滑油將佔總銷量的49.1%,而低黏度等級(ISO VG 15–32)潤滑油預計將以7.4%的複合年成長率成長,因為原始設備製造商(OEM)正在追求更高的能源效率。貝克休斯的研究表明,與ISO VG 32潤滑油相比,ISO VG 15–22潤滑油可降低5%至15%的機械損失,當天然氣價格超過4美元/百萬英熱單位(MMBtu)時,可使工廠層面的燃料消耗節省0.3%至0.5%。
高黏度潤滑油(ISO VG 100–150)用於船舶推進渦輪機和大型齒輪箱等特殊應用,這些應用需要更厚的油膜來防止金屬間的直接接觸。貝克休斯和埃尼的研究表明,與 ISO VG 32 相比,VG 15–22 混合油可降低 5%–15% 的黏度損失,從而使聯合循環發電廠節省 0.3%–0.5% 的燃料。雖然低黏度合成油(黏度指數為 140 或更高)是燃氣渦輪機的首選,但風力發電機正擴大轉向使用 ISO VG 130 潤滑油,以減少潤滑脂的使用量。先進的添加劑和氧化穩定性測試確保了其在熱應力下的性能,滿足燃氣渦輪機商 (OEM) 的要求。
區域分析
預計到2025年,亞太地區將佔全球銷售額的45.0%,並在2031年之前繼續以6.3%的複合年成長率成長,這主要得益於印度1450億美元的基礎設施建設投資以及中國不斷擴大的水電和風電部署。除了國內產能的提升,該地區也正在加強第二類和第三類原油的區域自給自足能力,同時印度石油公司和埃克森美孚印度公司也在該地區拓展調和業務。
在北美和歐洲,嚴格的環境法規和脫碳要求刺激了對低揮發性有機化合物(VOC)合成油和生物基油的需求,但由於燃煤發電廠的逐步淘汰,需求正在萎縮。液化天然氣中游領域的投資以及聯合循環發電廠的運作,在一定程度上抵消了蒸氣渦輪機油需求的下降。
沿岸地區的石化聯合企業需要高溫合成潤滑油,而在巴西,水力發電佔據主導地位,維持對ISO VG 46礦物油的需求。阿根廷的瓦卡穆爾塔輸油管項目和埃及燃氣渦輪機設施的擴建,為擁有適用於沙漠氣候潤滑油產品的供應商創造了更多高利潤機會。在沙烏地阿拉伯和阿拉伯聯合大公國,聯合循環發電廠正在投入運營,需要能夠在高溫環境下使用且運作極低的優質合成潤滑油。在南非,老舊的燃煤發電廠支撐著對礦物油的需求,即便可再生能源計畫正在推進。巴西的水力發電和風力發電產業正在推動對ISO VG 46潤滑油和ISO VG 320潤滑脂的需求。阿根廷的瓦卡穆爾塔頁岩正在促進合成油的使用,但在埃及和奈及利亞,政治和經濟挑戰限制了需求的成長。
其他好處:
- Excel格式的市場預測(ME)表
- 3個月的分析師支持
目錄
第1章:引言
- 研究假設和市場定義
- 調查範圍
第2章:調查方法
第3章執行摘要
第4章 市場狀況
- 市場概覽
- 市場促進因素
- 火力發電和水力發電的成長
- 工業渦輪機和旋轉機械的需求
- 新興國家的工業擴張
- 引入由預測性維護驅動的自動化潤滑系統。
- 透過 OEM 過渡到優質低 VOC 滴油
- 市場限制因素
- 環境和安全法規
- 向可再生能源轉型
- 基礎油價格和供應的波動
- 供應鏈分析
- 監理情勢
- 技術展望
- 波特五力模型
第5章 市場規模與成長預測
- 按類型
- 礦物基
- 合成
- 生物基
- 按黏度等級
- 低黏度
- 中等黏度
- 高黏度
- 透過使用
- 蒸氣渦輪
- 燃氣渦輪機
- 風力發電機
- 水力渦輪機
- 最終用戶
- 發電公司
- 石油和天然氣
- 製造業
- 船舶/運輸
- 其他(採礦、紙漿和造紙業)
- 按地區
- 北美洲
- 美國
- 加拿大
- 墨西哥
- 歐洲
- 德國
- 英國
- 法國
- 義大利
- 北歐國家
- 俄羅斯
- 其他歐洲國家
- 亞太地區
- 中國
- 印度
- 日本
- 韓國
- 東南亞國協
- 其他亞太國家
- 南美洲
- 巴西
- 阿根廷
- 其他南美國家
- 中東和非洲
- 沙烏地阿拉伯
- 阿拉伯聯合大公國
- 南非
- 埃及
- 其他中東和非洲國家
- 北美洲
第6章 競爭情勢
- 市場集中度
- 策略趨勢(併購、聯盟、購電協議)
- 市場佔有率分析(主要公司的市場排名和佔有率)
- 公司簡介
- ExxonMobil Corporation
- Chevron Corporation
- Royal Dutch Shell plc
- TotalEnergies SE
- Fuchs Petrolub SE
- Phillips 66(Kendall)
- Suncor(Petro-Canada Lubricants)
- Indian Oil Corporation Ltd.
- Bharat Petroleum Corp. Ltd.
- Amsoil Inc.
- Idemitsu Kosan Co.
- Valvoline Inc.
- Sinopec Lubricants
- ENEOS Holdings
- PetroChina Lubricants
- Gazpromneft-SM
- Caltex Australia
- Petronas Lubricants
- Quaker Houghton
- BP Castrol
第7章 市場機會與未來展望
According to Mordor Intelligence, the turbine drip oil market size is projected to be USD 1.94 billion in 2025, USD 2.05 billion in 2026, and reach USD 2.67 billion by 2031, growing at a CAGR of 5.42% from 2026 to 2031.
This report is Segmented by Type (Mineral-Based, Synthetic, and Bio-Based), Viscosity Grade (Low Viscosity, Medium Viscosity, Others), Application (Steam Turbines, Gas Turbines, Others), End-User (Power Generation Utilities, Manufacturing, and More), and Geography (North America, Europe, Asia-Pacific, South America, and Middle East and Africa). The Market Forecasts are Provided in Terms of Value (USD).
Global Turbine Drip Oil Market Trends and Insights
Growth of Thermal & Hydro-Power Generation
Lead times for H-class combined-cycle gas turbines now extend to 2030, reflecting a worldwide push to replace aging coal assets with high-efficiency gas units that reach about 60% thermal efficiency. New builds in Poland and the Dominican Republic will each consume premium ISO VG 46 drip oils designed for 16,000-hour drain intervals. Hydropower additions remain robust. China alone brought on 14.4 GW in 2024, maintaining demand for cost-effective ISO VG 46 mineral oils resistant to water ingress.
Demand from Industrial Turbines & Rotating Equipment
Liquefaction plants, midstream compressor stations and refinery gas-compressor trains require rapid air-release oils (≤5 min per ASTM D3427) with viscosity indices above 140. Alaska LNG's 800,000 HP refrigeration compressors and Venture Global's Plaquemines Phase 2 expansion together translate into several hundred thousand liters of initial turbine oil fills. Similar modernization programs at SaskEnergy and Energy Transfer demonstrate the upswing in synthetic ISO VG 32 consumption within North America's gas grid.
Environmental & Safety Regulations
The EPA Vessel General Permit obliges stern-tube lubricants to exhibit > 90% biodegradability, pushing suppliers toward ester and PAG chemistries that cost up to twice conventional Group II oils. ECHA's CLP rules classify certain untreated base stocks as carcinogenic, accelerating the shift to hydrotreated and synthetic alternatives in Europe. China's GB 11120-2011 standard now requires viscosity indices ≥90 and flash points > 200 °C, phasing out low-quality mineral oils.
Other drivers and restraints analyzed in the detailed report include:
- Industrial Expansion in Emerging Economies
- Predictive-Maintenance-Driven Auto-Lubrication Adoption
- Shift Toward Renewable Energy Sources
For complete list of drivers and restraints, kindly check the Table Of Contents.
Segment Analysis
Mineral oils retained 67.8% share of the turbine drip oil market in 2025 on the back of favorable pricing, one-third to one-fifth of synthetic alternatives. These formulations deliver Turbine Oil Stability Test life of 2,000-4,000 h, adequate for hydro turbines and low-pressure steam units. Synthetics, while costlier, offer six-times-longer drain intervals and superior demulsibility, winning specifications in combined-cycle gas turbines. Bio-based oils, benefiting from EPA and EU ecolabel mandates, are advancing at 9.5% CAGR; trimethylolpropane ester research now yields viscosity indices near 160 and pour points below -40 °C.
Medium grades (ISO VG 32-68) still represent 49.1% of 2025 volume, but low-viscosity grades (ISO VG 15-32) are set to expand at 7.4% CAGR as OEMs chase energy-efficiency gains. Baker Hughes studies show that ISO VG 15-22 oils can cut mechanical losses by 5-15% versus ISO VG 32, translating to 0.3-0.5% plant-level fuel savings when natural-gas prices exceed USD 4 / MMBtu.
High-viscosity oils (ISO VG 100-150) are used in specialized applications like marine propulsion turbines and heavy-duty gearboxes, requiring thicker films to prevent metal-to-metal contact. Research by Baker Hughes and Eni showed VG 15-22 formulations reduce viscous losses by 5%-15% versus ISO VG 32, saving 0.3%-0.5% fuel in combined-cycle plants. Low-viscosity synthetics with viscosity indices above 140 are preferred for gas turbines, while wind turbines are shifting to ISO VG 130 oils to reduce grease use. Advanced additives and oxidation-stability testing ensure performance under thermal stress, meeting OEM requirements.
Geography Analysis
Asia-Pacific commanded 45.0% revenue in 2025 and is projected to expand at 6.3% CAGR through 2031, supported by India's USD 145 billion infrastructure push and China's hydropower and wind roll-outs. Domestic capacity additions, combined with localized blending expansions by Indian Oil Corporation and ExxonMobil India, reinforce regional self-sufficiency in Group II and Group III output.
In North America and Europe, tight environmental regulations and decarbonization mandates stimulate demand for low-VOC synthetics and bio-based oils, but shrink volumes as coal fleets retire. LNG midstream investments and repowering of combined-cycle plants partially offset lost steam-turbine volumes.
Gulf petrochemical complexes require high-temperature synthetics, while Brazil's hydropower dominance sustains ISO VG 46 mineral demand. Argentina's Vaca Muerta pipeline projects and Egypt's gas-turbine additions present incremental, high-margin opportunities for suppliers with desert-climate lubricant portfolios. Saudi Arabia and the UAE are commissioning combined-cycle plants requiring premium synthetics for high temperatures and minimal maintenance. South Africa's aging coal fleet sustains mineral oil demand despite renewable energy efforts. Brazil's hydropower and wind sectors drive demand for ISO VG 46 oils and ISO VG 320 greases. Argentina's Vaca Muerta shale boosts synthetic oil use, while Egypt and Nigeria see incremental demand constrained by political and economic challenges.
- ExxonMobil Corporation
- Chevron Corporation
- Royal Dutch Shell plc
- TotalEnergies SE
- Fuchs Petrolub SE
- Phillips 66 (Kendall)
- Suncor (Petro-Canada Lubricants)
- Indian Oil Corporation Ltd.
- Bharat Petroleum Corp. Ltd.
- Amsoil Inc.
- Idemitsu Kosan Co.
- Valvoline Inc.
- Sinopec Lubricants
- ENEOS Holdings
- PetroChina Lubricants
- Gazpromneft-SM
- Caltex Australia
- Petronas Lubricants
- Quaker Houghton
- BP Castrol
Additional Benefits:
- The market estimate (ME) sheet in Excel format
- 3 months of analyst support
TABLE OF CONTENTS
1 Introduction
- 1.1 Study Assumptions & Market Definition
- 1.2 Scope of the Study
2 Research Methodology
3 Executive Summary
4 Market Landscape
- 4.1 Market Overview
- 4.2 Market Drivers
- 4.2.1 Growth of thermal & hydro-power generation
- 4.2.2 Demand from industrial turbines & rotating equipment
- 4.2.3 Industrial expansion in emerging economies
- 4.2.4 Predictive-maintenance-driven auto-lubrication adoption
- 4.2.5 OEM shift to premium low-VOC drip oils
- 4.3 Market Restraints
- 4.3.1 Environmental & safety regulations
- 4.3.2 Shift toward renewable energy sources
- 4.3.3 Base-oil price volatility & supply swings
- 4.4 Supply-Chain Analysis
- 4.5 Regulatory Landscape
- 4.6 Technological Outlook
- 4.7 Porter's Five Forces
- 4.7.1 Threat of New Entrants
- 4.7.2 Bargaining Power of Buyers
- 4.7.3 Bargaining Power of Suppliers
- 4.7.4 Threat of Substitutes
- 4.7.5 Competitive Rivalry
5 Market Size & Growth Forecasts
- 5.1 By Type
- 5.1.1 Mineral-based
- 5.1.2 Synthetic
- 5.1.3 Bio-based
- 5.2 By Viscosity Grade
- 5.2.1 Low Viscosity
- 5.2.2 Medium Viscosity
- 5.2.3 High Viscosity
- 5.3 By Application
- 5.3.1 Steam Turbines
- 5.3.2 Gas Turbines
- 5.3.3 Wind Turbines
- 5.3.4 Hydro Turbines
- 5.4 By End-user
- 5.4.1 Power Generation Utilities
- 5.4.2 Oil and Gas
- 5.4.3 Manufacturing
- 5.4.4 Marine and Transportation
- 5.4.5 Others (Mining, Pulp and Paper)
- 5.5 By Geography
- 5.5.1 North America
- 5.5.1.1 United States
- 5.5.1.2 Canada
- 5.5.1.3 Mexico
- 5.5.2 Europe
- 5.5.2.1 Germany
- 5.5.2.2 United Kingdom
- 5.5.2.3 France
- 5.5.2.4 Italy
- 5.5.2.5 NORDIC Countries
- 5.5.2.6 Russia
- 5.5.2.7 Rest of Europe
- 5.5.3 Asia-Pacific
- 5.5.3.1 China
- 5.5.3.2 India
- 5.5.3.3 Japan
- 5.5.3.4 South Korea
- 5.5.3.5 ASEAN Countries
- 5.5.3.6 Rest of Asia-Pacific
- 5.5.4 South America
- 5.5.4.1 Brazil
- 5.5.4.2 Argentina
- 5.5.4.3 Rest of South America
- 5.5.5 Middle East and Africa
- 5.5.5.1 Saudi Arabia
- 5.5.5.2 United Arab Emirates
- 5.5.5.3 South Africa
- 5.5.5.4 Egypt
- 5.5.5.5 Rest of Middle East and Africa
- 5.5.1 North America
6 Competitive Landscape
- 6.1 Market Concentration
- 6.2 Strategic Moves (M&A, Partnerships, PPAs)
- 6.3 Market Share Analysis (Market Rank/Share for key companies)
- 6.4 Company Profiles (includes Global level Overview, Market level overview, Core Segments, Financials as available, Strategic Information, Products & Services, and Recent Developments)
- 6.4.1 ExxonMobil Corporation
- 6.4.2 Chevron Corporation
- 6.4.3 Royal Dutch Shell plc
- 6.4.4 TotalEnergies SE
- 6.4.5 Fuchs Petrolub SE
- 6.4.6 Phillips 66 (Kendall)
- 6.4.7 Suncor (Petro-Canada Lubricants)
- 6.4.8 Indian Oil Corporation Ltd.
- 6.4.9 Bharat Petroleum Corp. Ltd.
- 6.4.10 Amsoil Inc.
- 6.4.11 Idemitsu Kosan Co.
- 6.4.12 Valvoline Inc.
- 6.4.13 Sinopec Lubricants
- 6.4.14 ENEOS Holdings
- 6.4.15 PetroChina Lubricants
- 6.4.16 Gazpromneft-SM
- 6.4.17 Caltex Australia
- 6.4.18 Petronas Lubricants
- 6.4.19 Quaker Houghton
- 6.4.20 BP Castrol
7 Market Opportunities & Future Outlook
- 7.1 White-space & Unmet-need Assessment
- 7.2 Emerging OEM specs & turbine upgrades
- 7.3 Bio-based & sustainable lubricant R&D
- 7.4 Digital supply-chain & service bundles


