


 |
市場調查報告書
商品編碼
1685058
渦輪機油市場機會、成長動力、產業趨勢分析與 2025 - 2034 年預測Turbine Oil Market Opportunity, Growth Drivers, Industry Trend Analysis, and Forecast 2025 - 2034 |
||||||
2024 年全球渦輪機油市場價值為 46 億美元,預計在 2025 年至 2034 年期間的複合年成長率為 4.8%,這得益於電力需求的成長和全球發電能力的持續擴張。隨著全球能源產業的不斷發展,對高性能潤滑油的需求變得越來越重要。渦輪機油透過減少摩擦、防止腐蝕和提高整體效率在確保渦輪機無縫運行方面發揮著至關重要的作用。它們能夠承受極端操作條件,這使得它們在發電廠、航空和海洋應用中不可或缺。
對清潔能源的追求和老化電力基礎設施的現代化進一步推動了對先進渦輪機油的需求。新興經濟體,特別是亞洲和中東的經濟體,正在經歷快速工業化,導致電力消費激增。對風能和水力發電等再生能源項目的投資也促進了市場成長。製造商專注於創新,開發具有更好的熱穩定性、抗氧化性和更長使用壽命的渦輪機油,以滿足能源產業不斷變化的需求。此外,發電廠數位監控系統的整合可以實現預測性維護,從而推動優質潤滑油的採用。
| 市場範圍 | |
|---|---|
| 起始年份 | 2024 |
| 預測年份 | 2025-2034 |
| 起始值 | 46億美元 |
| 預測值 | 75億美元 |
| 複合年成長率 | 4.8% |
渦輪機油市場依產品分為礦物油基、合成基和生物基渦輪機油。礦物油基渦輪機油引領市場,2024 年創收 21 億美元,預計預測期內複合年成長率為 5.1%。它們在發電廠和工業應用中的廣泛使用,加上其成本效益,繼續推動需求。此外,對設備維護和效率最佳化的認知不斷提高,正在影響最終用戶投資高品質的渦輪機油,進一步推動市場擴張。
按應用分類,燃氣渦輪機佔據行業主導地位,2024 年的收入為 22 億美元。預計在分析期內,該領域的複合年成長率為 4.9%。向節能解決方案的轉變以及持續的研發努力正在塑造競爭格局。製造商正在推出具有優異氧化穩定性和增強性能的下一代渦輪機油,以延長設備壽命並最大限度地降低維護成本。這些創新有望加速產品的採用,特別是在優先考慮永續性的領域。
中國仍然是渦輪機油市場的關鍵參與者,2024 年的估值為 6.527 億美元,並且在預測期內呈現強勁的成長軌跡。在快速工業化、基礎設施發展和大力投資再生能源的推動下,該國的能源產業正在經歷重大轉型。作為全球最大的能源消費國和生產國,中國正在擴大風電和水力發電裝置容量,以滿足不斷成長的能源需求並實現碳中和目標。能源生產項目的激增極大地增加了對渦輪機油的需求,特別是在風力渦輪機和蒸汽渦輪機應用中。
目錄
第 1 章:方法論與範圍
- 市場範圍和定義
- 基礎估算與計算
- 預測計算
- 資料來源
- 基本的
- 次要
- 付費來源
- 公共資源
第 2 章:執行摘要
第 3 章:產業洞察
- 產業生態系統分析
- 影響價值鏈的因素
- 利潤率分析
- 中斷
- 未來展望
- 製造商
- 經銷商
- 供應商概況
- 利潤率分析
- 重要新聞及舉措
- 監管格局
- 衝擊力
- 成長動力
- 電力需求不斷成長
- 擴大發電能力
- 再生能源投資激增
- 執行嚴格的法規和標準
- 產業陷阱與挑戰
- 原物料價格波動
- 成長動力
- 成長潛力分析
- 波特的分析
- PESTEL 分析
第4章:競爭格局
- 介紹
- 公司市佔率分析
- 競爭定位矩陣
- 戰略展望矩陣
第 5 章:市場規模及預測:依產品,2021-2034 年
- 主要趨勢
- 礦物油基渦輪機油
- 合成渦輪機油
- 生物基渦輪機油
第 6 章:市場規模與預測:按應用,2021-2034 年
- 主要趨勢
- 瓦斯渦輪機
- 蒸汽渦輪機
- 水力渦輪機
- 其他
第 7 章:市場規模與預測:依最終用途,2021-2034 年
- 主要趨勢
- 工業的
- 公用事業
第 8 章:市場規模與預測:按地區,2021-2034 年
- 主要趨勢
- 北美洲
- 美國
- 加拿大
- 歐洲
- 英國
- 德國
- 法國
- 義大利
- 西班牙
- 俄羅斯
- 亞太地區
- 中國
- 印度
- 日本
- 韓國
- 澳洲
- 拉丁美洲
- 巴西
- 墨西哥
- 中東及非洲
- 南非
- 沙烏地阿拉伯
- 阿拉伯聯合大公國
第9章:公司簡介
- Afton Chemical
- BP plc
- Castrol
- Chevron USA Inc.
- Eastern Petroleum
- Eastman Chemical Company
- Exxon Mobil Corporation
- FUCHS
- Idemitsu
- Indian Oil Corporation Ltd.
- Kluber Lubrication
- Lubrizol
- LUKOIL Marine Lubricants
- NYCO
- Paras Lubricants Ltd.
- Penrite Oil
- PETRONAS
- Quaker Chemical Corporation
- Repsol
- Shell
- TotalEnergies
- Valvoline Global
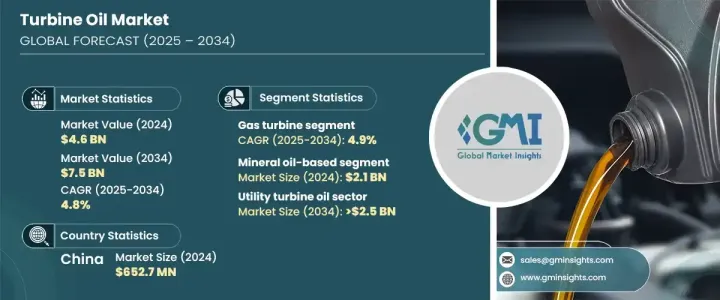
The Global Turbine Oil Market generated USD 4.6 billion in 2024 and is projected to grow at a CAGR of 4.8% between 2025 and 2034, driven by rising electricity demand and the ongoing expansion of power generation capacities worldwide. As the global energy sector continues to evolve, the need for high-performance lubricants becomes increasingly critical. Turbine oils play a vital role in ensuring the seamless operation of turbines by reducing friction, preventing corrosion, and enhancing overall efficiency. Their ability to withstand extreme operating conditions makes them indispensable in power plants, aviation, and marine applications.
The push for cleaner energy sources and the modernization of aging power infrastructure are further propelling the demand for advanced turbine oils. Emerging economies, particularly in Asia and the Middle East, are witnessing rapid industrialization, leading to an upsurge in electricity consumption. Investments in renewable energy projects, such as wind and hydropower, are also contributing to market growth. Manufacturers are focusing on innovation, developing turbine oils with improved thermal stability, oxidation resistance, and extended service life to meet the evolving requirements of the energy sector. Additionally, the integration of digital monitoring systems in power plants enables predictive maintenance, driving the adoption of premium-quality lubricants.
| Market Scope | |
|---|---|
| Start Year | 2024 |
| Forecast Year | 2025-2034 |
| Start Value | $4.6 Billion |
| Forecast Value | $7.5 Billion |
| CAGR | 4.8% |
The turbine oil market is segmented by product into mineral oil-based, synthetic, and bio-based turbine oils. Mineral oil-based turbine oils led the market, generating USD 2.1 billion in 2024, and are anticipated to grow at a CAGR of 5.1% through the forecast period. Their widespread use in power plants and industrial applications, combined with cost-effectiveness, continues to drive demand. Additionally, increasing awareness about equipment maintenance and efficiency optimization is influencing end users to invest in high-quality turbine oils, further fueling market expansion.
By application, gas turbines dominated the industry, accounting for USD 2.2 billion in revenue in 2024. The segment is forecasted to grow at a CAGR of 4.9% during the analysis period. The transition toward energy-efficient solutions, along with continuous R&D efforts, is shaping the competitive landscape. Manufacturers are introducing next-generation turbine oils with superior oxidative stability and enhanced performance to extend equipment life and minimize maintenance costs. These innovations are expected to accelerate product adoption, especially in sectors prioritizing sustainability.
China remains a key player in the turbine oil market, with a valuation of USD 652.7 million in 2024 and a strong growth trajectory over the forecast period. The country's energy sector is undergoing a major transformation fueled by rapid industrialization, infrastructure development, and aggressive investments in renewable energy. As the largest energy consumer and producer globally, China is expanding its wind and hydropower capacity to meet rising energy demands and achieve carbon neutrality targets. The surge in energy generation projects is significantly boosting the demand for turbine oils, particularly in wind and steam turbine applications.
Table of Contents
Chapter 1 Methodology & Scope
- 1.1 Market scope & definition
- 1.2 Base estimates & calculations
- 1.3 Forecast calculation
- 1.4 Data sources
- 1.4.1 Primary
- 1.4.2 Secondary
- 1.4.2.1 Paid sources
- 1.4.2.2 Public sources
Chapter 2 Executive Summary
- 2.1 Industry synopsis, 2021-2034
Chapter 3 Industry Insights
- 3.1 Industry ecosystem analysis
- 3.1.1 Factor affecting the value chain
- 3.1.2 Profit margin analysis
- 3.1.3 Disruptions
- 3.1.4 Future outlook
- 3.1.5 Manufacturers
- 3.1.6 Distributors
- 3.2 Supplier landscape
- 3.3 Profit margin analysis
- 3.4 Key news & initiatives
- 3.5 Regulatory landscape
- 3.6 Impact forces
- 3.6.1 Growth drivers
- 3.6.1.1 Increasing demand for electricity
- 3.6.1.2 Expansion of power generation capacity
- 3.6.1.3 Surging investments in renewable energy
- 3.6.1.4 Implementation of stringent regulations and standards
- 3.6.2 Industry pitfalls & challenges
- 3.6.2.1 Price volatility of raw materials
- 3.6.1 Growth drivers
- 3.7 Growth potential analysis
- 3.8 Porter’s analysis
- 3.9 PESTEL analysis
Chapter 4 Competitive Landscape, 2024
- 4.1 Introduction
- 4.2 Company market share analysis
- 4.3 Competitive positioning matrix
- 4.4 Strategic outlook matrix
Chapter 5 Market Size and Forecast, By Product, 2021-2034 (USD Billion) (Kilo Tons)
- 5.1 Key trends
- 5.2 Mineral oil-based turbine oil
- 5.3 Synthetic turbine oil
- 5.4 Bio-based turbine oil
Chapter 6 Market Size and Forecast, By Application, 2021-2034 (USD Billion) (Kilo Tons)
- 6.1 Key trends
- 6.2 Gas turbine
- 6.3 Steam turbine
- 6.4 Hydro turbine
- 6.5 Others
Chapter 7 Market Size and Forecast, By End Use, 2021-2034 (USD Billion) (Kilo Tons)
- 7.1 Key trends
- 7.2 Industrial
- 7.3 Utility
Chapter 8 Market Size and Forecast, By Region, 2021-2034 (USD Billion) (Kilo Tons)
- 8.1 Key trends
- 8.2 North America
- 8.2.1 U.S.
- 8.2.2 Canada
- 8.3 Europe
- 8.3.1 UK
- 8.3.2 Germany
- 8.3.3 France
- 8.3.4 Italy
- 8.3.5 Spain
- 8.3.6 Russia
- 8.4 Asia Pacific
- 8.4.1 China
- 8.4.2 India
- 8.4.3 Japan
- 8.4.4 South Korea
- 8.4.5 Australia
- 8.5 Latin America
- 8.5.1 Brazil
- 8.5.2 Mexico
- 8.6 MEA
- 8.6.1 South Africa
- 8.6.2 Saudi Arabia
- 8.6.3 UAE
Chapter 9 Company Profiles
- 9.1 Afton Chemical
- 9.2 BP p.l.c.
- 9.3 Castrol
- 9.4 Chevron U.S.A. Inc.
- 9.5 Eastern Petroleum
- 9.6 Eastman Chemical Company
- 9.7 Exxon Mobil Corporation
- 9.8 FUCHS
- 9.9 Idemitsu
- 9.10 Indian Oil Corporation Ltd.
- 9.11 Kluber Lubrication
- 9.12 Lubrizol
- 9.13 LUKOIL Marine Lubricants
- 9.14 NYCO
- 9.15 Paras Lubricants Ltd.
- 9.16 Penrite Oil
- 9.17 PETRONAS
- 9.18 Quaker Chemical Corporation
- 9.19 Repsol
- 9.20 Shell
- 9.21 TotalEnergies
- 9.22 Valvoline Global


