

 |
市場調查報告書
商品編碼
2063248
先進能源儲存系統:市場佔有率分析、產業趨勢與統計及成長預測(2026-2031)Advanced Energy Storage Systems - Market Share Analysis, Industry Trends & Statistics, Growth Forecasts (2026 - 2031) |
||||||
※ 本網頁內容可能與最新版本有所差異。詳細情況請與我們聯繫。
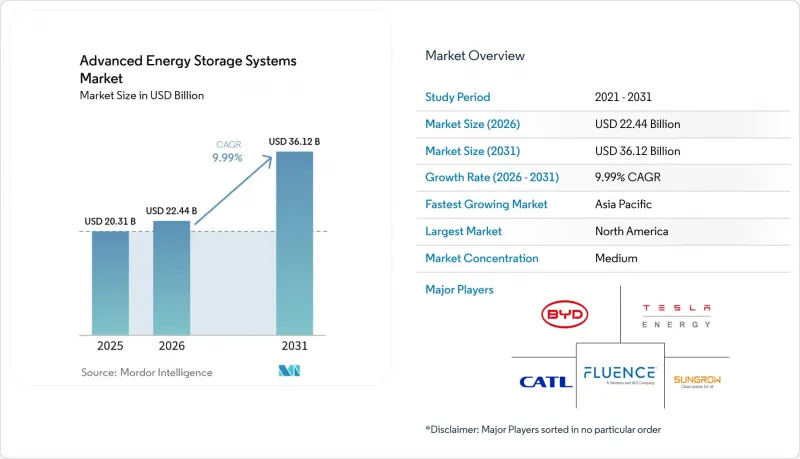
根據 Mordor Intelligence 預測,先進能源儲存系統的市場規模預計將從 2025 年的 203.1 億美元成長到 2026 年的 224.4 億美元,到 2031 年達到 361.2 億美元,2026 年至 2031 年的複合年成長率預計為 9.99%。
本報告按類型(電化學儲能、熱能儲能、機械儲能及其他)、應用(系統互連用儲能、可再生能源併網及其他)、最終用戶(公共產業、工商業及其他)和地區(北美、歐洲、亞太、南美、中東和非洲)進行細分。市場預測以美元計價。
全球先進能源儲存系統市場趨勢及洞察
鋰離子電池每千瓦時的價格已經大幅下降。
預計鋰離子電池組的平均價格將在2025年降至每千瓦時108美元,並在2026年降至每千瓦時105美元。同時,大規模電力公司已在電池組層級鎖定低於每千瓦時70美元的價格。採用磷酸鋰鐵正極材料消除了對鈷的依賴,並提高了循環壽命,使得企業無需補貼即可在4小時供電項目上透過套利交易獲利。寧德時代寧德工廠的規模經濟使其在2024年實現了69吉瓦時的產能,為競爭對手樹立了生產標竿。成本曲線趨於平緩,未來成本的進一步降低取決於固態固態電池和鈉離子電池的技術突破,而這些技術目前仍處於試驗階段。因此,電池製造商正在整合到下游製程以確保利潤,這迫使純粹的系統整合商將注意力集中在軟體的價值上。
全球清潔能源指令與儲能採購目標
美國將投資稅額扣抵延長至2032年,加上各州設定的目標,例如加州16.9吉瓦和新澤西州2吉瓦的目標,正在建立一條清晰的融資管道,以降低資金籌措風險。歐洲的REPowerEU計畫為德國設定了17.5吉瓦的目標,為英國設定了50吉瓦的目標,而中國則要求儲能容量達到其可再生能源額定容量的20%。這些強制性要求將電池儲能系統整合到每個新的太陽能和風能發電工程中,迫使開發商提前18至24個月預訂系統,從而加劇供應鏈的壓力。 IEC 62933性能標準和ISO 22600安全協議正逐漸成為競標的通用先決條件,正式確立了品質標準。
必需礦物質的價格和供應波動
在剛果民主共和國,出口配額導致鈷產量下降,預計2025年鈷價將飆升240%。同時,由於中國需求的不確定性,碳酸鋰價格在每噸12,000美元至28,000美元之間劇烈波動。鎳價則呈現相反的趨勢,印尼增壓壓低了價格,但如果高成本礦場持續運作,未來的供應可能會受到威脅。電池製造商正在採用磷酸鋰鐵來應對這項挑戰,而磷酸鐵鋰可以避免鈷和鎳相關的風險,但也因此對磷酸鹽產生了依賴。目前,多年期承購合約和上游合資企業已成為標準做法,這使得能夠向礦山預付貨款的大型垂直一體化公司在確保供應穩定方面佔據優勢。
細分市場分析
到2025年,電化學系統將佔據先進能源儲存系統市場佔有率的57.9%。這主要得益於磷酸鋰鐵鐵電池,其價格約為每千瓦時105美元,循環壽命超過8,000次。因此,基於電化學技術的先進能源儲存系統市場規模在那些可以透過4小時的續航時間消除市場價格差異的領域成長最為迅速。液流電池和鈉硫電池的續航時限可達6至10小時,但由於高溫和釩成本高昂,其應用僅限於特定領域。在預測期內,隨著額外成本的降低和容器標準化,電化學產品組合預計將擴展到關鍵的峰值需求應用領域,而長期儲能的作用正日益轉向化學和機械儲能形式。
隨著綠色氫能和合成燃料不僅成為調節高峰需求的手段,更成為電網穩定的基礎,化學儲能技術正以13.3%的複合年成長率快速發展。三菱電機在猶他州的317兆瓦項目,將洞穴儲能與220兆瓦電解槽相結合,證明即使放電持續數天,其內部收益率(IRR)也能與燃氣發電高峰期相媲美。雖然從熔鹽儲罐到壓縮空氣洞穴等熱力機械儲能系統仍受位置和授權限制,但對於持續時間超過8小時的應用,它們每千瓦時的成本較低,從而確保了先進能源儲存系統市場的多元化。
區域分析
預計到2025年,亞太地區將佔全球銷售額的46.2%,主要得益於中國垂直整合的價值鏈。在該地區,寧德時代(CATL)、比亞迪(BYD)和易維能源(EVE Energy)的年總產量合計超過300吉瓦時(GWh)。各省強制要求所有可再生能源發電發電廠配備15-20%的儲能容量,持續推動了市場需求。山東省3.5吉瓦的儲能計畫等大型企劃也展現了大規模實施的能力。日本正在推廣具有長期容錯能力的鈉硫電池,而印度的生產連結獎勵計畫計劃(PLI)則為支持東南亞供應鏈的超級工廠提供資金,從而確保先進能源儲存系統市場在該地區保持穩定發展。
在北美,成長主要由14.5%的複合年成長率驅動,這得益於鼓勵本地製造業發展的國內採購價格獎勵政策,例如《通貨膨脹控制法案》稅額扣抵、特斯拉40GWh巨型電池組生產線以及LG在亞利桑那州的擴張。德克薩斯州電力市場(ERCOT)預計到2025年,其年度新增裝置量將超過加州,這得益於其基於績效的輔助服務定價結構,該結構獎勵那些能夠以亞秒級增量響應的資產。加拿大和墨西哥也正在效仿,實施旨在平滑可再生能源輸出的政策支持型競標。
在歐洲,英國50吉瓦的目標、德國17.5吉瓦的目標以及歐盟的採購要求迫使開發商在確保供應穩定性的同時,應對本地組裝帶來的15%至20%的額外資本投入。在北歐,抽水蓄能電站正應對季節性電力平衡調整;而在東歐,鋰離子電池正因其能夠穩定不斷擴張的太陽能發電工程而備受關注。在南美洲,巴西和阿根廷正準備進行首次大規模競標,人們對混合太陽能和電池儲能系統寄予厚望,希望它們能緩解棄風棄光問題。在中東和非洲,沙烏地阿拉伯於2026年1月並網了7.8吉瓦時的電池儲能系統,創下區域紀錄,此後,該地區的儲能活動正在加速推進。
其他好處:
- Excel格式的市場預測(ME)表
- 3個月的分析師支持
目錄
第1章:引言
- 研究假設和市場定義
- 調查範圍
第2章:調查方法
第3章執行摘要
第4章 市場狀況
- 市場概覽
- 市場促進因素
- 鋰離子電池每千瓦時的價格已經大幅下降。
- 全球清潔能源部署義務與儲能設備採購目標
- 在輔助服務市場累積收入
- 透過電動車規模化生產降低固定成本
- 電動車二手電池組正在開闢一個低成本投資市場。
- 人工智慧驅動的發電規劃可提高專案內部報酬率。
- 市場限制因素
- 基本礦產的價格和供應波動
- 遵守熱失控和消防安全法規的成本
- 美歐貿易壁壘與在地採購義務
- 與非電池型長期儲能系統的競爭
- 供應鏈分析
- 監理情勢
- 技術展望
- 波特五力模型
第5章 市場規模與成長預測
- 按類型
- 電化學儲能
- 鋰離子電池
- 鈉硫電池
- 液流電池
- 鉛酸電池
- 鎳基電池
- 熱能儲存
- 顯熱
- 潛熱
- 熱化學式
- 機械存儲
- 抽水蓄能水力發電
- 壓縮空氣(CAES)
- 飛輪儲能
- 化學物質的儲存
- 氫
- 合成天然氣
- 氨
- 混合儲能系統
- 電化學儲能
- 透過使用
- 網格儲存
- 可再生能源的整合
- 應急電源系統
- 電動車基礎設施
- 工業能源管理
- 適用於離網和偏遠地區的儲能系統
- 住宅儲能系統
- 最終用戶
- 公用事業
- 商業和工業用途
- 住宅
- 按地區
- 北美洲
- 美國
- 加拿大
- 墨西哥
- 歐洲
- 德國
- 英國
- 法國
- 義大利
- 北歐國家
- 俄羅斯
- 其他歐洲國家
- 亞太地區
- 中國
- 印度
- 日本
- 韓國
- 東南亞國協
- 其他亞太國家
- 南美洲
- 巴西
- 阿根廷
- 其他南美國家
- 中東和非洲
- 沙烏地阿拉伯
- 阿拉伯聯合大公國
- 南非
- 埃及
- 其他中東和非洲國家
- 北美洲
第6章 競爭情勢
- 市場集中度
- 策略趨勢(併購、聯盟、購電協議)
- 市場佔有率分析(主要公司的市場排名和佔有率)
- 公司簡介
- Tesla, Inc.
- Siemens AG
- LG Energy Solution
- Fluence Energy, Inc.
- Samsung SDI Co., Ltd.
- General Electric Company
- BYD Company Ltd.
- Hitachi Energy
- Panasonic Holdings Corporation
- Saft Groupe SA
- VARTA AG
- Mitsubishi Power
- NGK Insulators, Ltd.
- ESS Inc.
- EnerSys
- Hydrostor Inc.
- Ambri Inc.
- Invinity Energy Systems
- Energy Vault Holdings, Inc.
- Stryten Energy
- Contemporary Amperex Technology Co. Ltd.(CATL)
- Sungrow Power Supply Co., Ltd.
- EVE Energy Co., Ltd.
- HyperStrong Technology
- CRRC Zhuzhou Institute
第7章 市場機會與未來展望
According to Mordor Intelligence, the advanced energy storage systems market size is expected to increase from USD 20.31 billion in 2025 to USD 22.44 billion in 2026 and reach USD 36.12 billion by 2031, growing at a CAGR of 9.99% over 2026-2031.
This report is Segmented by Type (Electrochemical Storage, Thermal Energy Storage, Mechanical Storage, Others), Application (Grid Storage, Renewable Integration, and More), End-User (Utilities, Commercial and Industrial, and More), and Geography (North America, Europe, Asia-Pacific, South America, and Middle East and Africa). The Market Forecasts are Provided in Terms of Value (USD).
Global Advanced Energy Storage Systems Market Trends and Insights
Rapid Decline in Lithium-Ion Battery USD /kWh
Average lithium-ion pack prices fell to USD 108 per kWh in 2025 and are projected at USD 105 per kWh in 2026, while large utility procurements already secure sub-USD 70 per kWh pricing at the pack level. Cathode shifts toward lithium iron phosphate have removed cobalt exposure and improved cycle life, letting 4-hour projects clear merchant arbitrage markets without subsidies. Scale advantages at CATL's Ningde base produced 69 GWh in 2024, setting a volume benchmark competitors must match. The cost curve is flattening, and future savings hinge on solid-state or sodium-ion breakthroughs that are in the pilot stage. Cell maker, therefore, integrates downstream to secure margin, pressuring pure-play integrators to focus on software value.
Global Clean-Energy Mandates & Storage Procurement Targets
Extension of the U.S. investment tax credit through 2032 combines with state targets such as California's 16.9 GW requirement and New Jersey's 2 GW goal, generating a visible pipeline that derisks finance. Europe's REPowerEU includes Germany's 17.5 GW and the UK's 50 GW ambitions, while China demands storage equal to up to 20% of renewable nameplate capacity. These mandates embed batteries into every new solar and wind business case and push developers to preorder systems 18-24 months ahead, tightening supply chains. IEC 62933 performance standards and ISO 22600 safety protocols are becoming universal bid prerequisites, formalizing quality thresholds.
Critical-Mineral Price & Supply Volatility
Cobalt jumped 240% in 2025 after export quotas in the Democratic Republic of Congo cut shipments, while lithium carbonate swung between USD 12 000 and USD 28 000 per metric ton on Chinese demand uncertainty. Nickel saw the opposite trend as Indonesian output depressed prices, threatening future supply if high-cost mines stay idle. Battery makers respond with lithium iron phosphate adoption, which removes cobalt and nickel risk but introduces phosphate dependencies. Multi-year offtake contracts and upstream joint ventures are now standard, favoring vertically integrated giants that can prepay mines for security of supply.
Other drivers and restraints analyzed in the detailed report include:
- Revenue Stacking in Ancillary-Service Markets
- EV-Scale Manufacturing Lowering Stationary Costs
- Thermal-Run-Away & Fire-Safety Compliance Costs
For complete list of drivers and restraints, kindly check the Table Of Contents.
Segment Analysis
Electrochemical systems held 57.9% of the advanced energy storage systems market share in 2025, supported by lithium iron phosphate cells priced near USD 105 per kWh and life cycles beyond 8 000 cycles. The advanced energy storage systems market size attached to electrochemical chemistries, therefore, scales fastest where a four-hour duration can clear merchant spreads. Flow batteries and sodium-sulfur solutions address 6-10-hour windows, yet high temperature or vanadium costs confine uptake to niches. Over the forecast, incremental cost declines and standardized containers will let electrochemical portfolios expand into critical-peak applications, although long-duration roles increasingly migrate to chemical or mechanical formats.
Chemical pathways grow at a 13.3% CAGR as green hydrogen and synthetic fuels become grid-stability backstops rather than marginal peak shavers. Mitsubishi Power's 317 MW Utah project blends cavern storage with 220 MW of electrolyzers, proving that multiday discharge can reach IRRs competitive with peaking gas. Thermal and mechanical variants, from molten-salt tanks to compressed-air caverns, remain constrained by site geology and permitting but fetch lower USD-per-kWh numbers for eight-hour-plus applications, ensuring a diversified mix within the advanced energy storage systems market.
Geography Analysis
Asia-Pacific captured 46.2% revenue in 2025, underpinned by China's vertically integrated value chain, where CATL, BYD, and EVE Energy collectively surpassed 300 GWh of annual output. Provincial mandates that every renewable plant include 15-20% storage create recurring demand, and mega projects such as Shandong's 3.5 GW installation demonstrate execution at scale. Japan pursues sodium-sulfur for long-duration resilience, and India's PLI scheme funds gigafactories that will feed Southeast Asian pipelines, ensuring the advanced energy storage systems market remains anchored in the region.
North America grows at 14.5% CAGR on the back of Inflation Reduction Act tax credits and domestic content bonuses that tilt procurement toward local manufacturing, including Tesla's 40 GWh Megapack line and LG's Arizona expansion. ERCOT overtook California in yearly additions during 2025 as performance-based ancillary prices reward sub-second response assets. Canada and Mexico follow with policy-backed auctions targeting renewable firming.
Europe's 50 GW UK goal, 17.5 GW German target, and made-in-EU procurement thresholds force developers to balance supply security with 15-20% higher capex linked to local assembly. Nordic pumped hydro provides seasonal balancing, while Eastern Europe eyes lithium storage to stabilize growing solar pipelines. South America readies its first large tenders in Brazil and Argentina, banking on hybrid solar-storage to curb curtailment. The Middle East and Africa accelerate as Saudi Arabia grid-connected 7.8 GWh of batteries in January 2026, setting a regional record
- Tesla, Inc.
- Siemens AG
- LG Energy Solution
- Fluence Energy, Inc.
- Samsung SDI Co., Ltd.
- General Electric Company
- BYD Company Ltd.
- Hitachi Energy
- Panasonic Holdings Corporation
- Saft Groupe S.A.
- VARTA AG
- Mitsubishi Power
- NGK Insulators, Ltd.
- ESS Inc.
- EnerSys
- Hydrostor Inc.
- Ambri Inc.
- Invinity Energy Systems
- Energy Vault Holdings, Inc.
- Stryten Energy
- Contemporary Amperex Technology Co. Ltd. (CATL)
- Sungrow Power Supply Co., Ltd.
- EVE Energy Co., Ltd.
- HyperStrong Technology
- CRRC Zhuzhou Institute
Additional Benefits:
- The market estimate (ME) sheet in Excel format
- 3 months of analyst support
TABLE OF CONTENTS
1 Introduction
- 1.1 Study Assumptions & Market Definition
- 1.2 Scope of the Study
2 Research Methodology
3 Executive Summary
4 Market Landscape
- 4.1 Market Overview
- 4.2 Market Drivers
- 4.2.1 Rapid decline in lithium-ion battery $/kWh
- 4.2.2 Global clean-energy mandates & storage procurement targets
- 4.2.3 Revenue stacking in ancillary-service markets
- 4.2.4 EV-scale manufacturing lowering stationary costs
- 4.2.5 Second-life EV packs opening low-CAPEX markets
- 4.2.6 AI-driven dispatch boosting project IRRs
- 4.3 Market Restraints
- 4.3.1 Critical-mineral price & supply volatility
- 4.3.2 Thermal-run-away & fire-safety compliance costs
- 4.3.3 US/EU trade barriers & local-content mandates
- 4.3.4 Competition from non-battery long-duration storage
- 4.4 Supply-Chain Analysis
- 4.5 Regulatory Landscape
- 4.6 Technological Outlook
- 4.7 Porter's Five Forces
- 4.7.1 Threat of New Entrants
- 4.7.2 Bargaining Power of Buyers
- 4.7.3 Bargaining Power of Suppliers
- 4.7.4 Threat of Substitutes
- 4.7.5 Competitive Rivalry
5 Market Size & Growth Forecasts
- 5.1 By Type
- 5.1.1 Electrochemical Storage
- 5.1.1.1 Lithium-ion Batteries
- 5.1.1.2 Sodium-Sulfur Batteries
- 5.1.1.3 Flow Batteries
- 5.1.1.4 Lead-acid Batteries
- 5.1.1.5 Nickel-based Batteries
- 5.1.2 Thermal Energy Storage
- 5.1.2.1 Sensible Heat
- 5.1.2.2 Latent Heat
- 5.1.2.3 Thermochemical
- 5.1.3 Mechanical Storage
- 5.1.3.1 Pumped Hydro Storage
- 5.1.3.2 Compressed-Air (CAES)
- 5.1.3.3 Flywheel Storage
- 5.1.4 Chemical Storage
- 5.1.4.1 Hydrogen
- 5.1.4.2 Synthetic Natural Gas
- 5.1.4.3 Ammonia
- 5.1.5 Hybrid Storage Systems
- 5.1.1 Electrochemical Storage
- 5.2 By Application
- 5.2.1 Grid Storage
- 5.2.2 Renewable Integration
- 5.2.3 Backup Power Systems
- 5.2.4 Electric-Vehicle Infrastructure
- 5.2.5 Industrial Energy Management
- 5.2.6 Off-grid and Remote Area Storage
- 5.2.7 Residential Storage
- 5.3 By End-user
- 5.3.1 Utilities
- 5.3.2 Commercial and Industrial
- 5.3.3 Residential
- 5.4 By Geography
- 5.4.1 North America
- 5.4.1.1 United States
- 5.4.1.2 Canada
- 5.4.1.3 Mexico
- 5.4.2 Europe
- 5.4.2.1 Germany
- 5.4.2.2 United Kingdom
- 5.4.2.3 France
- 5.4.2.4 Italy
- 5.4.2.5 NORDIC Countries
- 5.4.2.6 Russia
- 5.4.2.7 Rest of Europe
- 5.4.3 Asia-Pacific
- 5.4.3.1 China
- 5.4.3.2 India
- 5.4.3.3 Japan
- 5.4.3.4 South Korea
- 5.4.3.5 ASEAN Countries
- 5.4.3.6 Rest of Asia-Pacific
- 5.4.4 South America
- 5.4.4.1 Brazil
- 5.4.4.2 Argentina
- 5.4.4.3 Rest of South America
- 5.4.5 Middle East and Africa
- 5.4.5.1 Saudi Arabia
- 5.4.5.2 United Arab Emirates
- 5.4.5.3 South Africa
- 5.4.5.4 Egypt
- 5.4.5.5 Rest of Middle East and Africa
- 5.4.1 North America
6 Competitive Landscape
- 6.1 Market Concentration
- 6.2 Strategic Moves (M&A, Partnerships, PPAs)
- 6.3 Market Share Analysis (Market Rank/Share for key companies)
- 6.4 Company Profiles (includes Global level Overview, Market level overview, Core Segments, Financials as available, Strategic Information, Products & Services, and Recent Developments)
- 6.4.1 Tesla, Inc.
- 6.4.2 Siemens AG
- 6.4.3 LG Energy Solution
- 6.4.4 Fluence Energy, Inc.
- 6.4.5 Samsung SDI Co., Ltd.
- 6.4.6 General Electric Company
- 6.4.7 BYD Company Ltd.
- 6.4.8 Hitachi Energy
- 6.4.9 Panasonic Holdings Corporation
- 6.4.10 Saft Groupe S.A.
- 6.4.11 VARTA AG
- 6.4.12 Mitsubishi Power
- 6.4.13 NGK Insulators, Ltd.
- 6.4.14 ESS Inc.
- 6.4.15 EnerSys
- 6.4.16 Hydrostor Inc.
- 6.4.17 Ambri Inc.
- 6.4.18 Invinity Energy Systems
- 6.4.19 Energy Vault Holdings, Inc.
- 6.4.20 Stryten Energy
- 6.4.21 Contemporary Amperex Technology Co. Ltd. (CATL)
- 6.4.22 Sungrow Power Supply Co., Ltd.
- 6.4.23 EVE Energy Co., Ltd.
- 6.4.24 HyperStrong Technology
- 6.4.25 CRRC Zhuzhou Institute
7 Market Opportunities & Future Outlook
- 7.1 White-space & Unmet-Need Assessment
 先進熱能能源儲存系統市場預測至2034年-按儲存材料、安裝類型、技術、應用、最終用戶和地區分類的全球分析先進能源儲存系統市場預測—全球電池類型、功率容量、應用、最終用戶和地區分析—2034年
 下一代儲能市場:按應用、技術和地區分類
 先進能源儲存系統市場:按技術、安裝類型、儲存週期、應用和最終用戶分類-2026-2032年全球市場預測
 2026年全球車家互聯平台市場報告垃圾焚化發電系統市場預測至2034年:按系統類型、組件、技術、廢棄物、最終用戶和地區分類的全球分析
 全球先進儲能市場規模、佔有率、趨勢及成長分析報告(2026-2034年)
 混合能源儲存系統系統市場分析及預測(至2035年):依類型、產品、技術、組件、應用、形式、材料類型、部署方式、最終用戶及功能分類全球電化學能源儲存系統市場規模、佔有率、趨勢和成長分析報告(2026-2034年)全球電力系統保護與控制市場預測至2034年:依產品類型、組件、相配置、故障特性、技術、應用、最終用戶與地區分類