


 |
市場調查報告書
商品編碼
2062476
新一代能源儲存系統:市場佔有率分析、產業趨勢與統計及成長預測(2026-2031)Next-Generation Energy Storage Systems - Market Share Analysis, Industry Trends & Statistics, Growth Forecasts (2026 - 2031) |
||||||
※ 本網頁內容可能與最新版本有所差異。詳細情況請與我們聯繫。
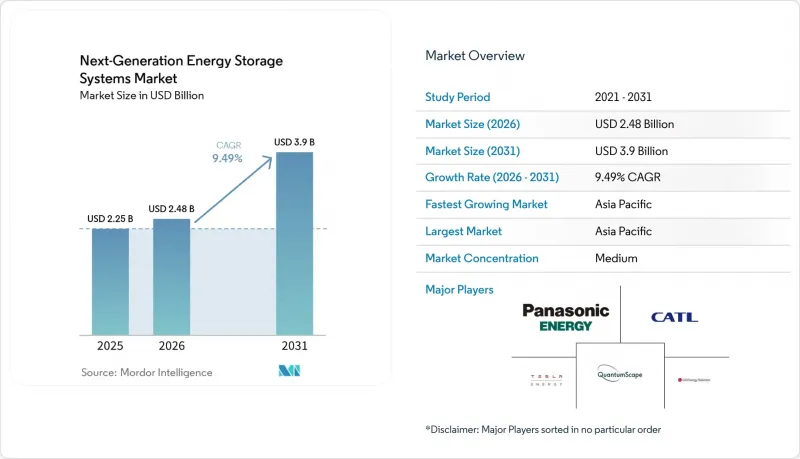
根據 Mordor Intelligence 預測,下一代能源儲存系統的市場規模預計將從 2025 年的 22.5 億美元和 2026 年的 24.8 億美元成長到 2031 年的 39 億美元,2026 年至 2031 年的年複合成長率(CAGR)為 9.49%。
本報告按技術(鋰硫電池、固態固態電池、液流電池、金屬空氣電池、機械儲能及其他先進儲能技術)、應用(系統互連用儲能、家用電子產品等)和地區(北美、歐洲、亞太、南美、中東和非洲)進行細分。市場預測以美元計價。
全球下一代能源儲存系統市場趨勢及洞察
全球汽車製造商正在大幅提高電動車的生產目標。
製造商正在加速高能量密度化學電池的研發。比亞迪將於2027年開始試生產硫化物基固態電池,目標在2030年實現約400Wh/kg的量產,比其「刀鋒電池」平台提升60%。寧德時代正在試生產500Wh/kg的高能量密度電池,預計從2027年開始應用於電動飛機機隊。豐田預計在2027年至2028年間推出一款續航里程達745英里(約1,200公里)、充電僅需10分鐘的全固體電池組。公共資金,例如美國能源局在2024會計年度提供的1,600萬美元津貼,正在降低試生產的風險,並使政策與汽車製造商的藍圖保持一致。總的來說,隨著固態電池克服每千瓦時 100 美元的成本障礙,取代液態電解質鋰離子技術,這些舉措正在加速推進。
強制要求輸電業者並網可再生能源
修訂後的批發市場規則將儲能系統視為容量而非輔助服務。聯邦能源監管委員會(FERC)第841號和第2222號命令規定,區域市場必須允許電池參與電力、容量和輔助服務的競標。紐約州、麻薩諸塞州和新澤西州等州正在加強長期購電協議,目標是到2030年實現13吉瓦的總合部署量。液流電池供應商正抓住這一機遇,ESS Tech公司已從美國空軍獲得一份價值990萬美元的訂單,用於生產27兆瓦時的鐵液流電池組。同時,Form Energy公司已開始建造一座1500兆瓦時的鐵氣電池電站,可連續放電100小時,性能優於僅能持續放電4小時的鋰離子電池系統。隨著美國國家再生能源實驗室(NREL)預測到2035年鋰離子電池系統的成本將達到每千瓦時243美元,隨著運作的增加,兩者之間的成本差距正在縮小。
高能量化學電池的安全性和熱失控風險
一系列備受矚目的召回事件導致保費居高不下。通用汽車、Fisker、賓士和Rivian因擔心電池起火,在2024年總合召回了超過12萬輛電動車。儘管UL 9540A和IEC 62619標準規定了測試程序,但固態電池缺乏大規模的運作經驗,導致保險批准延遲。 NFPA 855安裝標準使每千瓦時電池的保護成本增加了20-30美元,這對早期化學系統而言負擔過重。鋰金屬負極的枝晶生長仍然是一個尚未解決的故障模式,儘管陶瓷隔膜和電解液添加劑在實驗室測試中顯示出良好的效果。在累積更多現場數據之前,買家可能會對未經驗證的化學系統持謹慎態度。
細分市場分析
預計到2025年,固態電池將佔據下一代儲能能源儲存系統市場51.6%的佔有率,並預計在2031年之前以9.9%的複合年成長率成長。這顯示豪華汽車和新興電動飛機計畫對固態電池的需求強勁。一旦成本降至每千瓦時100美元以下,基於固態電池技術的下一代能源儲存系統市場規模預計將迅速擴張。許多分析師預測,這項成本平衡將在2028年實現。 QuantumScape的氧化物電解質透過取消石墨負極,將材料成本降低了四分之一,並提高了體積能量密度。同時,Solid Power的硫化物基技術實現了更高的離子電導率,但需要在無水環境下操作。豐田、三星SDI和LG能源解決方案公司都計劃在2027年至2029年間商業化,預計在技術全面普及之前,市場競爭將非常激烈。
液流電池、鋰硫電池和金屬空氣電池等化學儲能技術各自扮演特定的角色,而非直接競爭。 ESS Tech 的鐵液流電池平台主導著 8-24 小時固定式儲能細分市場,而 Form Energy 的 100 小時持續運作鐵空氣電池系統則開拓了季節性儲能的新領域。鋰硫電池因其 400 Wh/kg 的能量密度而備受青睞,吸引了航太領域的注意。例如,空中巴士公司正與 Sion Power 合作開發示範電池。鋅空氣電池供應商,如 Zinc8,正致力於為農村微電網提供低循環次數的系統。 Energy Vault 的機械重力儲能系統則瞄準了土地成本低廉市場的超長期儲能需求。整體而言,即使固體儲能引領大規模生產,這些替代技術仍將維持下一代能源儲存系統市場的技術多樣性。
區域分析
到2025年,亞太地區將佔全球銷售額的45.1%,支撐下一代能源儲存系統市場近一半的規模。該地區預計將以10.1%的複合年成長率成長,主要得益於中國將於2026年7月實施的固態電池標準、韓國400億美元的「K-Battery」舉措以及日本持續部署4,680電池。寧德時代和比亞迪預計到2030年,其產能將超過1.2太瓦時,其中凝聚態電池和硫化物化學電池的試點生產線預計在2027年投入量產。總部位於首爾的LG能源解決方案公司和三星SDI公司正結合亞洲的規模優勢以及在歐洲和美國的夥伴關係關係,在中國的主導地位和美國的政策獎勵之間建立供應鏈。
北美市佔率正在擴大,這主要得益於《通膨控制法案》第45X條的規定。該條款為美國本土電池生產提供每千瓦時35美元的補貼,並為工廠提供30%的投資稅額扣抵。 LG能源解決方案公司投資55億美元的亞利桑那州工廠和Panasonic在堪薩斯州的擴建計畫都已宣布,到2026年,兩家公司的合計產能將超過57吉瓦時。此外,福特/SK和特斯拉預計也將增加吉瓦時的產能。聯邦能源市場法規,即第841號、第2222號和第901號行政命令,統一了電池行業的准入要求,並根據各州的目標設定了到2030年13吉瓦的最低需求量。這為開發商提供了清晰的未來前景,使其能夠將目光投向汽車行業以外的領域。
在歐洲,企業營運面臨日益嚴格的法規結構,該框架獎勵回收企業,懲罰高碳供應鏈。強制性的碳足跡標籤和「電池法規」下的材料回收標準推高了合規成本,並有利於垂直整合的製造商。 Northvolt在2024年的重組凸顯了其資金籌措困境,但其位於埃特的工廠仍計劃實現60吉瓦時的年產能。汽車電池公司(Automotive Cells Company)正力爭2030年建成三座總產能總合120吉瓦時的超級工廠,而英國法拉第研究所則在資助固態電池和鈉離子電池的研發。此外,鋰資源豐富的南美洲計劃在2020年代中期開始提煉鋰,中東的開發商正在探索在沙漠地區為可再生能源提供長期儲能,儘管供應要到2026年才能真正實現。
其他好處:
- Excel格式的市場預測(ME)表
- 3個月的分析師支持
目錄
第1章:引言
- 研究假設和市場定義
- 調查範圍
第2章:調查方法
第3章執行摘要
第4章 市場狀況
- 市場概覽
- 市場促進因素
- 全球汽車製造商正在大幅提高電動車的生產目標。
- 電網營運商引入可再生能源的義務
- 固態電池和液流電池每度電成本快速下降
- 國防領域對無人系統高能量電池的需求
- 獎勵循環經濟以回收基本材料
- 市場限制因素
- 高能量化學中的安全和熱失控風險
- 關鍵金屬供應鏈的波動性
- 固體電解質生產規模化面臨的挑戰
- 關於新化學物質廢棄物管理的不確定性
- 供應鏈分析
- 監理情勢
- 技術展望
- 波特五力模型
- 投資和資金籌措趨勢
第5章 市場規模與成長預測
- 透過技術
- 鋰硫電池
- 全固態電池
- 液流電池
- 金屬空氣電池
- 機械及其他先進存儲
- 透過使用
- 網格儲存
- 家用電子產品
- 工業和商業移動性
- 船/飛機
- 其他
- 按地區
- 北美洲
- 美國
- 加拿大
- 墨西哥
- 歐洲
- 英國
- 德國
- 法國
- 西班牙
- 北歐國家
- 俄羅斯
- 其他歐洲國家
- 亞太地區
- 中國
- 印度
- 日本
- 韓國
- 東南亞國協
- 澳洲和紐西蘭
- 其他亞太國家
- 南美洲
- 巴西
- 阿根廷
- 哥倫比亞
- 其他南美國家
- 中東和非洲
- 阿拉伯聯合大公國
- 沙烏地阿拉伯
- 南非
- 埃及
- 其他中東和非洲國家
- 北美洲
第6章 競爭情勢
- 市場集中度
- 策略趨勢(併購、聯盟、購電協議)
- 市場佔有率分析(主要公司的市場排名和市場佔有率)
- 公司簡介
- Contemporary Amperex Technology Co. Ltd.(CATL)
- LG Energy Solution Ltd.
- Tesla, Inc.
- Panasonic Energy Co.
- Samsung SDI Co.
- BYD Co. Ltd.
- QuantumScape Corporation
- Solid Power, Inc.
- Sion Power Corporation
- Ambri Inc.
- Energy Vault Holdings, Inc.
- Form Energy, Inc.
- ESS Tech, Inc.
- Redflow Ltd.
- Blue Solutions SA
- Nexeon Ltd.
- Zinc8 Energy Solutions Inc.
- NantEnergy Inc.
- 24M Technologies, Inc.
- Northvolt AB
第7章 市場機會與未來展望
According to Mordor Intelligence, the next-generation energy storage systems market size is projected to expand from USD 2.25 billion in 2025 and USD 2.48 billion in 2026 to USD 3.9 billion by 2031, registering a CAGR of 9.49% between 2026 and 2031.
This report is Segmented by Technology (Lithium-Sulfur Batteries, Solid-State Batteries, Flow Batteries, Metal-Air Batteries, Mechanical and Other Advanced Storage), Application (Grid Storage, Consumer Electronics, and More), and Geography (North America, Europe, Asia-Pacific, South America, Middle East and Africa). Market Forecasts are Provided in Terms of Value (USD).
Global Next-Generation Energy Storage Systems Market Trends and Insights
Surging EV Production Targets by Global Automakers
Manufacturers are compressing development cycles for high-energy chemistries. BYD plans sulfide-based solid-state pilot output in 2027 and mass output by 2030 at roughly 400 Wh/kg, a 60% uplift on its Blade Battery platform. CATL is piloting 500 Wh/kg condensed batteries that could debut in electric aircraft fleets starting in 2027. Toyota maintains a 2027-2028 launch window for a 745-mile solid-state pack promising 10-minute charging. Supportive public funding, such as the U.S. Department of Energy's USD 16 million 2024 grant round, lowers pilot-line risk and aligns policy with automaker roadmaps. Collectively, these moves advance the timeline by which solid-state cells must cross the USD 100 per kWh cost threshold to displace liquid-electrolyte lithium-ion technology.
Renewable-Integration Mandates for Grid Operators
Re-written wholesale-market rules now treat storage as capacity, not an ancillary service. FERC Orders 841 and 2222 require regional markets to let batteries bid into energy, capacity, and ancillary-service auctions. States such as New York, Massachusetts, and New Jersey together target 13 GW of deployments by 2030, reinforcing long-duration purchase agreements. Flow-battery suppliers have exploited the opening: ESS Tech secured a USD 9.9 million U.S. Air Force award for 27 MWh iron-flow units, while Form Energy broke ground on a 1,500 MWh iron-air plant that can discharge for 100 hours, capabilities beyond four-hour lithium-ion systems. With NREL projecting lithium-ion system costs at USD 243 per kWh by 2035, the cost gap narrows as duration lengthens.
Safety & Thermal-Runaway Risks in High-Energy Chemistries
High-profile recalls keep insurance premiums elevated. General Motors, Fisker, Mercedes-Benz, and Rivian collectively recalled more than 120,000 EVs in 2024 over battery-fire concerns. UL 9540A and IEC 62619 standards provide test pathways, but solid-state cells lack large-sample operating histories, delaying underwriting approvals. NFPA 855 installation codes add USD 20-30 per kWh in protection costs that early-stage chemistries can ill afford. Dendrite growth in lithium-metal anodes remains an unresolved failure mode, although ceramic separators and electrolyte additives show promise in lab trials. Until field data accumulate, buyers will discount unproven chemistries.
Other drivers and restraints analyzed in the detailed report include:
- Rapid USD/kWh Cost Decline in Solid-State & Flow Chemistries
- Defense Demand for High-Energy Batteries for Unmanned Systems
- Critical-Metal Supply-Chain Volatility
For complete list of drivers and restraints, kindly check the Table Of Contents.
Segment Analysis
Solid-state batteries represented 51.6% of the next-generation energy storage systems market share in 2025 and are forecast to post a 9.9% CAGR through 2031, highlighting their pull from premium automotive and emerging electric-aviation programs. The next-generation energy storage systems market size attached to solid-state chemistry is poised to expand rapidly once costs fall below USD 100 per kWh, a parity point most analysts peg for 2028. QuantumScape's oxide electrolyte, which eliminates the graphite anode, trims material cost by a quarter and improves volumetric density, while Solid Power's sulfide pathway delivers higher ionic conductivity but demands moisture-free handling. Toyota, Samsung SDI, and LG Energy Solution all target commercial releases between 2027 and 2029, ensuring a crowded field long before the technology reaches scale.
Flow, lithium-sulfur, and metal-air chemistries occupy specialist roles rather than direct competition. ESS Tech's iron-flow platform commands the 8-24-hour stationary niche, and Form Energy's 100-hour iron-air system is opening a seasonal-shift frontier. Lithium-sulfur, valued for its 400 Wh/kg density, draws aerospace interest; Airbus, for instance, collaborates with Sion Power on demonstration cells. Zinc-air suppliers such as Zinc8 position their low-cycle systems for rural micro-grids. Mechanical gravity storage from Energy Vault targets ultra-long durations in markets with cheap land. Collectively, these alternatives ensure the next-generation energy storage systems market remains technology-diverse even as solid-state leads volumes.
Geography Analysis
Asia-Pacific, holding 45.1% of the 2025 turnover, underpins almost half the next-generation energy storage systems market size. The region should grow at 10.1% CAGR thanks to China's July 2026 solid-state battery standard, South Korea's USD 40 billion K-Battery initiative, and Japan's continued 4680 roll-outs. CATL and BYD together forecast more than 1.2 TWh of capacity by 2030, and combined pilot lines for condensed and sulfide chemistries could enter series production by 2027. Seoul-based LG Energy Solution and Samsung SDI bridge Asian scale with Western partnerships, anchoring supply between Chinese dominance and U.S. policy incentives.
North America's share expands on the back of the Inflation Reduction Act's Section 45X, which rebates USD 35 per kWh for domestic cell output plus 30% investment tax credits for factories. LG Energy Solution's USD 5.5 billion Arizona complex and Panasonic's Kansas expansion together exceed 57 GWh of announced capacity slated for 2026, while Ford/SK and Tesla add further gigawatt-hour volumes. Federal energy-market rules, Orders 841, 2222, and 901, harmonize battery participation, and state targets create a 13 GW demand floor through 2030, ensuring visibility for developers beyond automotive offtake.
Europe operates within a tightening regulatory frame that rewards recyclers and penalizes high-carbon supply chains. The Battery Regulation's carbon-footprint labeling and material-recovery thresholds raise compliance costs that favor vertically integrated producers. Northvolt's 2024 restructuring highlighted financing hurdles, but its Ett plant still aims for 60 GWh of annual capacity. Automotive Cells Company advances three gigafactories totaling 120 GWh by 2030, while the U.K.'s Faraday Institution funds solid-state and sodium-ion R&D. Elsewhere, lithium-rich South America eyes mid-decade refining, and Middle East developers weigh long-duration storage for desert renewables, but volumes remain embryonic through 2026.
- Contemporary Amperex Technology Co. Ltd. (CATL)
- LG Energy Solution Ltd.
- Tesla, Inc.
- Panasonic Energy Co.
- Samsung SDI Co.
- BYD Co. Ltd.
- QuantumScape Corporation
- Solid Power, Inc.
- Sion Power Corporation
- Ambri Inc.
- Energy Vault Holdings, Inc.
- Form Energy, Inc.
- ESS Tech, Inc.
- Redflow Ltd.
- Blue Solutions SA
- Nexeon Ltd.
- Zinc8 Energy Solutions Inc.
- NantEnergy Inc.
- 24M Technologies, Inc.
- Northvolt AB
Additional Benefits:
- The market estimate (ME) sheet in Excel format
- 3 months of analyst support
TABLE OF CONTENTS
1 Introduction
- 1.1 Study Assumptions & Market Definition
- 1.2 Scope of the Study
2 Research Methodology
3 Executive Summary
4 Market Landscape
- 4.1 Market Overview
- 4.2 Market Drivers
- 4.2.1 Surging EV production targets by global automakers
- 4.2.2 Renewable-integration mandates for grid operators
- 4.2.3 Rapid $/kWh cost decline in solid-state & flow chemistries
- 4.2.4 Defense demand for high-energy batteries for unmanned systems
- 4.2.5 Circular-economy incentives for critical-material recovery
- 4.3 Market Restraints
- 4.3.1 Safety & thermal-runaway risks in high-energy chemistries
- 4.3.2 Critical-metal supply-chain volatility
- 4.3.3 Manufacturing scale-up hurdles for solid electrolytes
- 4.3.4 End-of-life stewardship uncertainty for novel chemistries
- 4.4 Supply-Chain Analysis
- 4.5 Regulatory Landscape
- 4.6 Technological Outlook
- 4.7 Porter's Five Forces
- 4.7.1 Threat of New Entrants
- 4.7.2 Bargaining Power of Suppliers
- 4.7.3 Bargaining Power of Buyers
- 4.7.4 Threat of Substitutes
- 4.7.5 Competitive Rivalry
- 4.8 Investment & Funding Landscape
5 Market Size & Growth Forecasts
- 5.1 By Technology
- 5.1.1 Lithium-Sulfur Batteries
- 5.1.2 Solid-State Batteries
- 5.1.3 Flow Batteries
- 5.1.4 Metal-Air Batteries
- 5.1.5 Mechanical and Other Advanced Storage
- 5.2 By Application
- 5.2.1 Grid Storage
- 5.2.2 Consumer Electronics
- 5.2.3 Industrial and Commercial Mobility
- 5.2.4 Marine and Aviation
- 5.2.5 Others
- 5.3 By Geography
- 5.3.1 North America
- 5.3.1.1 United States
- 5.3.1.2 Canada
- 5.3.1.3 Mexico
- 5.3.2 Europe
- 5.3.2.1 United Kingdom
- 5.3.2.2 Germany
- 5.3.2.3 France
- 5.3.2.4 Spain
- 5.3.2.5 Nordic Countries
- 5.3.2.6 Russia
- 5.3.2.7 Rest of Europe
- 5.3.3 Asia-Pacific
- 5.3.3.1 China
- 5.3.3.2 India
- 5.3.3.3 Japan
- 5.3.3.4 South Korea
- 5.3.3.5 ASEAN Countries
- 5.3.3.6 Australia and New Zealand
- 5.3.3.7 Rest of Asia-Pacific
- 5.3.4 South America
- 5.3.4.1 Brazil
- 5.3.4.2 Argentina
- 5.3.4.3 Colombia
- 5.3.4.4 Rest of South America
- 5.3.5 Middle East and Africa
- 5.3.5.1 United Arab Emirates
- 5.3.5.2 Saudi Arabia
- 5.3.5.3 South Africa
- 5.3.5.4 Egypt
- 5.3.5.5 Rest of Middle East and Africa
- 5.3.1 North America
6 Competitive Landscape
- 6.1 Market Concentration
- 6.2 Strategic Moves (M&A, Partnerships, PPAs)
- 6.3 Market Share Analysis (Market Rank/Share for key companies)
- 6.4 Company Profiles (includes Global level Overview, Market level overview, Core Segments, Financials as available, Strategic Information, Products & Services, and Recent Developments)
- 6.4.1 Contemporary Amperex Technology Co. Ltd. (CATL)
- 6.4.2 LG Energy Solution Ltd.
- 6.4.3 Tesla, Inc.
- 6.4.4 Panasonic Energy Co.
- 6.4.5 Samsung SDI Co.
- 6.4.6 BYD Co. Ltd.
- 6.4.7 QuantumScape Corporation
- 6.4.8 Solid Power, Inc.
- 6.4.9 Sion Power Corporation
- 6.4.10 Ambri Inc.
- 6.4.11 Energy Vault Holdings, Inc.
- 6.4.12 Form Energy, Inc.
- 6.4.13 ESS Tech, Inc.
- 6.4.14 Redflow Ltd.
- 6.4.15 Blue Solutions SA
- 6.4.16 Nexeon Ltd.
- 6.4.17 Zinc8 Energy Solutions Inc.
- 6.4.18 NantEnergy Inc.
- 6.4.19 24M Technologies, Inc.
- 6.4.20 Northvolt AB
7 Market Opportunities & Future Outlook
- 7.1 White-space & Unmet-Need Assessment
 先進能源儲存系統:市場佔有率分析、產業趨勢與統計及成長預測(2026-2031)
 先進熱能能源儲存系統市場預測至2034年-按儲存材料、安裝類型、技術、應用、最終用戶和地區分類的全球分析先進能源儲存系統市場預測—全球電池類型、功率容量、應用、最終用戶和地區分析—2034年
 下一代儲能市場:按應用、技術和地區分類
 先進能源儲存系統市場:按技術、安裝類型、儲存週期、應用和最終用戶分類-2026-2032年全球市場預測
 2026年全球車家互聯平台市場報告垃圾焚化發電系統市場預測至2034年:按系統類型、組件、技術、廢棄物、最終用戶和地區分類的全球分析
 全球先進儲能市場規模、佔有率、趨勢及成長分析報告(2026-2034年)
 混合能源儲存系統系統市場分析及預測(至2035年):依類型、產品、技術、組件、應用、形式、材料類型、部署方式、最終用戶及功能分類全球電化學能源儲存系統市場規模、佔有率、趨勢和成長分析報告(2026-2034年)