

 |
市場調查報告書
商品編碼
2063240
微電網儲能電池:市場佔有率分析、產業趨勢與統計及成長預測(2026-2031)Energy Storage Battery For Microgrids - Market Share Analysis, Industry Trends & Statistics, Growth Forecasts (2026 - 2031) |
||||||
※ 本網頁內容可能與最新版本有所差異。詳細情況請與我們聯繫。
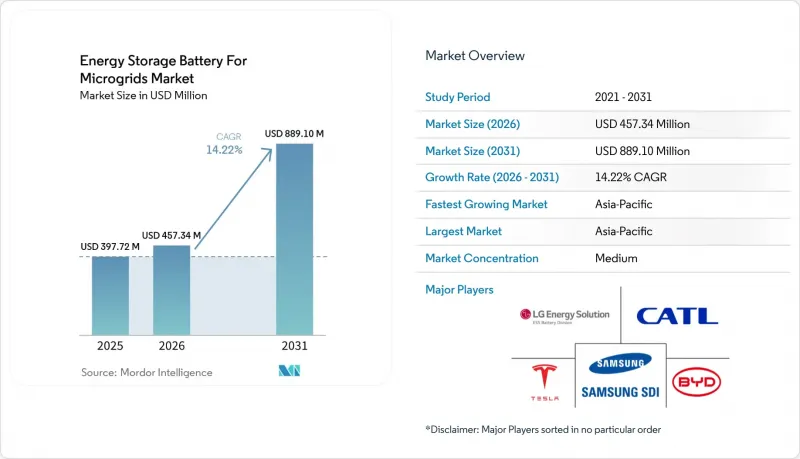
據 Mordor Intelligence 稱,2025 年微電網儲能電池的市場規模為 3.9772 億美元,預計到 2031 年將從 2026 年的 4.5734 億美元成長至 8.891 億美元,預測期(2026-2031 年)的複合年成長率為 14.2%。
本報告按電池化學成分(鋰離子電池、鉛酸電池、液流電池等)、額定功率(小於100千瓦、100-500千瓦、大於500千瓦)、微電網類型(遠程/獨立式、併網式、混合式)、最終用戶(住宅等)和地區(北美、歐洲、亞太地區、南美、中東和非洲)進行細分。市場預測以美元計價。
微電網儲能電池市場趨勢及洞察
降低鋰離子電池組的成本
受中國磷酸鐵鋰電池(LFP)產量激增的推動,到2025年,固定式儲能電池組的價格將降至每千瓦時70美元。這使得專案投資回收期從八年縮短至五年,並加快了電力公司的採購速度。成本降低近一半歸功於以無鈷的LFP取代了富鈷的NMC正極材料,這也簡化了回收流程。彭博新能源財經(BloombergNEF)預計,隨著電池工廠投資趨於穩定,原料物流規模達到極限,到2028年,價格下降速度預計將放緩至每千瓦時約60美元。開發商正透過對沖現貨價格波動風險和簽訂多年合約來應對這項挑戰,以便在競爭性競標中提供更具競爭力的競標。電池組價格的下降將透過擴大符合內部報酬率(IRR)標準的專案範圍,直接推動微電網儲能電池市場的發展。
擴大對微電網的獎勵並改革定價結構
美國《通膨控制法案》為個人儲能系統提供30%的稅額扣抵,預計到2025年,這將推動18個州新增價值21億美元的新計畫。加州和紐約州也推出了基於績效的定價方案,獎勵微電網提供的電網服務,而非按千瓦時供電計費。印度對農村微電網提供60%的資本補貼,預計2025年中期,其在建容量將增加1.2吉瓦。夏威夷州和加州調整了收費系統,將輸電補貼減少了40%至75%,鼓勵了自用,並提高了住宅的電網接取率。這些措施將共同降低軟成本風險,規範電網連接,並將微電網儲能電池市場的基準複合年成長率提高2.8%。
關鍵礦產供應鏈的波動
預計2025年碳酸鋰現貨價格將波動50%,1月將達到每噸18,500美元的峰值,隨後在12月份跌至每噸9,200美元。這迫使電池製造商重新談判合約,並導致北美和歐洲計劃建造的8吉瓦時微電網容量專案延長。剛果民主共和國禁止小規模採礦,導致全球鈷供應量減少12%,硫酸鈷價格飆漲40%。這給傳統的鎳基複合材料(NMC)系統帶來了額外的預算外成本。印尼收緊了鎳礦出口限制,將高鎳正極材料的採購週期延長了至多9個月,使尚未整合提煉的供應商處於不利地位。五氧化二釩的價格在每公斤8美元至14美元之間波動,導致液流電池供應商無法獲得許多電力公司目前尋求的25年固定價格競標。國際能源總署 (IEA) 預測,到 2028 年,鋰精煉將出現 15% 的缺口,這可能導致材料轉向電動車,並使微電網儲能電池市場的年成長率降低 2.1%。
細分市場分析
到2025年,憑藉成熟的供應鏈和高功率性能,鋰離子電池技術將佔據微電網儲能電池市場73.4%的佔有率。然而,鈉基電池預計到2031年將以31.9%的複合年成長率成長,成為所有儲能方案中成長最快的選擇。寧德時代(CATL)的鈉離子電池定價為每千瓦時50美元,消除了鈷和鎳相關的風險,從而可以將節省的成本用於整體系統升級。在日本,鈉硫電池系統能夠滿足獨立電網6小時的放電需求,填補了主流鋰電池產品無法涵蓋的持續時間空白。液流電池在市場中佔據著獨特的地位,它能夠提供長期儲能,並在超過25年的運作內保持穩定的性能,同時最大限度地減少容量劣化。
由於鉛酸電池維護簡單、易於維修,因此在50kW以下的本地微電網專案中仍廣泛應用。然而,其較短的使用壽命限制了其更廣泛的長期應用。鈦酸鋰電池目前主要用於特殊交通運輸和軍事領域,在這些領域,超長壽命和高耐久性比能量密度更為重要。隨著微電網部署擴展到更廣泛的應用場景和運行條件,預計到2031年,各種替代電池化學系統將穩步發展。因此,競爭優勢將越來越取決於電池化學系統如何適應特定的應用需求,而不是依賴單一的主導技術。擁有多元化化學成分產品的製造商更有能力應對不斷變化且分散的需求趨勢。
預計到2025年,容量超過500千瓦的系統將佔微電網儲能電池市場規模的55.1%,並在電力公司採購的推動下,以15.2%的複合年成長率成長至2031年,例如亞利桑那州2.2吉瓦時的Copia安裝項目。容量在100至500千瓦範圍內的配置佔總部署量的28%,主要滿足醫院、資料中心和輕工業等需要2至3小時備用電源且資本支出可控的場所的需求。
高昂的系統外成本 (BOS) 仍阻礙著 100kW 以下規模的電力系統在遍遠地區的部署,但Schneider Electric的貨櫃式套件可將安裝時間縮短 80%,並最大限度地降低額外的 BOS 成本。 IEEE 1547-2024 標準將進一步加快 100-500kW 規模專案的核准速度,將併網等待名單縮短一半,從而縮短資本週期。由於收入成長、容量支付和頻率響應降低了利潤風險,來自電力公司的訂單仍然強勁。然而,由於依賴捐助資金和優惠融資,小規模專案的規模擴張速度有所放緩。提供標準化硬體和遠端監控功能的供應商預計將抓住這項尚未充分滿足的市場需求。
區域分析
預計到2025年,北美將佔總收入的34.7% 。稅額扣抵%。為應對天氣相關的停電,德克薩斯州和加州已宣布啟動兩個裝置容量均超過1吉瓦的新計畫。加拿大80兆瓦的奧奈達發電廠是本土能源主權和電網業務收益的典範。
亞太地區預計將成為成長最快的儲能市場,預測期內複合年成長率將達到19.5%。這項成長主要得益於強而有力的政策支持、工業脫碳措施以及電網現代化舉措。在印度,政府對電池儲能專案提供60%的資本補貼,加速了約1.2吉瓦在建專案的開發,擴大了公用事業規模和分散式應用領域的部署。在中國,新建工業園區對現場微電網的需求預計將帶來3吉瓦的新增儲能需求。日本正致力於發展鈉硫(NaS)電池系統,以提高能源安全性和韌性,尤其是在離島和易受災害影響的地區。在澳大利亞,500兆瓦的Tomago能源中心計畫凸顯了能源密集產業對大規模儲能解決方案的日益重視,進一步鞏固了該地區在先進儲能部署和電網柔軟性的地位。
在歐洲,德國美因茨能源園區的氫燃料電池混合動力系統展示了每日供需調整的可行性,但平均長達38個月的核准等待期阻礙了市場擴張。北歐國家正為偏遠村莊和資料中心部署微電網,而西班牙和義大利則正苦於應對過時的電網法規。南美洲、中東和非洲在礦區和太陽能園區看到了成長機遇,因為在這些地區擴建電網在經濟上並不划算。
其他好處:
- Excel格式的市場預測(ME)表
- 3個月的分析師支持
目錄
第1章:引言
- 研究假設和市場定義
- 調查範圍
第2章:調查方法
第3章執行摘要
第4章 市場狀況
- 市場概覽
- 市場促進因素
- 降低鋰離子電池組的成本
- 增加對微電網的獎勵並改革其定價結構
- 極端天氣地區對能源韌性的需求日益成長
- LFP細胞劣化速率迅速下降
- 實現標準化的開放原始碼微電網控制器
- 新興的綠色氫能混合微電網
- 市場限制因素
- 關鍵礦產供應鏈的波動性
- 對消防安全和熱失控的擔憂
- 100kW以下本地系統中系統平衡(BOS)成本較高
- 傳統併網規則下的許可核准流程有延誤
- 供應鏈分析
- 監理情勢
- 技術展望
- 波特五力分析
第5章 市場規模與成長預測
- 按電池化學成分
- 鋰離子電池(NMC、LFP、LTO)
- 鉛酸蓄電池(閥控式鉛酸蓄電池,液態)
- 流動型(釩、鋅、鐵等)
- 鈉基(Na離子,NaS)
- 其他化學化合物(NiCd、Zn-Br 等)
- 按類型分類的額定輸出
- 小於100千瓦
- 100~500 kW
- 超過500千瓦
- 微電網類型
- 偏遠/孤立
- 並網型
- 混合動力(太陽能、柴油、儲能等)
- 最終用戶
- 住宅
- 商業和工業用途
- 公用事業
- 按地區
- 北美洲
- 美國
- 加拿大
- 墨西哥
- 歐洲
- 英國
- 德國
- 法國
- 西班牙
- 北歐國家
- 俄羅斯
- 其他歐洲國家
- 亞太地區
- 中國
- 印度
- 日本
- 韓國
- 東南亞國協
- 澳洲和紐西蘭
- 其他亞太國家
- 南美洲
- 巴西
- 阿根廷
- 哥倫比亞
- 其他南美國家
- 中東和非洲
- 阿拉伯聯合大公國
- 沙烏地阿拉伯
- 南非
- 埃及
- 其他中東和非洲國家
- 北美洲
第6章 競爭情勢
- 市場集中度
- 策略趨勢(併購、聯盟、購電協議)
- 市場佔有率分析(主要公司的市場排名和佔有率)
- 公司簡介
- Tesla
- LG Energy Solution
- BYD
- Samsung SDI
- CATL
- Panasonic Energy
- Saft(TotalEnergies)
- Fluence Energy
- EnerSys
- Eos Energy Enterprises
- ESS Tech
- Kokam
- VARTA AG
- Leclanche
- Powin Energy
- NEC Energy Solutions
- NGK Insulators
- ZincFive
- Pylontech
- Primus Power
第7章 市場機會與未來展望
According to Mordor Intelligence, the energy storage battery for microgrids market size was valued at USD 397.72 million in 2025 and is estimated to grow from USD 457.34 million in 2026 to reach USD 889.10 million by 2031, at a CAGR of 14.22% during the forecast period (2026-2031).
This report is Segmented by Battery Chemistry (Lithium-Ion, Lead-Acid, Flow, and More), Power Rating (Below 100 KW, 100 To 500 KW, Above 500 KW), Microgrid Type (Remote/Islanded, Grid-Connected, Hybrid), End-User (Residential, and More), and Geography (North America, Europe, Asia-Pacific, South America, Middle East and Africa). The Market Forecasts are Provided in Terms of Value (USD).
Global Energy Storage Battery For Microgrids Market Trends and Insights
Falling Lithium-Ion Battery Pack Costs
Stationary storage pack prices dropped to USD 70 per kWh in 2025 after a surge in Chinese LFP output, compressing project paybacks from eight to five years and accelerating utility procurements. Nearly half of the cost decline stems from the substitution of cobalt-rich NMC cathodes with cobalt-free LFP, which also simplifies recycling. BloombergNEF estimates show price reductions moderating toward USD 60 per kWh by 2028 as cell-plant capex plateaus and raw-material logistics hit scale limits. Developers are responding with multi-year offtake contracts that hedge spot volatility and underwrite more aggressive bid prices in competitive tenders. Lower pack prices directly boost the Energy Storage Battery for Microgrids market by expanding the addressable base of projects that clear internal hurdle rates.
Rising Microgrid-Specific Incentives & Tariff Reforms
The United States' Inflation Reduction Act provides a 30% standalone storage tax credit, unlocking USD 2.1 billion in new projects across 18 states in 2025. California and New York layered performance-based tariffs on top, paying microgrids for grid services rather than kilowatt-hour throughput. India's 60% capital subsidy for rural microgrids spurred 1.2 GW of pipeline capacity by mid-2025. Tariff shifts in Hawaii and California reduced export credits by 40-75%, incentivizing self-consumption and lifting residential attachment rates. Collectively, these measures shave soft-cost risk, standardize interconnection, and add 2.8 % to the baseline CAGR for the Energy Storage Battery for Microgrids market.
Critical-Mineral Supply-Chain Volatility
Lithium carbonate spot prices swung 50% during 2025, peaking at USD 18,500 per metric ton in January before sliding to USD 9,200 by December, which forced battery makers to reopen contracts and delayed 8 GWh of planned microgrid capacity in North America and Europe. The Democratic Republic of Congo's artisanal-mining ban cut global cobalt supply by 12% and drove a 40% price jump for cobalt sulfate, adding unbudgeted augmentation costs for legacy NMC systems. Indonesia tightened nickel-ore export restrictions, stretching procurement cycles for high-nickel cathodes by up to nine months and disadvantaging suppliers without integrated refining. Vanadium pentoxide prices ranged between USD 8 and USD 14 per kilogram, preventing flow-battery vendors from locking in 25-year fixed-price bids that many utilities now demand. The International Energy Agency projects a 15% lithium-refining deficit by 2028, which could redirect material toward electric vehicles and compress Energy Storage Battery for Microgrids market growth by 2.1 % each year .
Other drivers and restraints analyzed in the detailed report include:
- Rapid Decline in LFP Cell Degradation Rates
- Open-Source Microgrid Controllers Enabling Standardisation
- Fire-Safety and Thermal-Runaway Concerns
For complete list of drivers and restraints, kindly check the Table Of Contents.
Segment Analysis
Lithium-ion technologies controlled 73.4% of the Energy Storage Battery for Microgrids market share in 2025, underpinned by proven supply chains and high-power capability. Sodium chemistries, however, are set to expand at 31.9% CAGR through 2031, the fastest pace among all options. CATL's USD 50 per kWh sodium-ion cells remove cobalt and nickel risk, redirecting cost savings toward balance-of-system upgrades. In Japan, sodium-sulfur systems meet 6-hour discharge needs within island grids, bridging the duration gap left by mainstream lithium products. Flow batteries occupy a niche in the market, offering long-duration energy storage with consistent performance over operating lifetimes exceeding 25 years and minimal capacity degradation.
Lead-acid batteries continue to support sub-50 kW rural microgrid projects due to their widespread familiarity in servicing and ease of repair. However, their shorter lifecycle performance limits their broader long-term adoption. Lithium titanate batteries remain primarily utilized in specialized transit and military applications, where ultra-long cycle life and high durability are prioritized over energy density. Alternative battery chemistries are expected to see steady adoption through 2031 as microgrid deployments expand across various use cases and operating conditions. Consequently, competitive positioning increasingly relies on aligning battery chemistry with specific application requirements rather than depending on a single dominant technology. Manufacturers with diversified chemistry portfolios are better equipped to address the evolving and fragmented demand landscape.
Systems above 500 kW held 55.1% of Energy Storage Battery for Microgrids market size in 2025 and exhibit a 15.2% CAGR through 2031, buoyed by utility procurements such as the 2.2 GWh Arizona Copia installation . Configurations in the 100-500 kW range constitute 28% of deployments, serving hospitals, data centers, and light-industrial loads that need two-to-three-hour back-up at manageable capex.
High balance-of-system costs still impede rural sub-100 kW roll-outs, although containerized kits from Schneider Electric cut installation time by 80% and shrink BOS premiums. IEEE 1547-2024 further accelerates 100-500 kW approvals by halving interconnection queues, pulling capital cycles forward. Utility-scale orders remain sticky because revenue stacking capacity payments, frequency response buffers margin risk. Conversely, small projects rely on donor finance and concessional loans, slowing scale. Suppliers that package standardized hardware plus remote monitoring stand to capture this underserved volume market.
Geography Analysis
North America held 34.7% of 2025 revenue. ERCOT's energy-only market and federal tax credits sustain a 13.8% regional CAGR despite growing interconnection backlogs. Texas and California each announced more than 1 GW of new projects after weather-driven outages. Canada's 80 MW Oneida installation exemplifies indigenous energy sovereignty plus grid-service monetization.
The Asia-Pacific region is expected to be the fastest-growing energy storage market, with a projected CAGR of 19.5% during the forecast period. This growth is driven by strong policy support, industrial decarbonization efforts, and grid modernization initiatives. In India, a 60% capital subsidy for battery energy storage projects has facilitated the development of approximately 1.2 GW of pipeline capacity, boosting deployment in both utility-scale and distributed applications. In China, the requirement for on-site microgrids in newly developed industrial parks has created an estimated 3 GW of additional energy storage demand. Japan is focusing on sodium-sulfur (NaS) battery systems to improve energy security and resilience, particularly for remote islands and disaster-prone areas. In Australia, the 500 MW Tomago Energy Hub project underscores the growing adoption of large-scale energy storage solutions by energy-intensive industries, further solidifying the region's position in advanced storage deployment and grid flexibility.
In Europe, Germany's hydrogen-battery hybrid at Energiepark Mainz validates multi-day balancing, yet permitting queues averaging 38 months suppresses market velocity. Nordic nations deploy microgrids for remote villages and data centers, whereas Spain and Italy struggle with legacy grid codes. South America, the Middle East, and Africa add opportunistic growth via mining corridors and solar campuses where grid extension is uneconomic.
- Tesla
- LG Energy Solution
- BYD
- Samsung SDI
- CATL
- Panasonic Energy
- Saft (TotalEnergies)
- Fluence Energy
- EnerSys
- Eos Energy Enterprises
- ESS Tech
- Kokam
- VARTA AG
- Leclanche
- Powin Energy
- NEC Energy Solutions
- NGK Insulators
- ZincFive
- Pylontech
- Primus Power
Additional Benefits:
- The market estimate (ME) sheet in Excel format
- 3 months of analyst support
TABLE OF CONTENTS
1 Introduction
- 1.1 Study Assumptions & Market Definition
- 1.2 Scope of the Study
2 Research Methodology
3 Executive Summary
4 Market Landscape
- 4.1 Market Overview
- 4.2 Market Drivers
- 4.2.1 Falling lithium-ion battery pack costs
- 4.2.2 Rising microgrid-specific incentives & tariff reforms
- 4.2.3 Growing demand for energy resilience in extreme-weather zones
- 4.2.4 Rapid decline in LFP cell degradation rates
- 4.2.5 Open-source microgrid controllers enabling standardisation
- 4.2.6 Emerging green-hydrogen hybrid microgrids
- 4.3 Market Restraints
- 4.3.1 Critical-mineral supply-chain volatility
- 4.3.2 Fire-safety & thermal-runaway concerns
- 4.3.3 High Balance of System (BOS) costs for less than 100 kW rural systems
- 4.3.4 Slow permitting in legacy grid codes
- 4.4 Supply-Chain Analysis
- 4.5 Regulatory Landscape
- 4.6 Technological Outlook
- 4.7 Porter's Five Forces Analysis
- 4.7.1 Threat of New Entrants
- 4.7.2 Bargaining Power of Suppliers
- 4.7.3 Bargaining Power of Buyers
- 4.7.4 Threat of Substitutes
- 4.7.5 Competitive Rivalry
5 Market Size & Growth Forecasts
- 5.1 By Battery Chemistry
- 5.1.1 Lithium-ion (NMC, LFP, LTO)
- 5.1.2 Lead-acid (VRLA, Flooded)
- 5.1.3 Flow (Vanadium, Zinc, Iron, Others)
- 5.1.4 Sodium-based (Na-ion, NaS)
- 5.1.5 Other Chemistries (NiCd, Zn-Br, etc.)
- 5.2 By Power Rating
- 5.2.1 Below 100 kW
- 5.2.2 100 to 500 kW
- 5.2.3 Above 500 kW
- 5.3 By Microgrid Type
- 5.3.1 Remote/Islanded
- 5.3.2 Grid-connected
- 5.3.3 Hybrid (PV-Diesel-Storage, etc.)
- 5.4 By End-user
- 5.4.1 Residential
- 5.4.2 Commercial and Industrial
- 5.4.3 Utility
- 5.5 By Region
- 5.5.1 North America
- 5.5.1.1 United States
- 5.5.1.2 Canada
- 5.5.1.3 Mexico
- 5.5.2 Europe
- 5.5.2.1 United Kingdom
- 5.5.2.2 Germany
- 5.5.2.3 France
- 5.5.2.4 Spain
- 5.5.2.5 Nordic Countries
- 5.5.2.6 Russia
- 5.5.2.7 Rest of Europe
- 5.5.3 Asia-Pacific
- 5.5.3.1 China
- 5.5.3.2 India
- 5.5.3.3 Japan
- 5.5.3.4 South Korea
- 5.5.3.5 ASEAN Countries
- 5.5.3.6 Australia and New Zealand
- 5.5.3.7 Rest of Asia-Pacific
- 5.5.4 South America
- 5.5.4.1 Brazil
- 5.5.4.2 Argentina
- 5.5.4.3 Colombia
- 5.5.4.4 Rest of South America
- 5.5.5 Middle East and Africa
- 5.5.5.1 United Arab Emirates
- 5.5.5.2 Saudi Arabia
- 5.5.5.3 South Africa
- 5.5.5.4 Egypt
- 5.5.5.5 Rest of Middle East and Africa
- 5.5.1 North America
6 Competitive Landscape
- 6.1 Market Concentration
- 6.2 Strategic Moves (M&A, Partnerships, PPAs)
- 6.3 Market Share Analysis (Market Rank/Share for key companies)
- 6.4 Company Profiles (includes Global level Overview, Market level overview, Core Segments, Financials as available, Strategic Information, Products & Services, and Recent Developments)
- 6.4.1 Tesla
- 6.4.2 LG Energy Solution
- 6.4.3 BYD
- 6.4.4 Samsung SDI
- 6.4.5 CATL
- 6.4.6 Panasonic Energy
- 6.4.7 Saft (TotalEnergies)
- 6.4.8 Fluence Energy
- 6.4.9 EnerSys
- 6.4.10 Eos Energy Enterprises
- 6.4.11 ESS Tech
- 6.4.12 Kokam
- 6.4.13 VARTA AG
- 6.4.14 Leclanche
- 6.4.15 Powin Energy
- 6.4.16 NEC Energy Solutions
- 6.4.17 NGK Insulators
- 6.4.18 ZincFive
- 6.4.19 Pylontech
- 6.4.20 Primus Power
7 Market Opportunities & Future Outlook
- 7.1 White-space & Unmet-Need Assessment
 全球資料中心與商用電池儲能市場(2026-2036 年)
 壁掛式電池市場按技術類型、安裝類型、儲存容量、應用和最終用戶分類的全球預測(2026-2032)按安裝類型、系統位置、技術、儲存時長、最終用戶產業和應用分類的商業和工業能源儲存系統系統市場 - 全球預測 2026-2032電網側和電源側儲能市場按技術類型、容量範圍、安裝類型、功率等級、應用類別、用途和最終用途分類-2026年至2032年全球預測大型電池儲能市場規模、佔有率、成長及全球產業分析:依類型、應用和地區劃分的洞察與預測(2024-2032 年)
 微電網儲能電池市場-全球產業規模、佔有率、趨勢、機會與預測(細分、按類型、按應用、按地區、按競爭,2020-2030 年)
 儲能牆市場報告:趨勢、預測和競爭分析(至2031年)物料輸送和地面支援設備用鋰離子電池市場,按電池類型、電池配置、外形規格、額定電壓、設備類型、配銷通路和最終用戶分類 - 2025 年至 2030 年全球預測