


 |
市場調查報告書
商品編碼
2062478
V2G(車輛到電網):市場佔有率分析、行業趨勢和統計數據、成長預測(2026-2031 年)Vehicle-to-Grid (V2G) - Market Share Analysis, Industry Trends & Statistics, Growth Forecasts (2026 - 2031) |
||||||
※ 本網頁內容可能與最新版本有所差異。詳細情況請與我們聯繫。
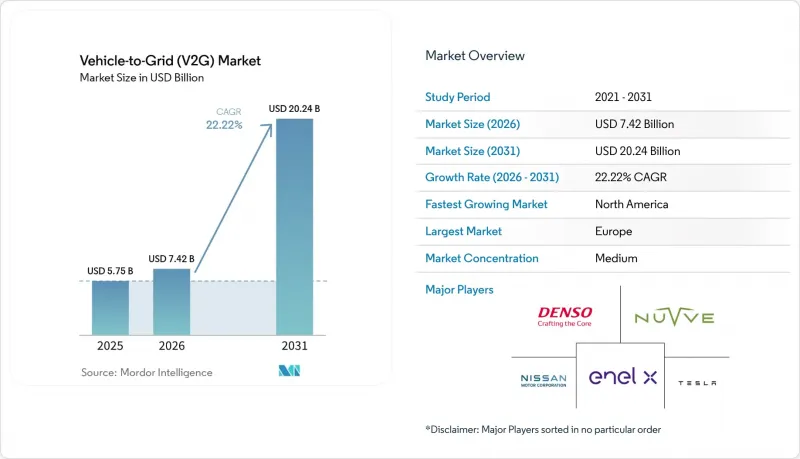
據 Mordor Intelligence 稱,2025 年車網互動 (V2G) 市場價值為 57.5 億美元,預計到 2031 年將達到 202.4 億美元,而 2026 年為 74.2 億美元,預測期(2026-2031 年)的複合年成長率為 22.2%。
本報告按組件(電動車、V2G充電站等)、充電基礎設施(交流電充電、直流充電、混合動力)、車輛類型(純電動車、插電式混合動力車、燃料電池電動車)、應用領域(商用、家用)和地區(北美、歐洲、亞太、南美、中東和非洲)進行細分。市場預測以美元計價。
全球V2G(車輛到電網)市場趨勢與洞察
電動汽車保有量的快速成長和扶持性獎勵
車隊電氣化可以縮短投資回收期,因為營運商可以利用分時電價套利、降低需求電價以及頻率調節收入等多種方式獲利——這些收入是住宅難以獲得的。日本經濟產業省計畫在2025年為每套V2H(車輛到房屋)系統提供75萬日圓(約5,000美元)的補貼,以鼓勵超過1萬輛日產聆風電動車接入電網。此舉旨在將補貼與實際的電網服務掛鉤,而非硬體購買。加州公共產業委員會已強制要求到2027年實現150兆瓦的V2G(車輛到電網)部署容量,並設定到2030年實現7吉瓦的負載轉移目標,從而消除了2024年之前阻礙項目推進的政策模糊性。中國國家能源局計劃於2024年在蘇州啟動一個100套車輛的試點項目,預示著未來將在全國範圍內推廣,儘管各省之間的互通性規則仍有差異。實施註冊要求和成本回收機制的市場吸引了不成比例的大量投資,而僅依靠自願舉措的地區則繼續落後。
可再生能源佔比的不斷提高,正在加速對電網柔軟性的需求。
到2025年,隨著歐洲部分電網中可變可再生能源的採用率超過40%,白天的電力波動將加劇,但電動車電池可以以極低的額外成本利用這種波動進行套利。 2025年,德國聯邦網路管理局向聚合的電動車隊開放了頻率穩定儲備,最低競標價格為1兆瓦,這使得中型充電站也能參與其中。丹麥的eMabler用戶每月可從頻率穩定合約中獲得38至76美元的收益,而營運最佳化的商業車隊則可獲得152美元的收益。在澳洲由澳洲再生能源署(ARENA)資助的REVS測試中,150輛汽車展現了在200毫秒內做出反應的能力,優於旋轉備用容量。隨著限電事件的增加,電力公司越來越傾向於V2G(車輛到電網)技術,而不是新建峰值發電廠,因為分散式電池可以避免電網升級,並能對不到一秒的突發電力波動做出反應。
關於電池劣化和保固的擔憂
每日的V2G循環會導致電池健康狀態(SOH)在10年內下降9-14%,到2030年,這將導致每兆瓦時約140美元的補償金。大多數OEM廠商的保固條款不涵蓋向電網放電的情況。如果遙測技術偵測到過度向電網放電,日產聆風的保固將失效。特斯拉Cybertruck將車主每年的放電循環次數限制為365次,有效地阻止了每日的V2G循環,同時又不影響其8年的電池保固。除非有分級保固條款對電網放電進行定價,否則V2G仍將是商用車的專屬解決方案。
細分市場分析
預計到2025年,電動車銷量將佔總銷量的48.3%,而V2G充電站的複合年成長率將達到25.8%。這是因為基礎設施營運商現在提供的是能源管理軟體,該軟體可以產生月度費用,而不是一次性的硬體利潤。能源管理平台每月向車隊收取每輛車15至30美元的費用,毛利率高達60%至70%,遠高於充電樁通常20%至30%的毛利率。
軟體的崛起正在重塑車網互動(V2G)市場。曾經依靠金屬和塑膠利潤蓬勃發展的零件供應商,如今必須掌握遙測技術、ISO 15118-20 合規性以及即時調度。因此,軟體驅動的 V2G 市場規模的成長速度超過了整體市場的成長速度。同時,商品化的智慧電錶和通訊設備通常被整合到公共產業設備的升級改造中,這限制了它們獨立獲利的潛力。
到2025年,交流充電設備將佔總收入的57.6%,這主要得益於其在夜間停車期間7-11kW的低成本充電能力。然而,結合交流和直流的混合解決方案預計將實現最高的複合年成長率(CAGR),達到29.2%,該方案將低成本的交流夜間充電與用於輔助服務合約的50-150kW直流放電相結合。
因此,這種混合平台實現了切實可行的平衡。安裝成本約 12,000 美元,比獨立的直流硬體便宜三分之一;以校車停車場為例,頻率調節帶來的收益可以將投資回收期縮短至四年。這種多功能性正推動 V2G(車輛到電網)市場朝著既能支持通勤能源又能實現電網服務貨幣化的基礎設施方向發展,同時避免資產重複建設。
區域分析
到2025年,歐洲將維持40.2%的市場佔有率,這主要得益於德國1兆瓦的競標閾值以及歐盟範圍內強制性的ISO 15118-20標準。英國的動態輸電定價系統將尖峰時段的價格提高了三倍,並將住宅投資的投資回收期縮短了一半。此外,法國汽車製造商雷諾集團在烏特勒支開展的500輛汽車試點計畫表明,乘用車也能滿足住宅輸電(RTE)的供需調整要求。
北美是成長最快的地區,預計到2031年將以25.1%的複合年成長率成長。加州150兆瓦的部署目標和ChargeScape公司600萬台設備的平台是推動這一成長的主要動力。加拿大安大略省和魁北克省的試點計畫表明,該技術已準備就緒,但缺乏上網電價補貼政策阻礙了其商業化部署。墨西哥仍處於起步階段,但電力公司之間的跨境合約預示著未來該技術將廣泛應用。
亞太地區的成長仰賴中國國家電網公司在蘇州和上海開展的試點計畫、日本提供的47.16億美元V2H補貼以及韓國開展的500台機組的頻率調節測試。 CHAdeMO和CCS協議之間的不匹配仍然推高了成本,東南亞國協正在等待電動車普及率的提高,才能開始大規模部署。由澳洲再生能源署(ARENA)資助的REVS計畫已證實其技術可行性,但仍需克服分散的國內電力市場規則的限制。
其他好處:
- Excel格式的市場預測(ME)表
- 3個月的分析師支持
目錄
第1章:引言
- 研究假設和市場定義
- 調查範圍
第2章:調查方法
第3章執行摘要
第4章 市場狀況
- 市場概覽
- 市場促進因素
- 電動汽車保有量的快速成長和扶持性獎勵
- 可再生能源佔有率的加速成長,增加了對電網柔軟性的需求。
- 聚合型經營模式的監管框架正變得越來越清晰。
- 減少雙向充電器的資本投資
- 基於區塊鏈的V2G交易微支付
- 將二次電池整合到V2G網路中
- 市場限制因素
- 關於電池劣化和保固的擔憂
- 互通性和協定碎片化
- 電動車安全生態系統中的網路安全漏洞
- 反向功率流所引起的配電變壓器負載
- 供應鏈分析
- 監理情勢
- 技術展望
- 波特五力模型
第5章 市場規模與成長預測
- 按組件
- 電動車(EV)
- V2G充電站
- 智慧電錶及通訊設備
- 能源管理系統(EMS)
- 軟體平台
- 透過充電基礎設施
- 交流充電
- 直流充電
- 混合
- 車輛類型
- 電池式電動車(BEV)
- 插電式混合動力車(PHEV)
- 燃料電池汽車(FCEV)
- 透過使用
- 商業
- 個人
- 按地區
- 北美洲
- 美國
- 加拿大
- 墨西哥
- 歐洲
- 德國
- 英國
- 法國
- 義大利
- 北歐國家
- 俄羅斯
- 其他歐洲國家
- 亞太地區
- 中國
- 印度
- 日本
- 韓國
- 東南亞國協
- 其他亞太國家
- 南美洲
- 巴西
- 阿根廷
- 其他南美國家
- 中東和非洲
- 沙烏地阿拉伯
- 阿拉伯聯合大公國
- 南非
- 埃及
- 其他中東和非洲國家
- 北美洲
第6章 競爭情勢
- 市場集中度
- 策略趨勢(併購、聯盟、購電協議)
- 市場佔有率分析(主要公司的市場排名和佔有率)
- 公司簡介
- Nissan Motor Corporation
- Mitsubishi Motors Corporation
- Tesla Inc.
- Denso Corporation
- Enel X(Enel Group)
- Nuvve Holding Corp.
- The Mobility House
- Fermata Energy
- ABB Ltd.
- Hitachi Energy
- Renault Group
- Honda Motor Co., Ltd.
- Hyundai Motor Co.
- BYD Company Ltd.
- Siemens AG
- Wallbox Chargers, SL
- ENGIE SA
- EV Connect, Inc.
- NextEra Energy, Inc.
- ChargePoint Holdings, Inc.
第7章 市場機會與未來展望
According to Mordor Intelligence, the vehicle-to-Grid market size was valued at USD 5.75 billion in 2025 and is estimated to grow from USD 7.42 billion in 2026 to reach USD 20.24 billion by 2031, at a CAGR of 22.22% during the forecast period (2026-2031).
This report is Segmented by Component (Electric Vehicles, V2G Charging Stations, and More), Charging Infrastructure (AC Charging, DC Charging, Hybrid), Vehicle Type (BEVs, Phevs, Fcevs), Application (Commercial, Individual), and Geography (North America, Europe, Asia-Pacific, South America, Middle East and Africa). The Market Forecasts are Provided in Terms of Value (USD).
Global Vehicle-to-Grid (V2G) Market Trends and Insights
Rapid EV Parc Expansion & Supportive Incentives
Fleet electrification compresses payback periods because operators can layer time-of-use arbitrage, demand-charge reduction, and frequency-regulation income that residential owners cannot easily capture. Japan's Ministry of Economy, Trade, and Industry paid JPY 750,000 (≈ USD 5,000) per V2H installation in 2025, spurring over 10,000 Nissan Leaf connections, a design that ties subsidies to measured grid services rather than hardware purchases . California's Public Utilities Commission ordered 150 MW of enrolled V2G capacity by 2027 and a 7 GW load-shift goal by 2030, eliminating policy ambiguity that suppressed projects before 2024 . China's National Energy Administration started a 100-vehicle pilot in Suzhou in 2024, signaling future nationwide integration, though provincial interconnection rules remain uneven. Markets that impose binding enrollment or cost-recovery mechanisms attract disproportionate investment, while voluntary jurisdictions continue to lag.
Accelerating Renewables Share Driving Grid-Flexibility Need
Variable renewable penetration above 40% in several European grids during 2025 increases intraday volatility that EV batteries can arbitrage at minimal incremental cost. Germany's Bundesnetzagentur opened frequency-containment reserves to aggregated EV fleets at 1 MW minimum bids in 2025, enabling mid-size depots to participate . Denmark's eMabler users earned USD 38-76 per month from frequency-regulation contracts, rising to USD 152 for commercial fleets with optimized dispatch. Australia's ARENA-funded REVS trial proved 150 vehicles could respond within 200 ms, outperforming spinning reserves. As curtailment events multiply, utilities prefer V2G over new peaker plants because distributed batteries avoid transmission upgrades and deliver sub-second ramp rates.
Battery Degradation & Warranty Concerns
Daily V2G cycles impose 9-14% state-of-health loss over 10 years, translating to roughly USD 140/MWh in make-whole payments by 2030. Most OEM warranties exclude grid discharge; Nissan's Leaf warranty voids coverage if telemetry detects excessive export events. Tesla's Cybertruck limits owners to 365 discharge cycles annually, effectively blocking daily V2G without voiding the 8-year battery warranty. Without tiered warranties that price grid duty, V2G remains a commercial-fleet proposition.
Other drivers and restraints analyzed in the detailed report include:
- Aggregator-Based Business Models Gaining Regulatory Clarity
- Declining Bidirectional Charger CAPEX
- Interoperability & Protocol Fragmentation
For complete list of drivers and restraints, kindly check the Table Of Contents.
Segment Analysis
Electric Vehicles supplied 48.3% revenue in 2025, yet V2G Charging Stations are forecast to climb at 25.8% CAGR because infrastructure players now package energy-management software that earns monthly fees rather than one-time hardware profits. Energy-management platforms charge fleets USD 15-30 per vehicle monthly and earn 60-70% gross margins, dwarfing the 20-30% typical for chargers.
Software's emergence is reshaping the Vehicle-to-Grid (V2G) market; component suppliers that once thrived on metal-and-plastic margins must now master telemetry, ISO 15118-20 compliance, and real-time dispatch. The Vehicle-to-Grid (V2G) market size attributable to software is consequently expanding faster than aggregate growth, while commoditized smart meters and communication devices are bundled into utility upgrades with limited standalone revenue potential.
AC equipment captured 57.6% of 2025 revenue because overnight dwell times allow 7-11 kW charging at low cost. Still, hybrid AC-plus-DC solutions are projected to deliver the highest 29.2% CAGR, blending cheap AC overnight charging with 50-150 kW DC discharge for ancillary-service contracts.
Hybrid platforms thus strike a pragmatic balance: installed at ≈ USD 12,000, they undercut standalone DC hardware by one-third and shorten payback for school-bus depots to four years on frequency-regulation income. This versatility underpins the Vehicle-to-Grid (V2G) market's shift toward infrastructure that supports both commuting energy and grid-service monetization without duplicating assets.
Geography Analysis
Europe retained 40.2% share in 2025, propelled by Germany's 1 MW bid threshold and the EU-wide ISO 15118-20 mandate. The United Kingdom's dynamic export tariffs triple peak-hour prices, halving residential payback times, and French automaker Renault Group's 500-vehicle Utrecht trial proved passenger cars can satisfy RTE's balancing requirements.
North America is the fastest-growing region, expanding at 25.1% CAGR through 2031, with California's 150 MW enrollment target and ChargeScape's 6 million-vehicle platform providing scale. Canadian pilots in Ontario and Quebec demonstrate technical readiness, yet the absence of export tariffs delays commercial rollouts. Mexico remains nascent, though cross-border utility contracts hint at future uptake.
Asia-Pacific growth hinges on China's State Grid pilots in Suzhou and Shanghai, Japan's USD 4716 V2H subsidy, and South Korea's 500-vehicle frequency-regulation test. Protocol fragmentation between CHAdeMO and CCS still inflates costs, and ASEAN markets await higher EV penetration before committing to large deployments. Australia's ARENA-funded REVS project confirms technical viability but must navigate fragmented National Electricity Market rules.
- Nissan Motor Corporation
- Mitsubishi Motors Corporation
- Tesla Inc.
- Denso Corporation
- Enel X (Enel Group)
- Nuvve Holding Corp.
- The Mobility House
- Fermata Energy
- ABB Ltd.
- Hitachi Energy
- Renault Group
- Honda Motor Co., Ltd.
- Hyundai Motor Co.
- BYD Company Ltd.
- Siemens AG
- Wallbox Chargers, S.L.
- ENGIE SA
- EV Connect, Inc.
- NextEra Energy, Inc.
- ChargePoint Holdings, Inc.
Additional Benefits:
- The market estimate (ME) sheet in Excel format
- 3 months of analyst support
TABLE OF CONTENTS
1 Introduction
- 1.1 Study Assumptions & Market Definition
- 1.2 Scope of the Study
2 Research Methodology
3 Executive Summary
4 Market Landscape
- 4.1 Market Overview
- 4.2 Market Drivers
- 4.2.1 Rapid EV parc expansion & supportive incentives
- 4.2.2 Accelerating renewables share driving grid-flexibility need
- 4.2.3 Aggregator-based business models gaining regulatory clarity
- 4.2.4 Declining bidirectional charger CAPEX
- 4.2.5 Blockchain-enabled micro-settlements for V2G transactions
- 4.2.6 Second-life battery integration with V2G networks
- 4.3 Market Restraints
- 4.3.1 Battery degradation & warranty concerns
- 4.3.2 Interoperability & protocol fragmentation
- 4.3.3 EV-SE cyber-security vulnerabilities
- 4.3.4 Distribution transformer stress from reverse power flows
- 4.4 Supply-Chain Analysis
- 4.5 Regulatory Landscape
- 4.6 Technological Outlook
- 4.7 Porter's Five Forces
- 4.7.1 Threat of New Entrants
- 4.7.2 Bargaining Power of Buyers
- 4.7.3 Bargaining Power of Suppliers
- 4.7.4 Threat of Substitutes
- 4.7.5 Competitive Rivalry
5 Market Size & Growth Forecasts
- 5.1 By Component
- 5.1.1 Electric Vehicles (EVs)
- 5.1.2 V2G Charging Stations
- 5.1.3 Smart Meters and Communication Devices
- 5.1.4 Energy Management Systems (EMS)
- 5.1.5 Software and Platforms
- 5.2 By Charging Infrastructure
- 5.2.1 AC Charging
- 5.2.2 DC Charging
- 5.2.3 Hybrid
- 5.3 By Vehicle Type
- 5.3.1 Battery Electric Vehicles (BEVs)
- 5.3.2 Plug-in Hybrid Electric Vehicles (PHEVs)
- 5.3.3 Fuel Cell Electric Vehicles (FCEVs)
- 5.4 By Application
- 5.4.1 Commercial
- 5.4.2 Individual
- 5.5 By Geography
- 5.5.1 North America
- 5.5.1.1 United States
- 5.5.1.2 Canada
- 5.5.1.3 Mexico
- 5.5.2 Europe
- 5.5.2.1 Germany
- 5.5.2.2 United Kingdom
- 5.5.2.3 France
- 5.5.2.4 Italy
- 5.5.2.5 NORDIC Countries
- 5.5.2.6 Russia
- 5.5.2.7 Rest of Europe
- 5.5.3 Asia-Pacific
- 5.5.3.1 China
- 5.5.3.2 India
- 5.5.3.3 Japan
- 5.5.3.4 South Korea
- 5.5.3.5 ASEAN Countries
- 5.5.3.6 Rest of Asia-Pacific
- 5.5.4 South America
- 5.5.4.1 Brazil
- 5.5.4.2 Argentina
- 5.5.4.3 Rest of South America
- 5.5.5 Middle East and Africa
- 5.5.5.1 Saudi Arabia
- 5.5.5.2 United Arab Emirates
- 5.5.5.3 South Africa
- 5.5.5.4 Egypt
- 5.5.5.5 Rest of Middle East and Africa
- 5.5.1 North America
6 Competitive Landscape
- 6.1 Market Concentration
- 6.2 Strategic Moves (M&A, Partnerships, PPAs)
- 6.3 Market Share Analysis (Market Rank/Share for key companies)
- 6.4 Company Profiles (includes Global level Overview, Market level overview, Core Segments, Financials as available, Strategic Information, Products & Services, and Recent Developments)
- 6.4.1 Nissan Motor Corporation
- 6.4.2 Mitsubishi Motors Corporation
- 6.4.3 Tesla Inc.
- 6.4.4 Denso Corporation
- 6.4.5 Enel X (Enel Group)
- 6.4.6 Nuvve Holding Corp.
- 6.4.7 The Mobility House
- 6.4.8 Fermata Energy
- 6.4.9 ABB Ltd.
- 6.4.10 Hitachi Energy
- 6.4.11 Renault Group
- 6.4.12 Honda Motor Co., Ltd.
- 6.4.13 Hyundai Motor Co.
- 6.4.14 BYD Company Ltd.
- 6.4.15 Siemens AG
- 6.4.16 Wallbox Chargers, S.L.
- 6.4.17 ENGIE SA
- 6.4.18 EV Connect, Inc.
- 6.4.19 NextEra Energy, Inc.
- 6.4.20 ChargePoint Holdings, Inc.
7 Market Opportunities & Future Outlook
- 7.1 White-space & Unmet-need Assessment
 車網互動(V2G)和雙向充電解決方案市場預測至2034年-按充電器類型、車輛類型、通訊與控制、技術、應用、最終用戶和地區分類的全球分析
 V2G通訊協定及聚合軟體市場機會、成長要素、產業趨勢分析及2026-2035年預測
 V2G市場規模、佔有率、趨勢和預測:按解決方案類型、車輛類型、充電方式、應用和地區分類,2026-2034年
 V2G充電器市場:按充電器類型、輸出功率、連接方式、車輛類型和最終用戶分類-2026-2032年全球市場預測
 V2G(車輛到電網)技術市場:按應用、電源和地區分類
 2026年全球V2G(車輛到電網)技術市場報告
 V2G市場規模、佔有率、成長及全球產業分析:按類型、應用和地區的洞察,2026-2034年的預測
 車網互動(V2G)市場:依組件、技術(雙向充電、單向充電)、應用和最終用戶劃分-全球預測至2036年
 全球V2G(車輛到電網)市場:按組件、車輛類型、應用、充電方式、國家及地區分類-產業分析、市場規模、佔有率及2025年至2032年未來預測全球車網互動(V2G)市場:按車輛類型、解決方案、應用、最終用戶和地區劃分 - 市場規模、行業趨勢、機會分析和預測(2026-2035 年)