

 |
市場調查報告書
商品編碼
2062468
有機沼氣:市場佔有率分析、產業趨勢與統計、成長預測(2026-2031)Organic Biogas - Market Share Analysis, Industry Trends & Statistics, Growth Forecasts (2026 - 2031) |
||||||
※ 本網頁內容可能與最新版本有所差異。詳細情況請與我們聯繫。
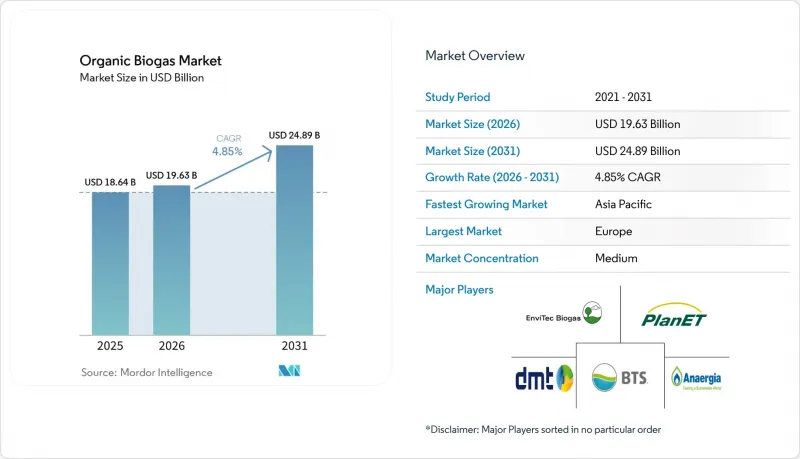
根據 Mordor Intelligence 預測,有機沼氣市場規模預計將在 2025 年達到 186.4 億美元,2026 年達到 196.3 億美元,到 2031 年達到 248.9 億美元,2026 年至 2031 年的複合年成長率為 4.85%。
本報告按原料(例如,農業殘餘物)、技術(例如,濕式厭氧消化)、工廠規模(例如,農場規模、中型規模)、應用(例如,發電)、最終用戶行業(例如,地方政府)和地區(北美、歐洲、亞太、南美、中東和非洲)進行細分。市場預測以美元計價。
全球有機沼氣市場趨勢與洞察
政府獎勵和可再生能源目標
投資合格政策的清晰度是有機沼氣市場的基礎。美國《再生天然氣獎勵法案》提供生產稅額扣抵,以保護開發商免受批發電力價格波動的影響。巴西《2025年生物甲烷法》規定,天然氣供應商自2026年起排放10%,因此立即強化了購買低碳分子的義務。丹麥《排放70%法案》倡導「生物甲烷優先」的電網策略,這將吸收該國幾乎所有的原料潛力。印度的SATAT計畫提供收購擔保,以擴大國內生物壓縮天然氣(Bio-CNG)工廠的規模,並推動2030年需求成長40倍。這些協調一致的措施增強了金融相關人員對支持投資回收期為15年的兆瓦級計畫的信心。
有機廢棄物產生量增加以及避免掩埋的義務。
都市區不斷上漲的廢棄物費和甲烷減排目標正在推動都市區有機沼氣市場的成長。現代化的沼氣池能夠去除食物廢棄物中95%的生化需氧量(BOD),同時每去除1克化學需氧量(COD)即可產生0.292公升甲烷。與污水處理廠配對的厭氧膜生物反應器能夠處理高濃度的有機物,生產符合電網標準的生物甲烷。典型的大都會圈計畫可以透過沼氣池殘渣肥料和排碳權的貨幣化,在六年內收回投資。都市區原料品質穩定,使得大規模設施的建設成為可能,與受季節性限制的農業殘渣相比,能夠降低單位成本,並提高盈利。
厭氧消化裝置的初始資本支出(CAPEX)較高
公用事業規模的沼氣池造價在每兆瓦300萬美元至800萬美元之間。這主要反映了客製化的預處理、沼氣氣體純化和除臭系統的成本。 EnviTec公司在Forest和Friedland的升級改造項目耗資5000萬歐元,使氣體純化能力加倍,但這同時也表明,即使對於經驗豐富的運營商而言,也存在著巨大的資金投入門檻。儘管貸款方指出存在技術風險,但該資產類別的成熟度以及95%的運轉率記錄,使得在已開發市場獲得企劃案融資變得越來越容易,而在新興地區,借貸仍然受到限制。
細分市場分析
到2025年,農業殘餘物將佔有機沼氣市場佔有率的34.1%。相較之下,食物廢棄物不僅滿足了市政廢棄物減量的要求,而且正以每年6.7%的速度成長,這為其提供了穩定的收益,從而提高了項目的內部收益率(IRR)。
光是在歐盟,每年就有1,800萬噸食物廢棄物透過市政上門收集計畫被收集,其中高能量基材被送往沼氣池,每噸可產生520立方公尺沼氣。這比平均農作物殘渣的沼氣產量高出約45%。加州的酪農產業也呈現類似的成長動能。 2024年,加州有1,230萬噸牲畜糞便被送入沼氣池,產生了價值6.2億美元的可再生天然氣(RNG)信用額度,超過了乳牛少於800頭的農場的牛奶銷售收入。隨著德國計劃在2029年禁止大型污水處理廠將污水污泥施用於土地,預計污水污泥市場將會萎縮。
儘管濕式連續攪拌釜式反應器(CSTR)憑藉其運行可靠性和現有投資仍佔據52.3%的市場佔有率,但乾式消化技術正以每年7.1%的速度成長,這得益於其節水70%和面積減少40%的優勢。 DRANCO的高固態設備可將停留時間縮短至21天,在不相應增加資本投資的情況下提高處理能力。
兩階段共消化設計提高了富含脂質廢棄物的甲烷產量。然而,對於一個1兆瓦的系統而言,這將額外增加120萬美元的成本。另一方面,潟湖系統因其成本效益而在熱帶畜牧養殖區備受青睞。然而,平均甲烷洩漏量令人擔憂,這威脅到其作為氣候變遷緩解措施的可靠性。 2025年,主動吸氣膜覆蓋層的引入降低了甲烷洩漏量。然而,在信貸取得困難的市場,這項創新使投資回收期延長了一年以上。
區域分析
到2025年,歐洲將佔全球銷售額的41.2%,其中德國的9,500座工廠和丹麥世界領先的生物甲烷管網(普及率達28%)構成了主要基礎。原料供應成熟,在巴伐利亞等地區,併網等待時間最長可達18個月。北歐國家正呈現成長態勢,主要得益於強制規定要求30%的運輸燃料必須來自可再生能源,以及生物液化天然氣(bio-LNG)的早期應用。
預計到2031年,亞太地區將以每年6.4%的速度成長,成為有機沼氣市場成長最快的地區。儘管中國500億元人民幣的農村沼氣池基金和印度SATAT計劃建設5000座沼氣池的目標推動了這一成長勢頭,但由於土地徵用和價格糾紛等問題,實施進程有所延遲。日本在2024年修訂《食品循環利用法》後,正崛起為特定領域的領導者,而東南亞的成長則得益於棕櫚油廢水處理池計畫。
在北美,加州正透過低碳燃料標準(LCFS)推動再生天然氣(RNG)的需求成長;加拿大各省的碳排放稅政策也刺激了不列顛哥倫比亞省和魁北克省十幾個新計畫的啟動。在墨西哥,由於管道運輸受限,可再生天然氣產能正在成長,主要用於食品加工廠的現場蒸氣供應。南美洲、中東和非洲的再生天然氣計畫規模仍然較小,但巴西糖業的先導計畫以及阿拉伯聯合大公國的垃圾焚化發電發電廠建設正在穩步推進。
其他好處:
- Excel格式的市場預測(ME)表
- 3個月的分析師支持
目錄
第1章:引言
- 研究假設和市場定義
- 調查範圍
第2章:調查方法
第3章執行摘要
第4章 市場狀況
- 市場概覽
- 市場促進因素
- 政府獎勵和可再生能源目標
- 有機廢棄物產生量增加,以及強制避免掩埋。
- 運輸生質燃料(RNG/生物壓縮天然氣)的脫碳義務
- 對碳負排放生物肥料的需求(有效利用沼渣)
- 透過虛擬管道和證書進行企業級RNG採購
- 新興綠色航運走廊對生物液化天然氣的需求
- 市場限制因素
- 厭氧消化裝置的初始資本投資成本高昂。
- 原料供應鏈的季節性和物流複雜性
- 電網供應瓶頸和天然氣品質合規成本
- 當地居民因氣味和大型車輛通行而反對(鄰避效應)。
- 供應鏈分析
- 監理情勢
- 技術展望
- 波特五力模型
第5章 市場規模與成長預測
- 按原料
- 農業殘餘物
- 牲畜糞便
- 食物和食物浪費
- 污水污泥
- 工業有機廢棄物
- 能源作物(例如,玉米青貯、高粱)
- 透過技術
- 濕式厭氧消化(CSTR)
- 乾/高固態消化
- 兩階段/共消化系統
- 潟湖/有蓋潟湖 AD 型
- 按植物大小
- 農場規模(小於 250 千瓦)
- 中型(250千瓦至1兆瓦)
- 公用事業規模(1兆瓦或以上)
- 透過使用
- 發電
- 僅用於暖氣
- 熱電聯產(CHP)
- 汽車燃料(生物壓縮天然氣/生物液化天然氣)
- 管道RNG注入
- 工業蒸氣/製程熱
- 按最終用戶行業分類
- 地方政府
- 農業和畜牧業農場
- 食品和飲料製造商
- 廢棄物管理公司
- 運輸燃料經銷商
- 其他
- 按地區
- 北美洲
- 美國
- 加拿大
- 墨西哥
- 歐洲
- 英國
- 德國
- 法國
- 西班牙
- 北歐國家
- 俄羅斯
- 其他歐洲國家
- 亞太地區
- 中國
- 印度
- 日本
- 韓國
- 東南亞國協
- 澳洲和紐西蘭
- 其他亞太國家
- 南美洲
- 巴西
- 阿根廷
- 哥倫比亞
- 其他南美國家
- 中東和非洲
- 阿拉伯聯合大公國
- 沙烏地阿拉伯
- 南非
- 埃及
- 其他中東和非洲國家
- 北美洲
第6章 競爭情勢
- 市場集中度
- 策略趨勢(併購、聯盟、購電協議)
- 市場佔有率分析(主要公司的市場排名和佔有率)
- 公司簡介
- EnviTec Biogas AG
- PlanET Biogas Group
- BTS Biogas SRL
- BioConstruct GmbH
- Scandinavian Biogas
- Nature Energy Biogas
- Bright Biomethane
- Anaergia Inc.
- Hitachi Zosen Inova
- Future Biogas
- Gasum Oy
- Agraferm GmbH
- DMT Environmental Technology
- Schmack Biogas GmbH
- Veolia Environnement
- Air Liquide Biogas Solutions
- ENGIE Biomethane
- Clean Energy Fuels Corp.
- Wartsila(Puregas Solutions)
- Gazpack BV
第7章 市場機會與未來展望
According to Mordor Intelligence, the organic biogas market size is projected to be USD 18.64 billion in 2025, USD 19.63 billion in 2026, and reach USD 24.89 billion by 2031, growing at a CAGR of 4.85% from 2026 to 2031.
This report is Segmented by Feedstock (Agricultural Residues, and More), Technology (Wet Anaerobic Digestion, and More), Plant Scale (Farm-Scale, Medium, and More), Application (Electricity Generation and More), End-User Sector (Municipal Utilities, and More), and Geography (North America, Europe, Asia-Pacific, South America, Middle East and Africa). Market Forecasts are Provided in Terms of Value (USD).
Global Organic Biogas Market Trends and Insights
Government Incentives & Renewable-Energy Targets
Investment-grade policy clarity underpins the organic biogas market. The US RNG Incentive Act anchors production tax credits that insulate developers from wholesale power volatility. Brazil's 2025 biomethane statute obliges gas suppliers to cut emissions 10% from 2026, immediately sharpening purchase obligations for low-carbon molecules. Denmark's 70% emission-reduction law executes a biomethane-first grid strategy that absorbs nearly all domestic feedstock potential. India's SATAT scheme provides offtake guarantees that scale domestic bio-CNG plants, fostering a forty-fold demand rise by FY 2030.Such aligned measures give financiers confidence to back multimegawatt facilities with 15-year paybacks.
Rising Organic-Waste Generation & Landfill-Diversion Mandates
Municipal tipping-fee escalation and methane-abatement goals propel organic biogas market growth in cities. Advanced digesters now remove 95% biochemical oxygen demand from food waste while yielding 0.292 L methane per gram of chemical oxygen demand removed.Anaerobic membrane bioreactors co-located at wastewater plants treat high-strength organics and generate grid-quality biomethane streams. Typical metropolitan projects repay capital within six years once digestate fertilizer and carbon credits are monetized. Urban feedstock consistency enables larger facilities, lowering unit costs and boosting profitability relative to seasonally constrained farm residues.
High Upfront CAPEX of Anaerobic-Digestion Plants
Utility-scale digesters cost USD 3-8 million per MW, reflecting bespoke preprocessing, biogas upgrading, and odor management systems. EnviTec's EUR 50 million upgrades at Forst and Friedland double gas-upgrading capacity yet illustrate steep capital hurdles even for experienced operators. Although lenders cite technology risk, asset-class maturity, and 95% uptime records increasingly secure project finance in developed markets, while emerging regions still face constrained debt availability.
Other drivers and restraints analyzed in the detailed report include:
- Decarbonization Mandates for Transportation Bio-Fuels
- Carbon-Negative Bio-Fertilizer Demand
- Grid-Injection Bottlenecks & Gas-Quality Compliance Costs
For complete list of drivers and restraints, kindly check the Table Of Contents.
Segment Analysis
Agricultural residues retained 34.1% of the organic biogas market share in 2025. In contrast, food waste meets municipal diversion mandates and is expanding at 6.7% annually, delivering reliable gate fees that improve project IRRs.
Municipal curbside programs are diverting 18 million tons of food waste per year within the EU alone, funneling high-energy substrates into digesters that realize 520 Nm3 of biogas per ton, roughly 45% more than average crop residues. California's dairy sector illustrates parallel momentum: 12.3 million tons of manure fed to digesters in 2024 generated RNG credits worth USD 620 million, surpassing farm milk revenue for herds under 800 cows. The sewage sludge market is expected to decline after Germany bans land application from large plants in 2029.
Wet CSTR continues to dominate with 52.3% share because of operational reliability and legacy investments, yet dry digestion is growing 7.1% per year by leveraging 70% lower water use and 40% smaller footprint. A DRANCO high-solids plant can reduce retention time to 21 days, boosting throughput without proportional capex.
Two-stage co-digestion designs boost methane yields from lipid-rich waste. However, this comes at an added cost of USD 1.2 million for a 1 MW setup. While Laguna-type systems are favored in tropical livestock hubs for their cost-effectiveness, they face scrutiny due to an average methane slip, jeopardizing their climate credentials. In 2025, the introduction of active-suction membrane covers reduced this slip. Yet, in markets where credit is hard to come by, this innovation has pushed the payback period out by over a year.
Geography Analysis
Europe maintained 41.2% of 2025 revenue, anchored by Germany's 9,500 plants and Denmark's world-leading 28% biomethane grid penetration. Feedstock sources mature, and interconnection queues stretch to 18 months in regions such as Bavaria. Nordic countries are experiencing growth, driven by a 30% renewable transport fuel mandate and the early adoption of bio-LNG.
Asia-Pacific will expand 6.4% annually through 2031, making it the fastest-growing region in the organic biogas market. China's CNY 50 billion rural-digester fund and India's 5,000-plant SATAT target underpin momentum, though execution lags amid land fears and offtake-price disputes. Japan is emerging as a niche leader post-2024 Food Recycling Law amendments, and Southeast Asian growth is backed by palm-effluent lagoon projects.
In North America, California drives RNG demand via LCFS, while Canada's provincial carbon taxes have triggered a dozen new projects in British Columbia and Quebec. Mexico adds capacity mainly for on-site steam in food factories because of limited pipeline access. South America and the Middle East & Africa remain small but are logging pilot projects in Brazil's sugar sector and the UAE's waste-to-energy build-out.
- EnviTec Biogas AG
- PlanET Biogas Group
- BTS Biogas SRL
- BioConstruct GmbH
- Scandinavian Biogas
- Nature Energy Biogas
- Bright Biomethane
- Anaergia Inc.
- Hitachi Zosen Inova
- Future Biogas
- Gasum Oy
- Agraferm GmbH
- DMT Environmental Technology
- Schmack Biogas GmbH
- Veolia Environnement
- Air Liquide Biogas Solutions
- ENGIE Biomethane
- Clean Energy Fuels Corp.
- Wartsila (Puregas Solutions)
- Gazpack BV
Additional Benefits:
- The market estimate (ME) sheet in Excel format
- 3 months of analyst support
TABLE OF CONTENTS
1 Introduction
- 1.1 Study Assumptions & Market Definition
- 1.2 Scope of the Study
2 Research Methodology
3 Executive Summary
4 Market Landscape
- 4.1 Market Overview
- 4.2 Market Drivers
- 4.2.1 Government incentives & renewable-energy targets
- 4.2.2 Rising organic-waste generation & landfill-diversion mandates
- 4.2.3 Decarbonisation mandates for transportation bio-fuels (RNG / Bio-CNG)
- 4.2.4 Carbon-negative bio-fertiliser demand (digestate valorisation)
- 4.2.5 Corporate RNG procurement via virtual pipelines & certificates
- 4.2.6 Bio-LNG demand for emerging green maritime corridors
- 4.3 Market Restraints
- 4.3.1 High upfront CAPEX of anaerobic-digestion plants
- 4.3.2 Feedstock supply-chain seasonality & logistics complexity
- 4.3.3 Grid-injection bottlenecks & gas-quality compliance costs
- 4.3.4 Local opposition due to odour / heavy-vehicle traffic (NIMBY)
- 4.4 Supply-Chain Analysis
- 4.5 Regulatory Landscape
- 4.6 Technological Outlook
- 4.7 Porters Five Forces
- 4.7.1 Threat of New Entrants
- 4.7.2 Bargaining Power of Suppliers
- 4.7.3 Bargaining Power of Buyers
- 4.7.4 Threat of Substitutes
- 4.7.5 Competitive Rivalry
5 Market Size & Growth Forecasts
- 5.1 By Feedstock
- 5.1.1 Agricultural Residues
- 5.1.2 Animal Manure
- 5.1.3 Food and Kitchen Waste
- 5.1.4 Sewage Sludge
- 5.1.5 Industrial Organic Waste
- 5.1.6 Energy Crops (e.g., maize silage, sorghum)
- 5.2 By Technology
- 5.2.1 Wet Anaerobic Digestion (CSTR)
- 5.2.2 Dry/High-Solids Digestion
- 5.2.3 Two-Stage/Co-digestion Systems
- 5.2.4 Lagoon/Covered-lagoon AD
- 5.3 By Plant Scale
- 5.3.1 Farm-scale (Below 250 kW)
- 5.3.2 Medium (250 kW to1 MW)
- 5.3.3 Utility-scale (Above 1 MW)
- 5.4 By Application
- 5.4.1 Electricity Generation
- 5.4.2 Heat Only
- 5.4.3 Combined Heat and Power (CHP)
- 5.4.4 Vehicle Fuel (Bio-CNG/Bio-LNG)
- 5.4.5 Pipeline RNG Injection
- 5.4.6 Industrial Steam / Process Heat
- 5.5 By End-User Sector
- 5.5.1 Municipal Utilities
- 5.5.2 Agriculture and Livestock Farms
- 5.5.3 Food and Beverage Manufacturers
- 5.5.4 Waste-management Companies
- 5.5.5 Transport Fuel Distributors
- 5.5.6 Others
- 5.6 By Geography
- 5.6.1 North America
- 5.6.1.1 United States
- 5.6.1.2 Canada
- 5.6.1.3 Mexico
- 5.6.2 Europe
- 5.6.2.1 United Kingdom
- 5.6.2.2 Germany
- 5.6.2.3 France
- 5.6.2.4 Spain
- 5.6.2.5 Nordic Countries
- 5.6.2.6 Russia
- 5.6.2.7 Rest of Europe
- 5.6.3 Asia-Pacific
- 5.6.3.1 China
- 5.6.3.2 India
- 5.6.3.3 Japan
- 5.6.3.4 South Korea
- 5.6.3.5 ASEAN Countries
- 5.6.3.6 Australia and New Zealand
- 5.6.3.7 Rest of Asia-Pacific
- 5.6.4 South America
- 5.6.4.1 Brazil
- 5.6.4.2 Argentina
- 5.6.4.3 Colombia
- 5.6.4.4 Rest of South America
- 5.6.5 Middle East and Africa
- 5.6.5.1 United Arab Emirates
- 5.6.5.2 Saudi Arabia
- 5.6.5.3 South Africa
- 5.6.5.4 Egypt
- 5.6.5.5 Rest of Middle East and Africa
- 5.6.1 North America
6 Competitive Landscape
- 6.1 Market Concentration
- 6.2 Strategic Moves (M&A, Partnerships, PPAs)
- 6.3 Market Share Analysis (Market Rank/Share for key companies)
- 6.4 Company Profiles (includes Global level Overview, Market level overview, Core Segments, Financials as available, Strategic Information, Products & Services, and Recent Developments)
- 6.4.1 EnviTec Biogas AG
- 6.4.2 PlanET Biogas Group
- 6.4.3 BTS Biogas SRL
- 6.4.4 BioConstruct GmbH
- 6.4.5 Scandinavian Biogas
- 6.4.6 Nature Energy Biogas
- 6.4.7 Bright Biomethane
- 6.4.8 Anaergia Inc.
- 6.4.9 Hitachi Zosen Inova
- 6.4.10 Future Biogas
- 6.4.11 Gasum Oy
- 6.4.12 Agraferm GmbH
- 6.4.13 DMT Environmental Technology
- 6.4.14 Schmack Biogas GmbH
- 6.4.15 Veolia Environnement
- 6.4.16 Air Liquide Biogas Solutions
- 6.4.17 ENGIE Biomethane
- 6.4.18 Clean Energy Fuels Corp.
- 6.4.19 Wartsila (Puregas Solutions)
- 6.4.20 Gazpack BV
7 Market Opportunities & Future Outlook
- 7.1 White-space & Unmet-need Assessment
- 7.2 Emerging Financing Models (green bonds, blended finance)
- 7.3 Circular-economy Integration Opportunities
- 7.4 Digestate-based Biofertiliser Commercialisation
- 7.5 Pathways to Negative-emission Credits
 沼氣提純設備市場-全球產業規模、佔有率、趨勢、機會、預測:按技術、應用、地區和競爭格局分類,2021-2031年
 沼氣發電市場預測至2034年:按原料、技術、應用、最終用戶和地區分類的全球分析
 沼氣市場:依原料、技術、應用和規模分類-2026-2032年全球市場預測沼氣改良市場:技術、解決方案、服務、原料、工廠產能、最終用途-2026-2032年全球預測
 2026年全球廢棄物衍生沼氣市場報告2026年全球沼氣市場報告生質氣化發電系統市場:按原料類型、技術、工廠容量、壓力和最終用戶分類的全球預測,2026-2032年
 2026-2030年全球沼氣市場
 沼氣市場規模、佔有率和成長分析(按原料、來源、技術、應用、最終用途和地區分類)-2026-2033年產業預測
 沼氣:市場佔有率分析、產業趨勢與統計、成長預測(2026-2031)