


 |
市場調查報告書
商品編碼
2083125
沼氣氣體純化技術市場機會、成長要素、產業趨勢分析及2026-2035年預測。Biogas Upgrading Technology Market Opportunity, Growth Drivers, Industry Trend Analysis, and Forecast 2026 - 2035 |
||||||

全球沼氣氣體純化技術市場預計到 2025 年將達到 20 億美元,並以 11.2% 的複合年成長率成長至 59 億美元。
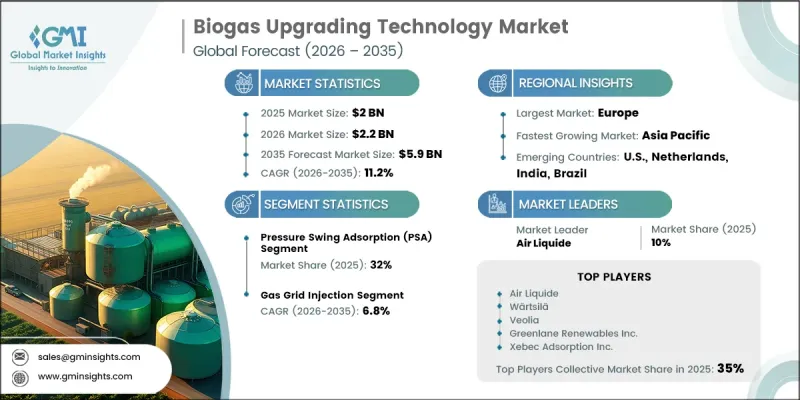
沼氣氣體純化技術市場的成長主要受技術應用模式演變和向新興區域市場擴張的驅動。歐洲、北美以及亞太地區部分國家的政府已推出可再生氣體目標和生物甲烷生產義務,從而創造了對淨化能力的長期需求。這些政策措施降低了專案開發商的商業性不確定性,同時刺激了包括淨化設施和系統安裝在內的整個價值鏈的投資。此外,排碳權、可再生氣體認證體係以及企業永續發展措施的日益融合,也為專案營運商創造了新的商機。收入前景的改善和財務回報的提高,增強了專案的可行性,並鼓勵加大對中大型生物甲烷淨化設施的資本投資。隨著全球可再生能源的普及速度持續加快,預計氣體純化技術市場將在整個預測期內受益於持續的需求和有利的法規環境。
| 市場範圍 | |
|---|---|
| 開始年份 | 2025 |
| 預測期 | 2026-2035 |
| 上市時的市場規模 | 20億美元 |
| 預測金額 | 59億美元 |
| 複合年成長率 | 11.2% |
預計到2025年,變壓式吸附(PSA)技術將佔據32%的市場佔有率,並在2035年之前以8.9%的複合年成長率成長。該技術利用特殊吸附劑,透過週期性的壓力波動過程將二氧化碳從甲烷中分離出來,無需添加任何化學添加劑,即可獲得純度高達96%至99%的甲烷。由於其運作可靠性高、擴充性,且能夠提供高品質的可再生氣體,PSA系統已被廣泛應用於各種生物甲烷生產領域。對高效氣體分離技術的持續投資預計將鞏固該技術在全球市場的領先地位。
至2025年,天然氣網注入領域將佔據39.7%的市場佔有率,並在2026年至2035年間以6.8%的複合年成長率成長。此應用可將粗沼氣純化升級為符合天然氣輸送和發行網路品質標準的生物甲烷。有利的法律規範、便利的網路存取政策和獎勵措施推動了天然氣管網注入計畫的廣泛應用。因此,對於許多尋求穩定、長期市場機會的大型生物甲烷生產設施而言,這種方法已成為一條極具吸引力的商業性途徑。
預計到2025年,北美沼氣氣體純化技術市佔率將達到22%,並在2035年之前以11.5%的複合年成長率成長。該地區市場成長的驅動力包括可再生燃料政策、對低碳能源基礎設施投資的增加以及對可再生天然氣需求的不斷成長。旨在促進可再生燃料生產的獎勵計劃不斷提高項目的經濟可行性,並推動提煉設施的建設。該地區對排放、能源多元化和永續替代燃料的高度重視預計將在未來十年內保持投資動能並推動市場成長。
目錄
第1章:調查方法和範圍
第2章執行摘要
第3章 行業洞察
- 產業生態系分析
- 原料及沼氣生產層
- 技術和設備等級的升級
- 氣體調節和壓縮層
- 最終用途和分銷管道
- 監理情勢
- 影響產業的因素
- 促進因素
- 加強強制性可再生能源使用
- 生物甲烷作為一種低碳燃料的需求日益成長
- 排碳權計畫、綠色氣體來源保證以及企業自願脫碳的需求
- 產業潛在風險與挑戰
- 高資本密集度及長投資回收期
- 促進因素
- 成長潛力分析
- 波特的分析
- PESTLE分析
- 人工智慧和生成式人工智慧對市場的影響
- 利用人工智慧改造現有經營模式
- 生成式人工智慧的應用案例與實施藍圖
- 人工智慧在沼氣營運的風險、限制與監管考量
- 投資與資金籌措分析
- 私募股權和創業投資的投資趨勢
- 政府津貼、補貼和獎勵
第4章 競爭情勢
- 介紹
- 企業市佔率分析:按地區分類
- 北美洲
- 歐洲
- 亞太地區
- 中東和非洲
- 拉丁美洲
- 主要市場公司的競爭分析
- 競爭定位矩陣
- 主要進展
- 併購
- 夥伴關係和聯盟
- 新產品發布
- 業務拓展計劃及資金籌措
- 按公司規模進行基準測試
- 排名分類標準與遴選標準
- 按銷售額、地區和創新能力分類的層級定位矩陣。
第5章 市場規模及預測:依技術分類,2022-2035年
- 水洗
- 化學洗滌
- 變壓式吸附(PSA)
- 膜分離
- 低溫分離
- 其他
第6章 市場規模及預測:依原料分類,2022-2035年
- 農業殘餘物和能源作物
- 牲畜糞便
- 食物和有機廢棄物
- 污水污泥
- 垃圾掩埋沼氣
- 其他
第7章 市場規模及預測:依應用領域分類,2022-2035年
- 注入天然氣網
- 運輸燃料
- 電力和火力發電
- 生物甲烷填充和工業用途
- 其他
第8章 市場規模及預測:依地區分類,2022-2035年
- 北美洲
- 美國
- 加拿大
- 墨西哥
- 歐洲
- 德國
- 英國
- 法國
- 荷蘭
- 義大利
- 亞太地區
- 中國
- 印度
- 日本
- 韓國
- 澳洲
- 中東和非洲
- UAE
- 南非
- 拉丁美洲
- 巴西
- 阿根廷
第9章:公司簡介
- Air Liquide
- Anaergia Inc.
- Bio Energy
- Bright Renewables
- CarboTech AC GmbH
- DMT Clear Gas Solutions LLC
- Ennox Biogas Technology GmbH
- EnviTec Biogas
- Evonik Industries
- FNX LNG
- GMT Membrantechnik GmbH
- Greenlane Renewables Inc.
- Kanadevia Inova AG
- Malmberg Group
- Memsys GmbH
- Pentair plc
- Prodeval
- Veolia
- Wartsila
- Xebec Adsorption Inc.
The Global Biogas Upgrading Technology Market was valued at USD 2 billion in 2025 and is estimated to grow at a CAGR of 11.2% to reach USD 5.9 billion.
Growth in the biogas upgrading technology market is fueled by evolving technology adoption patterns and expanding deployment across new geographic markets. Governments across Europe, North America, and selected Asia-Pacific countries are implementing renewable gas targets and biomethane production mandates that are creating long-term demand for upgrading capacity. These policy initiatives are reducing commercial uncertainty for project developers while encouraging investment throughout the value chain, including upgrading equipment and system installations. In addition, the increasing integration of carbon credit mechanisms, renewable gas certification systems, and corporate sustainability commitments is generating additional revenue opportunities for project operators. Enhanced revenue visibility and stronger financial returns are improving project viability, supporting greater capital investment in both medium- and large-scale biomethane upgrading facilities. As renewable energy adoption continues to accelerate globally, the biogas upgrading technology market is expected to benefit from sustained demand and favorable regulatory conditions throughout the forecast period.
| Market Scope | |
|---|---|
| Start Year | 2025 |
| Forecast Year | 2026-2035 |
| Start Value | $2 Billion |
| Forecast Value | $5.9 Billion |
| CAGR | 11.2% |
The pressure swing adsorption (PSA) segment held a 32% share in 2025 and is projected to grow at a CAGR of 8.9% through 2035. This technology separates carbon dioxide from methane through cyclical pressure-based processes utilizing specialized adsorption materials, enabling methane purity levels ranging from 96% to 99% without the use of chemical additives. PSA systems have achieved widespread adoption across biomethane production applications due to their operational reliability, scalability, and ability to deliver high-quality renewable gas output. Continued investment in efficient gas separation technologies is expected to support the segment's strong position within the global market.
The gas grid injection segment held a 39.7% share in 2025, advancing at a CAGR of 6.8% during 2026-2035. This application involves upgrading raw biogas into biomethane that meets required quality standards for integration into natural gas transmission and distribution networks. Supportive regulatory frameworks, favorable network access policies, and incentive programs have encouraged widespread adoption of grid injection projects. As a result, this pathway has become the preferred commercial route for many large-scale biomethane production facilities seeking stable long-term market opportunities.
North America Biogas Upgrading Technology Market accounted for 22% share in 2025 and is projected to grow at a CAGR of 11.5% through 2035. Regional market growth is being supported by renewable fuel policies, increasing investment in low-carbon energy infrastructure, and expanding demand for renewable natural gas. Incentive programs designed to promote renewable fuel production continue to improve project economics and encourage the development of upgrading facilities. The region's strong focus on emissions reduction, energy diversification, and sustainable fuel alternatives is expected to sustain investment momentum and reinforce market growth over the coming decade.
Major companies operating in the global biogas upgrading technology market include Air Liquide, Greenlane Renewables Inc., Pentair plc, Kanadevia Inova AG, DMT Clear Gas Solutions LLC, EnviTec Biogas, Bright Renewables, Malmberg Group, CarboTech AC GmbH, Evonik Industries, and Wartsila. Companies operating in the biogas upgrading technology market are focusing on innovation, strategic partnerships, and geographic expansion to strengthen their competitive position. Significant investments in research and development are enabling market participants to improve upgrading efficiency, enhance methane recovery rates, and reduce operating costs. Many companies are expanding their product portfolios with advanced and scalable solutions designed to meet diverse project requirements. Strategic collaborations with renewable energy developers, utilities, and industrial stakeholders are helping accelerate project deployment and broaden market reach. Firms are also strengthening service capabilities through long-term maintenance agreements, technical support programs, and digital monitoring solutions.
Table of Contents
Chapter 1 Methodology & Scope
- 1.1 Research approach
- 1.2 Quality commitments
- 1.2.1 GMI AI policy & data integrity commitment
- 1.2.1.1 Source consistency protocol
- 1.2.1 GMI AI policy & data integrity commitment
- 1.3 Research trail & confidence scoring
- 1.3.1 Research trail components
- 1.3.2 Scoring components
- 1.4 Data collection
- 1.4.1 Partial list of primary sources
- 1.5 Data mining sources
- 1.5.1 Paid sources
- 1.5.1.1 Sources, by region
- 1.5.1 Paid sources
- 1.6 Base estimates and calculations
- 1.6.1 Base year calculation for any one approach
- 1.7 Market estimates & forecasts parameters
- 1.8 Forecast model
- 1.8.1 Quantified market impact analysis
- 1.8.1.1 Mathematical impact of growth parameters on forecast
- 1.8.1 Quantified market impact analysis
- 1.9 Research transparency addendum
- 1.9.1 Source attribution framework
- 1.9.2 Quality assurance metrics
- 1.9.3 Our commitment to trust
- 1.10 Market definitions
Chapter 2 Executive Summary
- 2.1 Industry synopsis, 2022 - 2035
- 2.1.1 Business trends
- 2.1.2 Technology trends
- 2.1.3 Feedstock trends
- 2.1.4 Application trends
- 2.1.5 Regional trends
Chapter 3 Industry Insights
- 3.1 Industry ecosystem analysis
- 3.1.1 Feedstock & biogas production layer
- 3.1.2 Upgrading technology & equipment layer
- 3.1.3 Gas conditioning & compression layer
- 3.1.4 End-use & distribution layer
- 3.2 Regulatory landscape
- 3.3 Industry impact forces
- 3.3.1 Growth drivers
- 3.3.1.1 Tightening renewable energy mandates
- 3.3.1.2 Rising demand for biomethane as low-carbon fuel
- 3.3.1.3 Carbon credit programmes, green gas guarantees of origin & voluntary corporate decarbonization demand
- 3.3.2 Industry pitfalls and challenges
- 3.3.2.1 High capital intensity & extended payback periods
- 3.3.1 Growth drivers
- 3.4 Growth potential analysis
- 3.5 Porter's analysis
- 3.5.1 Bargaining power of suppliers
- 3.5.2 Bargaining power of buyers
- 3.5.3 Threat of new entrants
- 3.5.4 Threat of substitute
- 3.5.5 Intensity of competitive rivalry
- 3.6 PESTEL analysis
- 3.6.1 Political factors
- 3.6.2 Economic factors
- 3.6.3 Social factors
- 3.6.4 Technological factors
- 3.6.5 Environmental factors
- 3.6.6 Legal factors
- 3.7 Impact of AI and generative AI on the market (Driven by primary research)
- 3.7.1 AI-driven disruption of existing business model
- 3.7.2 GenAI use cases & adoption roadmap
- 3.7.3 Risks, limitations & regulatory considerations for AI in biogas operations
- 3.8 Investment & funding analysis (Driven by primary research)
- 3.8.1 Private equity & venture capital investment trends
- 3.8.2 Government grants, subsidies & incentive programmes
Chapter 4 Competitive Landscape, 2026
- 4.1 Introduction
- 4.2 Company market share analysis, by region, 2025
- 4.2.1 North America
- 4.2.2 Europe
- 4.2.3 Asia Pacific
- 4.2.4 Middle East & Africa
- 4.2.5 Latin America
- 4.3 Competitive analysis of major market players
- 4.4 Competitive positioning matrix
- 4.5 Key developments
- 4.5.1 Mergers & acquisitions
- 4.5.2 Partnerships & collaborations
- 4.5.3 New product launches
- 4.5.4 Expansion plans and funding
- 4.6 Company tier benchmarking
- 4.6.1 Tier classification criteria & qualifying thresholds
- 4.6.2 Tier positioning matrix by revenue, geography & innovation
Chapter 5 Market Size and Forecast, By Technology, 2022 - 2035 (USD Million)
- 5.1 Key trends
- 5.2 Water scrubbing
- 5.3 Chemical scrubbing
- 5.4 Pressure Swing Adsorption (PSA)
- 5.5 Membrane separation
- 5.6 Cryogenic separation
- 5.7 Others
Chapter 6 Market Size and Forecast, By Feedstock, 2022 - 2035 (USD Million)
- 6.1 Key trends
- 6.2 Agricultural residues & energy crops
- 6.3 Animal manure
- 6.4 Food & organic waste
- 6.5 Sewage sludge
- 6.6 Landfill gas
- 6.7 Others
Chapter 7 Market Size and Forecast, By Application, 2022 - 2035 (USD Million)
- 7.1 Key trends
- 7.2 Gas grid injection
- 7.3 Transportation fuel
- 7.4 Electricity & heat generation
- 7.5 Biomethane bottling & industrial use
- 7.6 Others
Chapter 8 Market Size and Forecast, By Region, 2022 - 2035 (USD Million)
- 8.1 Key trends
- 8.2 North America
- 8.2.1 U.S.
- 8.2.2 Canada
- 8.2.3 Mexico
- 8.3 Europe
- 8.3.1 Germany
- 8.3.2 UK
- 8.3.3 France
- 8.3.4 Netherlands
- 8.3.5 Italy
- 8.4 Asia Pacific
- 8.4.1 China
- 8.4.2 India
- 8.4.3 Japan
- 8.4.4 South Korea
- 8.4.5 Australia
- 8.5 Middle East & Africa
- 8.5.1 UAE
- 8.5.2 South Africa
- 8.6 Latin America
- 8.6.1 Brazil
- 8.6.2 Argentina
Chapter 9 Company Profiles
- 9.1 Air Liquide
- 9.2 Anaergia Inc.
- 9.3 Bio Energy
- 9.4 Bright Renewables
- 9.5 CarboTech AC GmbH
- 9.6 DMT Clear Gas Solutions LLC
- 9.7 Ennox Biogas Technology GmbH
- 9.8 EnviTec Biogas
- 9.9 Evonik Industries
- 9.10 FNX LNG
- 9.11 GMT Membrantechnik GmbH
- 9.12 Greenlane Renewables Inc.
- 9.13 Kanadevia Inova AG
- 9.14 Malmberg Group
- 9.15 Memsys GmbH
- 9.16 Pentair plc
- 9.17 Prodeval
- 9.18 Veolia
- 9.19 Wartsila
- 9.20 Xebec Adsorption Inc.

 全球沼氣市場規模、佔有率、趨勢和成長分析報告(2026-2034年)
 2026年全球壓縮沼氣市場報告
 沼氣市場:2026-2032年全球市場預測(依原料、技術、工廠規模、應用及規模分類)沼氣氣體純化市場:依產品、技術、原料、氣源及最終用途分類-2026-2032年全球市場預測
 2026-2030年全球沼氣純化設備市場
 有機沼氣:市場佔有率分析、產業趨勢與統計、成長預測(2026-2031)
 沼氣升級(沼氣提純):技術與全球市場沼氣市場規模、佔有率、成長、全球產業分析、區域趨勢及2026年至2034年預測。
 沼氣提純設備市場-全球產業規模、佔有率、趨勢、機會、預測:按技術、應用、地區和競爭格局分類,2021-2031年
 沼氣發電市場預測至2034年:按原料、技術、應用、最終用戶和地區分類的全球分析