


 |
市場調查報告書
商品編碼
2062449
價格最佳化軟體:市場佔有率分析、產業趨勢與統計、成長預測(2026-2031)Price Optimization Software - Market Share Analysis, Industry Trends & Statistics, Growth Forecasts (2026 - 2031) |
||||||

※ 本網頁內容可能與最新版本有所差異。詳細情況請與我們聯繫。
根據 Mordor Intelligence 預測,價格最佳化軟體的市場規模將從 2025 年的 16.8 億美元和 2026 年的 19.5 億美元成長到 2031 年的 41.7 億美元,2026 年至 2031 年的年複合成長率(CAGR)為 16.06%。
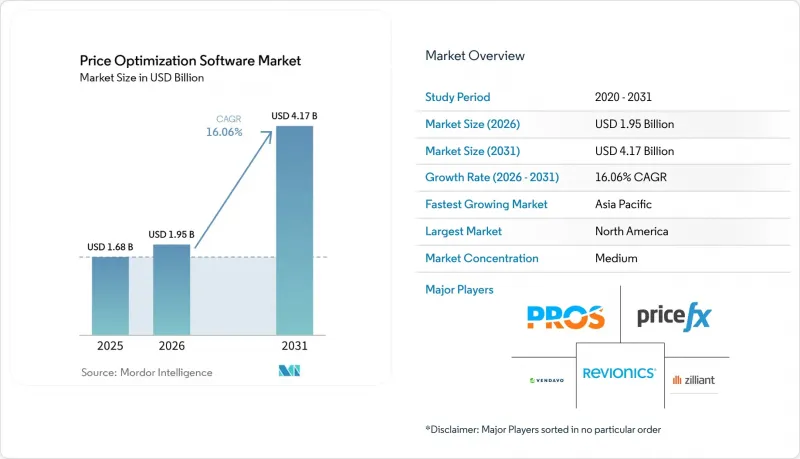
本報告按部署模式(雲端、本地部署、混合部署)、最終用戶行業(零售/電商、製造業等)、定價策略類型(人工智慧驅動的動態定價等)、組織規模(大型企業、中小企業)和地區(北美、歐洲、亞太等)進行細分。市場預測以美元計價。
全球價格優化軟體市場趨勢及洞察
人工智慧驅動的即時動態定價加速了全通路零售的發展。
零售商現在正利用機器學習模型,結合競爭對手定價、庫存水準、天氣預報和微行為訊號,每天多次調整價格。沃爾瑪於2026年3月申請了一項專利,該專利涉及一種神經網路系統,可以同時調整商店和線下門市的價格。同時,克羅格透露,儘管同店銷售持平,但人工智慧驅動的定價策略提高了其毛利率。根據Feedvisor的報告顯示,亞馬遜和沃爾瑪的電商平台每年進行超過4,600萬次價格更新,證明持續最佳化優於每週一次的基於規則的調整。強化學習引擎現在能夠揭示電子表格無法檢測到的非線性價格彈性,例如每個設備的購物車放棄趨勢。將電子貨架標籤與電商平台上的產品清單同步,可以防止透過「展示廳現象」進行套利,並維護跨通路的品牌形象。
雲端原生 SaaS 模式降低了整體擁有成本並加速了採用。
訂閱模式無需資本投資和專用基礎設施,讓財富 500 強以外的公司也能輕鬆進入價格最佳化軟體市場。 Pricefx Copilot 於 2026 年 1 月發布,它透過預先建置的 API 與 SAP、Salesforce 和 Microsoft Dynamics 整合,將部署時間縮短至 8-12 週,與本地部署相比,生命週期成本降低約 40%。 Zilliant 的「Pricing Plus」於 2025 年 11 月發布,它將價格最佳化、交易指導和 CPQ 整合到單一許可證中,使中型製造商無需聘請專業分析師。 Vendavo 的「AI 定價助理」於 2026 年 4 月發布,基於 SAP 商業技術平台,確保以 SAP 為中心的公司升級時的安全連接。供應商正在 SaaS 計劃中獨家提供高級 AI 功能,進一步加速向雲端遷移。
主資料品質不佳和系統孤立會阻礙投資報酬率。
定價模型依賴詳細的成本、競爭對手和客戶數據,然而許多公司卻將產品、客戶和折扣資訊分散儲存在互不相容的ERP和CRM系統中。美國聯邦貿易委員會(FTC)在2025年1月進行的一項價格監測調查發現,仲介業者通常需要手動核對不完整的數據,從而削弱了自動化帶來的速度優勢。 Model N的一項調查發現,85%的高階主管認為資料品質是實現價值的最大障礙。缺少SKU級別的成本、經折扣調整後的盈利或區域競爭對手定價信息,可能會使實施週期延長長達六個月,並需要企業通常缺乏的跨職能管治。
細分市場分析
到2025年,雲端採用將佔價格最佳化軟體市場63.7%的佔有率,預計到2031年,該細分市場將以17.1%的複合年成長率成長。價格最佳化軟體市場規模的主導地位源於訂閱模式、自動升級以及無需本地硬體即可部署生成的AI模組的能力。由於在本地環境中實現同等功能的成本過高,供應商正透過SaaS許可分階段提供尖端功能。
混合架構允許將敏感資料儲存在私有伺服器上,同時在雲端進行機器學習訓練,Vendavo 透過 SAP 商業技術平台支援此模式。在國防和監管嚴格的金融領域,本地部署預計仍將繼續,但隨著歐洲和亞太地區主權雲的擴展,人們對資料居住的擔憂正在緩解。這些趨勢共同推動了雲端在價格最佳化軟體市場中佔有率的成長。
預計到2025年,人工智慧驅動的動態引擎將佔據47.4%的市場佔有率,反映出零售商和市場平台正在採用強化學習方法。然而,在利潤率較低且受監管限制的行業,基於規則的保障措施仍然至關重要,以確保演算法在探索價格彈性時能夠合規運作。基於使用量和訂閱混合模式預計將以17.9%的複合年成長率快速成長,這表明隨著供應商將收入與實際使用量掛鉤,市場結構正在轉變。
隨著SaaS和API供應商從固定費率授權模式轉向基於使用量的模式,基於計量收費的定價最佳化軟體市場將持續擴大。沃爾瑪的專利將基於神經網路的預測與嚴格的約束條件相結合,展示了最佳實踐架構如何將人工智慧的敏捷性與業務規則融合。混合管治框架使B2B製造商能夠在遵守協商合約限制的同時利用預測指導,從而在保持信任的同時提高實際利潤率。
區域分析
預計到2025年,北美將佔全球收入的36.6%,這主要得益於早期應用和關鍵供應商的存在。 PROS報告稱,2025年第三季訂閱收入達7,600萬美元,證實了該地區對SaaS模式的偏好。美國聯邦貿易委員會(FTC)和司法部對演算法租金調整和監管定價的調查增加了合規成本,迫使供應商引入可解釋性和審計追蹤機制。儘管存在監管摩擦,但對人工智慧和雲端基礎設施的持續投資仍使美國保持在價格最佳化軟體市場創新領域的中心地位。
在歐洲,強勁的需求與嚴格的管治並存。 2025年7月,歐盟委員會確認多項卡特爾調查與演算法定價有關,英國競爭與市場管理局(CMA)也任命了一位新的技術長來監管數位化合作。同時,歐盟的碳邊境調節機制(CBAM)正在為供應商創造新的應用場景,使其能夠計算包含碳排放成本在內的運輸成本。提供透明、可審計且具備碳排放調節能力的模式的供應商正在歐盟內部建立競爭優勢。主權雲端和資料在地化框架的採用正在緩解人們對SaaS應用的擔憂,而公共雲端的應用也正逐步成為主流。
亞太地區是成長最快的市場,預計到2031年將以16.9%的複合年成長率成長。中國和印度的電商平台為了應對激烈的市場競爭,每小時多次更新價格,這推動了對強化學習引擎的需求。日本、韓國和東協的製造商正在採用價格最佳化來管理全球銷售管道並應對原料成本的波動。雖然中國的《個人資訊保護法》等資料保護制度規定了確保透明度的義務,但其監管力度不如歐洲標準,這為供應商提供了快速擴張的空間。東南亞新興經濟體的崛起,以及跨境市場的擴張,使該地區成為價格最佳化軟體市場最大的成長引擎。
其他好處:
- Excel格式的市場預測(ME)表
- 3個月的分析師支持
目錄
第1章:引言
- 研究假設和市場定義
- 調查範圍
第2章:調查方法
第3章執行摘要
第4章 市場狀況
- 市場概覽
- 市場促進因素
- 人工智慧驅動的即時動態定價加速了全通路零售的發展。
- 雲端原生 SaaS 模式顯著降低了整體擁有成本,並加速了用戶採用。
- 由於通貨膨脹導致利潤率承壓,演算法定價已成為董事會的優先事項。
- 端到端的CPQ和電子商務整合能夠創造收入綜效。
- GenAI 賦能的定價策略能夠提升銷售採納率和談判結果。
- 碳排放調整定價演算法在對環境、社會和治理(ESG)較為敏感的行業中正變得越來越普遍。
- 市場限制因素
- 主資料品質不佳和系統孤立正在阻礙投資回報率。
- 文化上對演算法價格變動的抵觸情緒延緩了演算法價格變動的普及。
- 對演算法串謀的擔憂正在引發反壟斷審查和自我規範。
- 在需求波動劇烈的時期,模型預測在極端情況下出現失誤會削弱經營團隊的信心。
- 宏觀經濟因素對市場的影響
- 產業價值與價值鏈分析
- 監理情勢
- 技術展望
- 波特五力分析
第5章 市場規模與成長預測
- 按部署模式
- 雲
- 現場
- 混合
- 產業最終用途
- 零售與電子商務
- 製造業
- 運輸/物流
- 金融服務
- 其他終端用戶產業
- 按定價策略類型
- 人工智慧驅動的動態定價
- 基於規則的動態定價
- 價格最佳化
- 促銷最佳化
- 按組織規模
- 大公司
- 中小企業
- 按地區
- 北美洲
- 美國
- 加拿大
- 墨西哥
- 歐洲
- 德國
- 英國
- 法國
- 義大利
- 其他歐洲國家
- 亞太地區
- 中國
- 日本
- 印度
- 韓國
- 澳洲
- 其他亞太國家
- 中東和非洲
- 中東
- 沙烏地阿拉伯
- 阿拉伯聯合大公國
- 其他中東國家
- 非洲
- 南非
- 埃及
- 其他非洲國家
- 中東
- 南美洲
- 巴西
- 阿根廷
- 其他南美國家
- 北美洲
第6章 競爭情勢
- 市場集中度
- 策略趨勢
- 市佔率分析
- 公司簡介
- PROS Holdings, Inc.
- Pricefx AG
- Vendavo, Inc.
- Zilliant, Inc.
- Revionics LLC
- Competera Limited
- Vistaar Technologies, Inc.
- Omnia Retail BV
- Quicklizard Ltd.
- Feedvisor Ltd.
- Open Pricer SAS
- Perfect Price Inc.
- Periscope by McKinsey & Company, Inc.
- Model N, Inc.
- Aptos LLC(Revionics Division)
- IBM Corporation(Watson Dynamic Pricing)
- SAP SE(Price Management Module)
- SPOSEA BV
- Navetti AB(part of Vendavo)
- Yieldigo as
第7章 市場機會與未來展望
According to Mordor Intelligence, the price optimization software market size is projected to expand from USD 1.68 billion in 2025 and USD 1.95 billion in 2026 to USD 4.17 billion by 2031, registering a CAGR of 16.06% between 2026 and 2031.
This report is Segmented by Deployment Model (Cloud, On-Premise, Hybrid), End-Use Industry (Retail and ECommerce, Manufacturing, and More), Pricing Strategy Type (AI-Driven Dynamic Pricing, and More), Organization Size (Large Enterprises, Small and Medium Enterprises), and Geography (North America, Europe, Asia-Pacific, and More). The Market Forecasts are Provided in Terms of Value (USD).
Global Price Optimization Software Market Trends and Insights
AI-Powered Real-Time Dynamic Pricing Accelerates Omnichannel Retail Growth
Retailers now run machine-learning models that ingest competitor prices, inventory levels, weather forecasts, and micro-behavioral signals to adjust prices many times per day. Walmart filed a March 2026 patent describing neural-network systems that change shelf and online prices simultaneously, while Kroger disclosed that AI pricing lifted gross margin even though same-store sales were flat. Feedvisor reports more than 46 million price updates annually on Amazon and Walmart marketplaces, proving that continuous optimization outperforms weekly rule-based changes. Reinforcement-learning engines now surface non-linear elasticities, such as device-specific cart-abandonment tendencies, that spreadsheets cannot detect. Synchronizing electronic shelf labels with marketplace listings prevents showrooming arbitrage and protects brand integrity across channels.
Cloud-Native SaaS Models Slash Total Cost of Ownership and Speed Implementations
Subscription delivery eliminates capital expenditure and dedicated infrastructure, making the price optimization software market accessible to firms beyond the Fortune 500. Pricefx Copilot, launched in January 2026, integrates with SAP, Salesforce, and Microsoft Dynamics via pre-built APIs, cutting deployment time to 8-12 weeks and reducing lifetime ownership costs by around 40% compared with on-premise builds. Zilliant's November 2025 Pricing Plus bundles optimization, deal guidance, and CPQ into a single license, letting mid-market manufacturers avoid hiring specialist analysts. Vendavo's AI Pricing Assistant, released April 2026, rides SAP Business Technology Platform, ensuring upgrade-safe connectivity for SAP-centric enterprises. Vendors reserve advanced AI only for SaaS tiers, further tipping adoption toward cloud.
Poor Master-Data Quality and Siloed Systems Hinder ROI
Pricing models rely on granular cost, competitor, and customer data, yet many firms store products, customers, and discounts in incompatible ERP and CRM silos. The Federal Trade Commission's January 2025 surveillance-pricing study found that intermediaries must often reconcile incomplete feeds manually, eroding the speed advantage of automation. Model N surveys show 85% of executives cite data quality as the top barrier to value realization. Missing SKU-level costs, rebate-adjusted profitability, or localized competitor prices can extend implementation timelines by up to six months and require cross-functional governance that organizations frequently lack.
Other drivers and restraints analyzed in the detailed report include:
- Inflationary Margin Pressure Makes Algorithmic Pricing a Board Priority
- End-to-End CPQ and eCommerce Integration Unlocks Revenue Synergies
- Cultural Resistance to Algorithmic Price Changes Slows Deployment
For complete list of drivers and restraints, kindly check the Table Of Contents.
Segment Analysis
Cloud deployments held 63.7% of the price optimization software market share in 2025, and the segment is expected to grow at a 17.1% CAGR through 2031. The price optimization software market size advantage originates from subscription economics, automatic upgrades, and the ability to roll out generative AI modules without on-premise hardware. Vendors increasingly gate-cutting-edge functions behind SaaS licenses, making parity in on-premise environments cost-prohibitive.
Hybrid architectures preserve sensitive data on private servers while running machine-learning training in the cloud, a pattern Vendavo supports via SAP Business Technology Platform. On-premise installations will persist in defense and highly regulated finance, but sovereign-cloud expansions in Europe and Asia-Pacific are softening data-residency objections. Collectively, these trends fortify the cloud's pathway to an even larger share of the price optimization software market.
AI-driven dynamic engines commanded 47.4% of the 2025 value, reflecting retailer and marketplace adoption of reinforcement-learning approaches. However, rule-based guardrails remain essential in sectors with margin floors or regulatory ceilings, ensuring compliance while algorithms explore elasticities. Usage-based and subscription-hybrid approaches are projected to post the fastest expansion at 17.9% CAGR, signaling a structural shift as vendors align revenue with actual utilization.
The price optimization software market size tied to usage billing will grow as more SaaS and API businesses migrate from flat-fee licenses to consumption-based models. Walmart's patent blends neural forecasts with hard constraints, highlighting that best-practice architectures merge AI agility with business rules. Hybrid governance frameworks allow B2B manufacturers to leverage predictive guidance while respecting negotiated contract limits, maintaining trust while boosting realized margins.
Geography Analysis
North America contributed 36.6% of 2025 revenue, sustained by early adoption and the presence of leading vendors. PROS reported USD 76 million in subscription revenue during Q3 2025, underscoring the region's tilt to SaaS pros.com. Federal Trade Commission and Department of Justice investigations into algorithmic rent coordination and surveillance pricing are increasing compliance costs, forcing vendors to embed explainability and audit trails. Despite regulatory friction, continuous investment in AI and cloud infrastructure keeps the United States an innovation nucleus for the price optimization software market.
Europe combines strong demand with stringent governance. The European Commission confirmed in July 2025 that multiple cartel probes involve algorithmic pricing, and the UK Competition and Markets Authority has added a chief technologist to police digital coordination. Simultaneously, the EU Carbon Border Adjustment Mechanism creates fresh use cases for suppliers calculating carbon-inclusive landed costs. Vendors offering transparent, auditable models with carbon adjustments gain a competitive foothold across the bloc. Sovereign-cloud rollouts and data-localization frameworks are tempering objections to SaaS adoption, gradually tipping more deals toward public-cloud deployment.
Asia-Pacific is the fastest growing, forecast to expand at a 16.9% CAGR through 2031. E-commerce platforms in China and India update prices several times per hour to manage intense marketplace competition, driving demand for reinforcement-learning engines. Japan, South Korea, and ASEAN manufacturers deploy price optimization to manage global channels and volatile input costs. While data-protection regimes such as China's Personal Information Protection Law introduce transparency obligations, they remain less restrictive than European standards, giving vendors latitude to scale rapidly. Emerging economies in Southeast Asia, coupled with cross-border marketplace expansion, position the territory as the foremost growth engine for the price optimization software market.
- PROS Holdings, Inc.
- Pricefx AG
- Vendavo, Inc.
- Zilliant, Inc.
- Revionics LLC
- Competera Limited
- Vistaar Technologies, Inc.
- Omnia Retail B.V.
- Quicklizard Ltd.
- Feedvisor Ltd.
- Open Pricer SAS
- Perfect Price Inc.
- Periscope by McKinsey & Company, Inc.
- Model N, Inc.
- Aptos LLC (Revionics Division)
- IBM Corporation (Watson Dynamic Pricing)
- SAP SE (Price Management Module)
- SPOSEA B.V.
- Navetti AB (part of Vendavo)
- Yieldigo a.s.
Additional Benefits:
- The market estimate (ME) sheet in Excel format
- 3 months of analyst support
TABLE OF CONTENTS
1 INTRODUCTION
- 1.1 Study Assumptions and Market Definition
- 1.2 Scope of the Study
2 RESEARCH METHODOLOGY
3 EXECUTIVE SUMMARY
4 MARKET LANDSCAPE
- 4.1 Market Overview
- 4.2 Market Drivers
- 4.2.1 AI-Powered Real-Time Dynamic Pricing Accelerates Omnichannel Retail Growth
- 4.2.2 Cloud-Native SaaS Models Slash Total Cost of Ownership and Speed Implementations
- 4.2.3 Inflationary Margin Pressure Makes Algorithmic Pricing a Board Priority
- 4.2.4 End-to-End CPQ and eCommerce Integration Unlocks Revenue Synergies
- 4.2.5 GenAI-Enabled Price Narratives Enhance Sales Adoption and Negotiation Outcomes
- 4.2.6 Carbon-Adjusted Pricing Algorithms Gain Traction in ESG-Sensitive Sectors
- 4.3 Market Restraints
- 4.3.1 Poor Master-Data Quality and Siloed Systems Hinder ROI
- 4.3.2 Cultural Resistance to Algorithmic Price Changes Slows Deployment
- 4.3.3 Algorithmic Collusion Concerns Trigger Antitrust Scrutiny and Self-Regulation
- 4.3.4 Edge-Case Model Failures in Volatile Demand Windows Erode Executive Trust
- 4.4 Impact of Macroeconomic Factors on the Market
- 4.5 Industry Value and Supply-Chain Analysis
- 4.6 Regulatory Landscape
- 4.7 Technological Outlook
- 4.8 Porter's Five Forces Analysis
- 4.8.1 Threat of New Entrants
- 4.8.2 Bargaining Power of Buyers
- 4.8.3 Bargaining Power of Suppliers
- 4.8.4 Threat of Substitutes
- 4.8.5 Competitive Rivalry
5 MARKET SIZE AND GROWTH FORECASTS (VALUE)
- 5.1 By Deployment Model
- 5.1.1 Cloud
- 5.1.2 On-Premise
- 5.1.3 Hybrid
- 5.2 By End-Use Industry
- 5.2.1 Retail and eCommerce
- 5.2.2 Manufacturing
- 5.2.3 Transportation and Logistics
- 5.2.4 Financial Services
- 5.2.5 Other End-Use Industries
- 5.3 By Pricing Strategy Type
- 5.3.1 AI-Driven Dynamic Pricing
- 5.3.2 Rule-Based Dynamic Pricing
- 5.3.3 Markdown Optimization
- 5.3.4 Promotion Optimization
- 5.4 By Organization Size
- 5.4.1 Large Enterprises
- 5.4.2 Small and Medium Enterprises (SMEs)
- 5.5 By Geography
- 5.5.1 North America
- 5.5.1.1 United States
- 5.5.1.2 Canada
- 5.5.1.3 Mexico
- 5.5.2 Europe
- 5.5.2.1 Germany
- 5.5.2.2 United Kingdom
- 5.5.2.3 France
- 5.5.2.4 Italy
- 5.5.2.5 Rest of Europe
- 5.5.3 Asia-Pacific
- 5.5.3.1 China
- 5.5.3.2 Japan
- 5.5.3.3 India
- 5.5.3.4 South Korea
- 5.5.3.5 Australia
- 5.5.3.6 Rest of Asia-Pacific
- 5.5.4 Middle East and Africa
- 5.5.4.1 Middle East
- 5.5.4.1.1 Saudi Arabia
- 5.5.4.1.2 United Arab Emirates
- 5.5.4.1.3 Rest of Middle East
- 5.5.4.2 Africa
- 5.5.4.2.1 South Africa
- 5.5.4.2.2 Egypt
- 5.5.4.2.3 Rest of Africa
- 5.5.4.1 Middle East
- 5.5.5 South America
- 5.5.5.1 Brazil
- 5.5.5.2 Argentina
- 5.5.5.3 Rest of South America
- 5.5.1 North America
6 COMPETITIVE LANDSCAPE
- 6.1 Market Concentration
- 6.2 Strategic Moves
- 6.3 Market Share Analysis
- 6.4 Company Profiles (includes Global Level Overview, Market Level Overview, Core Segments, Financials as available, Strategic Information, Market Rank/Share, Products and Services, Recent Developments)
- 6.4.1 PROS Holdings, Inc.
- 6.4.2 Pricefx AG
- 6.4.3 Vendavo, Inc.
- 6.4.4 Zilliant, Inc.
- 6.4.5 Revionics LLC
- 6.4.6 Competera Limited
- 6.4.7 Vistaar Technologies, Inc.
- 6.4.8 Omnia Retail B.V.
- 6.4.9 Quicklizard Ltd.
- 6.4.10 Feedvisor Ltd.
- 6.4.11 Open Pricer SAS
- 6.4.12 Perfect Price Inc.
- 6.4.13 Periscope by McKinsey & Company, Inc.
- 6.4.14 Model N, Inc.
- 6.4.15 Aptos LLC (Revionics Division)
- 6.4.16 IBM Corporation (Watson Dynamic Pricing)
- 6.4.17 SAP SE (Price Management Module)
- 6.4.18 SPOSEA B.V.
- 6.4.19 Navetti AB (part of Vendavo)
- 6.4.20 Yieldigo a.s.
7 MARKET OPPORTUNITIES AND FUTURE OUTLOOK
- 7.1 White-space and Unmet-Need Assessment

 價格最佳化軟體市場規模、佔有率和成長分析:按部署類型、組織規模、支援的定價模式、應用、最終用戶產業和地區分類-2026-2033年產業預測
 2026年全球景點動態定價市場報告
 價格最佳化軟體市場:按組件、技術、最終用戶產業、部署類型和組織規模分類-2026-2032年全球市場預測
 2026-2030年全球動態定價市場2026年全球價格優化軟體市場報告
 全球智慧收益管理系統市場預測(至2034年):按組件、技術、部署模式、應用、最終用戶和地區分類2026年全球動態定價軟體市場報告動態價格最佳化軟體市場:按公司規模、組件、解決方案類型、最終用戶行業、部署類型和應用分類 - 全球預測(2026-2032 年)動態定價最佳化市場預測(至 2032 年):按組件、部署模型、公司規模、定價策略、應用、最終用戶和地區進行分析
 動態定價與收益管理市場機會、成長動力、產業趨勢分析及 2025 - 2034 年預測