


 |
市場調查報告書
商品編碼
2062077
再生銅:市場佔有率分析、行業趨勢和統計數據、成長預測(2026-2031 年)Recycled Copper - Market Share Analysis, Industry Trends & Statistics, Growth Forecasts (2026 - 2031) |
||||||
※ 本網頁內容可能與最新版本有所差異。詳細情況請與我們聯繫。
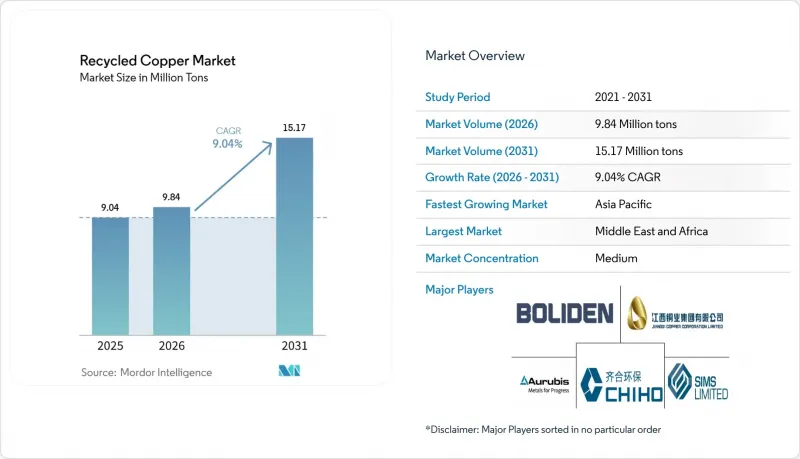
根據 Mordor Intelligence 預測,到 2025 年,再生銅市場規模將達到 904 萬噸,到 2026 年將達到 984 萬噸,到 2031 年將達到 1,517 萬噸,2026 年至 2031 年的複合年成長率為 9.04%。
本報告按銅類型(純銅和銅合金)、原料(廢銅和工業廢料)、加工方法(機械加工、熱冶金加工及其他)、終端用戶產業(電氣和電子產業及其他)以及地區(亞太地區、北美地區及其他)進行細分。市場預測以噸為單位。
全球再生銅市場趨勢及洞察
電動車相關線路和電池集電器的需求強勁。
電池式電動車含有80-91公斤銅,約為內燃機汽車銅含量的三倍。電池組中的集流體可產出純度高達99.99%的銅箔,這些銅箔可透過機械分離回收,電解精煉的能耗僅為原生提煉的60%。預計到2025年,中國將生產950萬輛電動車,這將產生大量延遲報廢的廢料,並在2032年後達到高峰。然而,回收商已簽訂了與倫敦金屬交易所(LME)價格掛鉤的多年期收購契約,並享受固定折扣,從而確保了原料的穩定供應。特斯拉和比亞迪已宣布先導計畫,將回收的集流體銅直接重新整合到新的電池生產線中,進一步加劇了市場供應緊張。歐洲電池法規規定,到2027年,廢棄電池的銅回收率必須達到90%,違規者將面臨最高50萬歐元的罰款,這將刺激歐洲對濕式冶煉的投資。汽車製造商正在重新設計線束,使用單合金連接器,將切碎機後的回收率提高 12 至 15 個百分點,並加強再生銅的供應。
加強歐盟和中國的循環經濟法規
歐盟將於2026年5月生效的廢棄物運輸法規將禁止從2027年起向非經合組織國家出口被歸類為「廢棄物」的銅廢料。這將迫使歐洲的回收商要么加強國內加工能力,要么接受較低的區域價格。相較之下,中國於2025年11月放寬了進口純度規定,並在上海期貨交易所推出了再生金屬期貨合約。因此,儘管有地緣政治關稅,2025年中國廢棄物進口量仍增加至234萬噸。 「REPowerEU」舉措旨在2030年使25%的關鍵礦物來自再生資源,公共採購的評估標準將對經認證的廢料給予每噸150至200歐元的溢價。中國工業和資訊化部(工信部)的指導方針要求主要加工企業到2028年將其再生原料採購比例提高到30%,從而促進國有冶煉廠與私營廢料回收企業之間的合資合作。這些協調一致的措施正在重塑再生銅市場的競爭格局,並給那些沒有可審計的監管鏈系統的回收商帶來壓力。
廢料價格波動給回收公司的利潤率帶來了壓力。
2026年1月,倫敦金屬交易所(LME)銅價創下每噸13,387美元的歷史新高,但到3月份已下跌8%,導致此前以高價購入原料的回收商蒙受損失。小規模加工業者若採用60天採購週期及30天銷售週期,則可能因銅價下跌10%而損失40%的毛利。區域差異進一步加劇了這個問題。歐洲的出口禁令推高了銅價,而東南亞的檢驗措施則抑制了當地價格,使擁有物流優勢的貿易商受益。因此,再生銅市場更有利於那些進行避險和業務多元化的企業,而那些依賴現貨交易的企業則處於劣勢。
細分市場分析
隨著汽車製造商批准在壓鑄件、散熱器和熱交換器中使用回收黃銅和青銅,銅合金市場預計到2031年將以10.12%的複合年成長率成長,顯著超過純銅市場。與陰極生產方法相比,直接將2號廢料摻入合金生產的供應商每噸可節省800至1200美元,以獲得競爭優勢。預計到2026年底,ISO 22965標準的推出將規範合金的化學成分,將認證時間縮短至多六週,並加速北美、歐洲和日本的採用。
2025年,純銅的市佔率維持在58.61%。這主要得益於電力網路電纜、資料中心匯流排和逆變器等對導電率要求高達99.99%的應用領域的需求。與電力公司合作的閉合迴路項目確保廢棄電纜直接送往冶煉廠,從而保持純度並穩定溢價。 Aurobis的目標是到2030年實現陰極銅中50%的再生銅含量,並支持對二次提煉的投資。儘管合金的普及可能會在某些領域降低純銅的需求,但純銅對於高導電性應用仍然至關重要,其在再生銅市場的重要性預計將持續下去。
2025年,廢舊金屬佔供應量的53.45%,預計到2031年,工業廢料將以10.07%的複合年成長率成長,因為加工商採用緊湊型造粒機來確保先前外包的利潤。使用SWEED或CopperMine系統的線材和管道製造商正在生產純度高達99.99%的顆粒,與混合廢料相比,每噸可獲得1000至1400美元的溢價,投資回收期為12至18個月。
廢金屬受益於大規模拆除工程和預期中的電動車電池處置。然而,其成分的異質性導致加工成本增加和認證難題。儘管越南和歐盟的生產者延伸責任制(EPR)框架正在改善回收率,但經銷商網路的分割卻減緩了結算週期。化學成分更為均一的工業廢料透過減少爐渣損失和支持濕式冶煉工藝,正在再生銅市場中佔據越來越大的市場佔有率。
區域分析
預計到2025年,亞太地區將佔再生銅市場佔有率的39.25%。這主要得益於中國進口234萬噸廢銅以及印度龐大的供需缺口。中國的再生金屬期貨合約增強了對沖選擇,而印度鋁業公司(Hindalco)正在一項100億美元的投資計畫下擴大其再生產能。作為加工中心的重要力量,東協正在加強雜質檢測,貿易流向也正轉向經認證的營運商。
中東和非洲是成長最快的地區,預計到2031年複合年成長率將達到10.09%。阿曼投資1.06億美元的工廠(預計到2026年產能將擴大至1.2萬噸)以及沙烏地阿拉伯1000億美元的礦業舉措都為該地區的發展提供了支撐。區域電網預計到2035年將擴張40%,將延緩廢鋼的供應。同時,中國和歐洲的冶煉廠正在規劃建造混合廢鋼預洗中心,以便出口。
在北美,美國的關稅措施增加了廢料流入該國的量,維持了國內的利潤率,與此同時,Sims Limited公司正在全部區域升級其分類生產線。在歐洲,不斷上漲的電價和2027年即將生效的廢棄物出口禁令帶來了短期挑戰,但對認證原料的長期需求仍然強勁。南美洲的市佔率小規模,但巴西於2025年獲準的12吉瓦可再生能源計畫已使該國成為未來的成長區域,這反映了再生銅市場地域格局重新平衡的趨勢。
其他好處
- Excel格式的市場預測(ME)表
- 3個月的分析師支持
目錄
第1章:引言
- 研究假設和市場定義
- 調查範圍
第2章:調查方法
第3章執行摘要
第4章 市場狀況
- 市場概覽
- 市場促進因素
- 電動車相關線路和電池集電器的需求強勁。
- 加強歐盟和中國的循環經濟法規
- 回收商可使用的銅價避險工具
- OEM主導的壓鑄合金閉合迴路認證
- 人工智慧驅動的廢料分類正在提高高品質回收率。
- 市場限制因素
- 廢料價格波動給回收商的利潤率帶來了壓力。
- 混合銅流中質量和污染的變化
- 基於區塊鏈的「綠色銅纜」認證高成本
- 價值鏈分析
- 波特五力模型
第5章 市場規模與成長預測
- 銅型
- 純銅
- 銅合金
- 按原料
- 廢棄物
- 工業廢料
- 透過加工方法
- 機械加工
- 熱冶金處理
- 濕冶金
- 熱水和濕法結合的工藝
- 按最終用途行業分類
- 電氣和電子行業
- 建築/施工
- 運輸
- 工業設備
- 消費品
- 其他終端用戶產業(電信等)
- 按地區
- 亞太地區
- 中國
- 日本
- 印度
- 韓國
- ASEAN
- 其他亞太國家
- 北美洲
- 美國
- 加拿大
- 墨西哥
- 歐洲
- 德國
- 英國
- 法國
- 義大利
- 西班牙
- 俄羅斯
- 北歐國家
- 其他歐洲國家
- 南美洲
- 巴西
- 阿根廷
- 其他南美國家
- 中東和非洲
- 沙烏地阿拉伯
- 南非
- 其他中東和非洲國家
- 亞太地區
第6章 競爭情勢
- 市場集中度
- 策略趨勢
- 市佔率和排名分析
- 公司簡介
- Aurubis AG
- Boliden Group
- Calbag Metals Co.
- Chiho Environmental Group Limited
- CMC
- CRONIMET Holding GmbH
- Dowa Holdings Co., Ltd.
- European Metal Recycling Ltd.
- Glencore plc
- Gravita India Ltd.
- Hindalco Industries Ltd.
- Jiangxi Copper Company Limited
- Korea Zinc Co.(Sun Metals)
- Kuusakoski Oy
- Mitsubishi Materials Corporation
- OmniSource LLC
- Schnitzer Steel Industries, Inc.
- Sims Limited
- TSR Recycling GmbH & Co. KG
- Umicore
- Wieland-Werke AG
第7章 市場機會與未來展望
According to Mordor Intelligence, the recycled copper market size is projected to be 9.04 Million tons in 2025, 9.84 Million tons in 2026, and reach 15.17 Million tons by 2031, growing at a CAGR of 9.04% from 2026 to 2031.
This report is Segmented by Copper Type (Pure Copper and Copper Alloys), Source (Post-Consumer Scrap and Industrial Scrap), Process (Mechanical, Pyrometallurgical, and More), End-User Industry (Electrical and Electronics, and More), and Geography (Asia-Pacific, North America, and More). The Market Forecasts are Provided in Terms of Volume (Tons).
Global Recycled Copper Market Trends and Insights
Robust Demand from EV-Related Wiring and Battery Collectors
Battery electric vehicles contain 80-91 kg of copper, nearly three times the amount in internal combustion engine vehicles. Battery-pack current collectors yield 99.99%-purity copper foil, which can be mechanically liberated and electro-refined at 60% of the energy cost of primary smelting. China's production of 9.5 million EVs in 2025 is expected to generate a deferred scrap wave maturing after 2032. However, recyclers are already securing multi-year offtake agreements indexed to LME prices minus fixed discounts, ensuring feedstock availability. Tesla and BYD have disclosed pilot projects that reintegrate recovered collector copper directly into new cell lines, tightening merchant supply. The European Battery Regulation mandates 90% copper recovery from waste batteries by 2027, with non-compliance fines of up to EUR 500,000, driving hydrometallurgical investments in EUROPE. Automakers are redesigning harnesses with single-alloy connectors, improving post-shred yields by 12-15 percentage points, and enhancing recycled copper supply.
Growing Circular-Economy Mandates in the EU and China
The EU Waste Shipment Regulation, effective May 2026, bans copper scrap exports labeled as waste to non-OECD destinations starting in 2027. This forces European collectors to enhance domestic processing capabilities or accept lower regional prices. In contrast, China relaxed import purity rules in November 2025 and introduced a recycled-metals futures contract on the Shanghai Futures Exchange, increasing imported scrap to 2.34 million tons in 2025 despite geopolitical tariffs. The REPowerEU initiative targets 25% of critical minerals from recycled content by 2030, with public procurement scorecards awarding premiums of EUR 150-200 per ton for certified scrap. China's MIIT guidelines require major fabricators to source 30% secondary feed by 2028, fostering joint ventures between state-owned smelters and private scrap aggregators. These synchronized policies are reshaping the competitive landscape of the recycled copper market, pressuring recyclers without an auditable chain-of-custody system.
Scrap-Price Volatility Compressing Recycler Margins
In January 2026, LME copper reached a record USD 13,387 per ton before falling 8% by March, leaving recyclers who locked in high-priced feed with negative margins. Small processors operating on 60-day purchase terms and 30-day sales terms risk losing 40% of gross margins if prices drop by 10%. Regional disparities exacerbate challenges: export bans keep European prices elevated, while Southeast Asian inspections suppress local values, benefiting logistics-advantaged traders. The recycled copper market thus rewards hedged and diversified operators while penalizing those reliant on spot transactions.
Other drivers and restraints analyzed in the detailed report include:
- Copper-Price Hedging Tools Accessible to Recyclers
- OEM-Led Closed-Loop Alloy Qualification for Die-Casting
- Quality Variation and Contamination in Mixed Copper Streams
For complete list of drivers and restraints, kindly check the Table Of Contents.
Segment Analysis
Copper alloys are expected to grow at a 10.12% CAGR through 2031, significantly outpacing pure copper, as automakers approve recycled brass and bronze for use in die-casting, radiators, and heat exchangers. Suppliers incorporating No. 2 scrap directly into alloy production save USD 800-1,200 per ton compared to the cathode production method, enhancing their competitiveness. The implementation of ISO 22965 by late 2026 will standardize alloy chemistry, reducing qualification times by up to six weeks and promoting adoption across North America, Europe, and Japan.
Pure copper retained a 58.61% market share in 2025, driven by demand for grid wiring, data-center busbars, and inverters requiring 99.99% conductivity. Closed-loop programs with utilities ensure that decommissioned cables are sent directly to smelters, maintaining purity and stabilizing premiums. Aurubis aims to achieve 50% recycled content in cathodes by 2030, supporting investments in secondary refining. While alloy adoption reduces some volume, pure copper remains critical for high-conductivity applications, ensuring its continued importance in the recycled copper market.
Post-consumer scrap accounted for 53.45% of the 2025 supply, but industrial scrap is projected to grow at a 10.07% CAGR through 2031 as fabricators adopt compact granulators to capture margins previously outsourced. Wire and tube producers using systems from SWEED or CopperMine achieve 99.99% pure granules, commanding USD 1,000-1,400 per ton premiums over mixed scrap, with payback periods of 12 to 18 months.
Post-consumer scrap benefits from large-scale demolition projects and the anticipated retirement of EV batteries. However, its heterogeneous chemistry increases processing costs and certification challenges. Extended Producer Responsibility frameworks in Vietnam and the EU are improving collection, but fragmented dealer networks delay settlement cycles. Industrial scrap, with its consistent chemistry, reduces slag losses and supports hydrometallurgical processing, increasing its share in the recycled copper market.
Geography Analysis
Asia-Pacific held 39.25% of the recycled copper market share in 2025, driven by China's 2.34 million-tonne scrap imports and India's significant demand-supply gap. China's recycled-metals futures contract enhances hedging options, while India's Hindalco is expanding recycling capacity under a USD 10 billion investment plan. ASEAN nations, acting as processing hubs, are tightening impurity inspections, shifting trade flows toward certified operators.
The Middle-East and Africa, the fastest-growing region with a 10.09% CAGR through 2031, is supported by Oman's USD 106 million plant scaling to 12,000 tons by 2026 and Saudi Arabia's USD 100 billion mining initiative. Regional grid expansions of 40% by 2035 will create a deferred scrap pipeline, while Chinese and European smelters plan hub facilities to pre-clean mixed scrap for export.
In North America, U.S. tariffs redirect scrap inward, maintaining domestic margins, while Sims Limited upgrades separation lines across the region. Europe faces short-term challenges from rising power costs and the 2027 waste-export ban, but long-term demand for certified feedstock remains strong. South America's market share is modest, but Brazil's 12 GW of new renewable energy projects approved in 2025 position it as a future growth area, reflecting geographic rebalancing trends in the recycled copper market.
- Aurubis AG
- Boliden Group
- Calbag Metals Co.
- Chiho Environmental Group Limited
- CMC
- CRONIMET Holding GmbH
- Dowa Holdings Co., Ltd.
- European Metal Recycling Ltd.
- Glencore plc
- Gravita India Ltd.
- Hindalco Industries Ltd.
- Jiangxi Copper Company Limited
- Korea Zinc Co. (Sun Metals)
- Kuusakoski Oy
- Mitsubishi Materials Corporation
- OmniSource LLC
- Schnitzer Steel Industries, Inc.
- Sims Limited
- TSR Recycling GmbH & Co. KG
- Umicore
- Wieland-Werke AG
Additional Benefits:
- The market estimate (ME) sheet in Excel format
- 3 months of analyst support
TABLE OF CONTENTS
1 Introduction
- 1.1 Study Assumptions and Market Definition
- 1.2 Scope of the Study
2 Research Methodology
3 Executive Summary
4 Market Landscape
- 4.1 Market Overview
- 4.2 Market Drivers
- 4.2.1 Robust demand from EV-related wiring and battery collectors
- 4.2.2 Growing circular-economy mandates in the EU and China
- 4.2.3 Copper-price hedging tools accessible to recyclers
- 4.2.4 OEM-led closed-loop alloy qualification for die-casting
- 4.2.5 AI-enabled scrap sorting boosting high-grade recovery rates
- 4.3 Market Restraints
- 4.3.1 Scrap-price volatility compressing recycler margins
- 4.3.2 Quality variation and contamination in mixed copper streams
- 4.3.3 High cost of blockchain-based "green-copper" certification
- 4.4 Value Chain Analysis
- 4.5 Porter's Five Forces
- 4.5.1 Threat of New Entrants
- 4.5.2 Bargaining Power of Buyers
- 4.5.3 Bargaining Power of Suppliers
- 4.5.4 Threat of Substitutes
- 4.5.5 Competitive Rivalry
5 Market Size and Growth Forecasts (Volume)
- 5.1 By Copper Type
- 5.1.1 Pure Copper
- 5.1.2 Copper Alloys
- 5.2 By Source
- 5.2.1 Post-Consumer Scrap
- 5.2.2 Industrial Scrap
- 5.3 By Process
- 5.3.1 Mechanical Recycling
- 5.3.2 Pyrometallurgical Recycling
- 5.3.3 Hydrometallurgical Recycling
- 5.3.4 Combined Pyro-Hydro Routes
- 5.4 By End-user Industry
- 5.4.1 Electrical and Electronics
- 5.4.2 Building and Construction
- 5.4.3 Transportation
- 5.4.4 Industrial Equipment
- 5.4.5 Consumer Goods
- 5.4.6 Other End-user Industries (Telecom, etc.)
- 5.5 By Geography
- 5.5.1 Asia-Pacific
- 5.5.1.1 China
- 5.5.1.2 Japan
- 5.5.1.3 India
- 5.5.1.4 South Korea
- 5.5.1.5 ASEAN Countries
- 5.5.1.6 Rest of Asia-Pacific
- 5.5.2 North America
- 5.5.2.1 United States
- 5.5.2.2 Canada
- 5.5.2.3 Mexico
- 5.5.3 Europe
- 5.5.3.1 Germany
- 5.5.3.2 United Kingdom
- 5.5.3.3 France
- 5.5.3.4 Italy
- 5.5.3.5 Spain
- 5.5.3.6 Russia
- 5.5.3.7 NORDIC Countries
- 5.5.3.8 Rest of Europe
- 5.5.4 South America
- 5.5.4.1 Brazil
- 5.5.4.2 Argentina
- 5.5.4.3 Rest of South America
- 5.5.5 Middle-East and Africa
- 5.5.5.1 Saudi Arabia
- 5.5.5.2 South Africa
- 5.5.5.3 Rest of Middle-East and Africa
- 5.5.1 Asia-Pacific
6 Competitive Landscape
- 6.1 Market Concentration
- 6.2 Strategic Moves
- 6.3 Market Share (%)/Ranking Analysis
- 6.4 Company Profiles (includes Global level Overview, Market level overview, Core Segments, Financials as available, Strategic Information, Products and Services, and Recent Developments)
- 6.4.1 Aurubis AG
- 6.4.2 Boliden Group
- 6.4.3 Calbag Metals Co.
- 6.4.4 Chiho Environmental Group Limited
- 6.4.5 CMC
- 6.4.6 CRONIMET Holding GmbH
- 6.4.7 Dowa Holdings Co., Ltd.
- 6.4.8 European Metal Recycling Ltd.
- 6.4.9 Glencore plc
- 6.4.10 Gravita India Ltd.
- 6.4.11 Hindalco Industries Ltd.
- 6.4.12 Jiangxi Copper Company Limited
- 6.4.13 Korea Zinc Co. (Sun Metals)
- 6.4.14 Kuusakoski Oy
- 6.4.15 Mitsubishi Materials Corporation
- 6.4.16 OmniSource LLC
- 6.4.17 Schnitzer Steel Industries, Inc.
- 6.4.18 Sims Limited
- 6.4.19 TSR Recycling GmbH & Co. KG
- 6.4.20 Umicore
- 6.4.21 Wieland-Werke AG
7 Market Opportunities and Future Outlook
- 7.1 White-space and Unmet-Need Assessment
- 7.2 Bio-leaching Process to Extract Copper from E-waste
 2034年銅礦開採市場預測-按類型、技術、最終用戶和地區分類的全球分析
 2026-2030年全球銅市場
 2026-2036年全球航太和國防工業銅需求:
 銅市場規模、佔有率和趨勢分析報告:按類型、產品類型、應用、地區和細分市場分類(2026-2033 年)銅礦開採市場規模、佔有率和趨勢分析報告:按最終用途、地區和細分市場預測(2026-2033 年)
 吡硫翁銅市場:依產品類型、純度等級、應用及通路分類-2026-2032年全球市場預測銅提煉市場:依原料、製程、產品及最終用途分類-2026-2032年全球市場預測
 銅:全球市場佔有率和排名、總收入和需求預測(2026-2032年)數控主軸市場:2026-2032年全球市場預測(依冷卻方式、轉速、功率範圍、加工材料、安裝方式、應用及最終用途產業分類)銅市場:2026-2032年全球市場預測(按形狀、產品類型、應用和最終用途行業分類)