


 |
市場調查報告書
商品編碼
2061983
顆粒尿素:市場佔有率分析、產業趨勢與統計、成長預測(2026-2031)Granular Urea - Market Share Analysis, Industry Trends & Statistics, Growth Forecasts (2026 - 2031) |
||||||

※ 本網頁內容可能與最新版本有所差異。詳細情況請與我們聯繫。
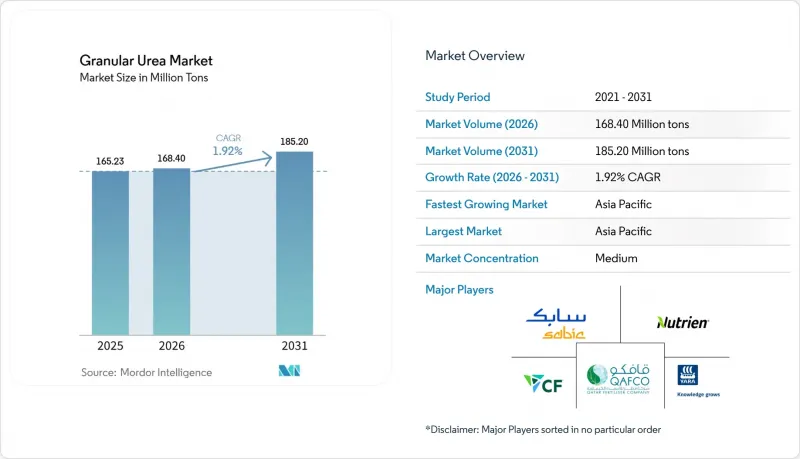
根據 Mordor Intelligence 預測,顆粒尿素市場規模將從 2025 年的 1.6523 億噸和 2026 年的 1.684 億噸成長到 2031 年的 1.852 億噸,2026 年至 2031 年的年複合成長率(CAGR)為 1.92%。
本報告按等級(農業級、工業級)、應用領域(農業[穀物及其他穀類]、工業[黏合劑和樹脂、化學品及其他工業應用])和地區(亞太地區、北美地區、歐洲地區、南美地區、中東和非洲地區)進行細分。市場預測以噸為單位。
全球顆粒尿素市場趨勢及洞察
對氮肥的需求增加
2025年,全球穀物和油籽種植面積將增加210萬公頃,氮肥需求將增加120萬噸。顆粒狀肥料之所以廣受歡迎,不僅是因為它們能降低粉塵濃度,從而緩解呼吸系統疾病,還因為它們符合美國和歐盟制定的嚴格職業健康標準。 2025年,印度的氮肥進口量將比2024年增加28%,達到410萬噸。這一成長主要歸因於季風不穩定,導致播種期縮短,並增加了對速溶顆粒肥料的需求。在美國,玉米和大豆田精密農業的採用率已飆升至42%。這項技術能夠實現變數施肥,減少了高達18%的過度施肥,同時增加了對與氣動噴霧器完美配合的均質顆粒肥料的需求。此外,越南、泰國和印尼穩定的水稻種植週期進一步穩定了購買模式。這些農業趨勢共同推動了氮肥消耗量的成長。
政府補貼和化肥支持計劃
印度在2025-2026財政年度累計約130億美元用於化肥補貼,並將尿素零售價上限設定為每45公斤266印度盧比。儘管全球尿素價格(含運費)已超過每噸400美元,但印度仍實施了這項措施,旨在保護小農戶免受原物料價格波動的影響。同時,巴西的「薩夫拉計畫2025-2026」宣布了一項高達4,005.9億雷亞爾(約800億美元)的農村貸款計畫。儘管巴西石油公司(Petrobras)已於2026年1月運作了其位於塞爾希培州和巴伊亞州的尿素生產設施,但這項財政支持仍維持了強勁的進口需求。在阿根廷,優惠貸款措施促使氮肥進口量大幅增加28%,達到410萬噸。雖然這些措施目前主要支撐了基本需求,但政策制定者正擴大將資金投入奈米液體肥料和緩蝕劑包衣產品中。此舉旨在遏制一氧化二氮的排放,這意味著顆粒尿素市場的強勁表現可能在 2028 年後放緩。
天然氣和氨原料價格波動
2025年,歐洲天然氣價格在每百萬英熱單位(MMBtu)6美元至14美元之間波動。這些波動反映在氨成本上,氨成本佔尿素現金流出的70%至80%。因此,隨著價格飆升和利潤空間消失,生產商減少了冬季產量。同時,在美國墨西哥灣沿岸地區,氨價格從2025年第一季的每噸450美元飆升至10月的每噸620美元。此次價格飆升,加上颶風弗朗辛導致路易斯安那州一家工廠停產,進一步擠壓了下游顆粒尿素的利潤空間。如此高的波動性降低了長期提貨合約的吸引力。事實上,為了避免價格飆升,巴西進口商在2025年透過現貨交易採購了60%的尿素,較2024年的40%大幅成長。這種不確定性也阻礙了產能的擴張。 CF Industries 和 Yara 等公司現在優先投資“藍色氨”,以確保符合碳邊境調節機制 (CBAM),而不是進行傳統的擴張。
細分市場分析
預計到2025年,農業用顆粒尿素的需求將佔總需求的77.23%,成為市場成長的主要驅動力。這主要得益於印度在秋季(Caliph)和冬季(Rabi)作物種植季期間2800萬噸的消費量,以及巴西大豆和玉米種植中620萬噸的使用量。儘管需求龐大,但預計到2031年,農業用顆粒尿素市場的複合年成長率將保持溫和。這種溫和成長主要歸因於印度大力推廣奈米液體肥料(旨在取代30%至50%的傳統氮肥)以及歐盟收緊肥料使用限制。雖然農民們讚賞顆粒肥料與機械化播種機配合使用時粉塵含量較低,但補貼產品、緩釋肥料和緩釋包膜肥料的吸引力正在抑制市場擴張。
截至2025年,工業級顆粒雖然市場佔有率較小,但預計將以2.31%的複合年成長率成長。這一成長主要受甲醛基木質複合複合材料、三聚氰胺飼料以及選擇性催化還原(SCR)試劑的需求所驅動。所有這些應用都需要粒徑均勻、雙縮脲含量低的顆粒。工業領域採用這些顆粒不僅可以保護生產商免受農業補貼波動的影響,還能讓他們維持15%至25%的價格溢價。
區域分析
預計到2025年,亞太地區將佔全球總量的45.22%,年複合成長率達2.19%。儘管由於中國實施臨時出口配額,國內供應保持穩定,但印度的進口量預計在2025年仍將成長13%,即便其補貼預算受到限制。在澳大利亞,受國內工廠關閉的影響,2024年前八個月的進口量達到創紀錄的335萬噸,這表明天氣和產能停工對區域貿易流量的影響之大令人震驚。
北美受惠於低成本頁岩氣,使其擁有全球極具競爭力的離岸價(FOB),進而促進了對拉丁美洲的出口。光是CF Industries一家就佔據了該地區約42%的造粒產能,並在2024年實現了22.8億美元的調整後EBITDA。美國也在現有氨尿素生產線旁試點碳捕獲項目,一旦碳足跡標籤標準正式確立,該地區將有望向高階市場推出低碳產品。
歐洲面臨雙重挑戰:能源價格飆升和環境法規日益嚴格。天然氣價格上漲迫使歐洲減少氨產量,到2024年將減少相當於290萬噸尿素的產量。隨著CBAM關稅即將生效,歐洲從阿爾及利亞、埃及和卡達的氨進口量增加。東歐,特別是波蘭和羅馬尼亞,憑藉管道天然氣供應優勢,保持成本優勢,部分抵銷了西歐的減產影響。
在南美洲,以巴西和阿根廷為首,隨著鐵路和港口的發展縮小了內陸和農村地區之間的價格差距,農業用地快速轉化為其他用途的趨勢仍在持續。該地區的尿素需求正以每年2.6%的速度成長,略高於全球顆粒尿素市場的複合年成長率。中東和非洲正在利用其豐富的天然氣資源,沙烏地阿拉伯和卡達出口了全球約三分之一的海運尿素,而埃及則透過大型大型企劃擴大了國內消費。
其他好處:
- Excel格式的市場預測(ME)表
- 3個月的分析師支持
目錄
第1章:引言
- 研究假設和市場定義
- 調查範圍
第2章:調查方法
第3章執行摘要
第4章 市場狀況
- 市場概覽
- 市場促進因素
- 氮肥需求增加
- 政府補貼和化肥支持計劃
- 從顆粒尿素過渡到顆粒尿素,以改善操作性能。
- 自動散裝混合設備更傾向於使用不會產生粉塵的顆粒。
- 一個支持小批量採購的數位化農業市場。
- 市場限制因素
- 天然氣和氨原料價格波動
- 加強對硝酸鹽徑流和優養化的監管
- 歐盟配額規定了高效能尿素的佔有率
- 價值鏈分析
- 波特五力模型
第5章 市場規模與成長預測
- 按年級
- 農業級
- 工業級
- 透過使用
- 農業
- 穀類和穀類食品
- 水果和蔬菜
- 油籽/豆類
- 其他農業用途
- 產業
- 黏合劑和樹脂
- 化學品
- 其他工業用途
- 農業
- 按地區
- 亞太地區
- 中國
- 日本
- 印度
- 韓國
- 東南亞國協
- 其他亞太國家
- 北美洲
- 美國
- 加拿大
- 墨西哥
- 歐洲
- 德國
- 英國
- 法國
- 義大利
- 西班牙
- 俄羅斯
- 北歐國家
- 其他歐洲國家
- 南美洲
- 巴西
- 阿根廷
- 其他南美國家
- 中東和非洲
- 沙烏地阿拉伯
- 南非
- 其他中東和非洲國家
- 亞太地區
第6章 競爭情勢
- 市場集中度
- 策略趨勢
- 市佔率和排名分析
- 公司簡介
- Acron
- BASF
- CF Industries Holdings, Inc.
- Dangote Fertiliser Limited.
- EuroChem Group
- Grupa Azoty SA
- IFFCO
- Indorama Corporation
- Koch Fertilizer, LLC.
- Nutrien
- OCI
- PETRONAS Chemicals Group Berhad
- PhosAgro Group
- SABIC
- Uralchem
- Qatar Fertiliser Company(QAFCO)
- Yara
第7章 市場機會與未來展望
According to Mordor Intelligence, the granular urea market size is projected to expand from 165.23 Million tons in 2025 and 168.40 Million tons in 2026 to 185.20 Million tons by 2031, registering a CAGR of 1.92% between 2026 to 2031.
This report is Segmented by Grade (Agricultural Grade, Industrial Grade), Application (Agriculture [Cereals and Grains, and More], Industrial [Adhesives and Resins, Chemicals, Other Industrial Applications]), and Geography (Asia-Pacific, North America, Europe, South America, Middle East and Africa). The Market Forecasts are Provided in Terms of Volume (tons).
Global Granular Urea Market Trends and Insights
Rising Demand for Nitrogen-based Fertilizers
In 2025, global cereal and oilseed acreage grew by 2.1 million hectares, leading to an additional demand of 1.2 million tons of nitrogen. Granular formulations gained popularity, as their reduced dust levels not only lessen respiratory issues but also align with the stringent occupational health standards set by the U.S. and the European Union. In 2025, India saw a 28% surge in nitrogen fertilizer imports, totaling 4.1 million tons, up from 2024. This spike was largely due to erratic monsoons, which compressed planting windows and heightened the preference for quick-dissolving granules. Adoption of precision agriculture soared to 42% across U.S. corn and soybean fields. This approach, allowing for variable-rate placement, has curtailed over-application by as much as 18%, simultaneously boosting the demand for uniform granules that work seamlessly with pneumatic spreaders. Additionally, the consistent rice cycles in Vietnam, Thailand, and Indonesia have further stabilized purchasing patterns. Together, these agricultural trends have driven up nitrogen consumption.
Government Subsidies and Fertilizer Support Programs
India allocated approximately USD 13 billion for fertilizer subsidies in FY 2025-2026, setting a retail cap of INR 266 per 45 kg for urea. This move comes even as global prices surged past USD 400 per ton CFR, a strategy aimed at shielding smallholders from the volatility of feedstock costs. Meanwhile, Brazil's "Plano Safra 2025-2026" unveiled a substantial BRL 400.59 billion (around USD 80 billion) in rural credit. This financial boost has kept import demand robust, even with Petrobras reactivating its urea units in Sergipe and Bahia in January 2026. In Argentina, preferential credit measures led to a notable 28% surge in nitrogen imports, reaching 4.1 million tons. While these initiatives currently support baseline demand, policymakers are increasingly directing funds towards nano-liquid and inhibitor-coated products. This shift aims to mitigate nitrous oxide emissions, suggesting that the uplift in the granular urea market may wane post-2028.
Volatile Natural-Gas and Ammonia Feedstock Costs
In 2025, European gas prices fluctuated between USD 6 and USD 14 per MMBtu. These swings translated into ammonia costs, which accounted for 70-80% of urea's cash expenses. Consequently, when prices spiked and margins were erased, producers cut back on winter production. Meanwhile, at the U.S. Gulf Coast, ammonia prices surged from USD 450 per ton in Q1 2025 to USD 620 per ton by October. This spike followed Hurricane Francine's closure of Louisiana plants, tightening margins for downstream granules. Such high volatility has made long-term offtake contracts less appealing. In fact, Brazilian importers, aiming to sidestep peak prices, sourced 60% of their 2025 urea on spot terms, a jump from 40% in 2024. This uncertainty has also stalled capacity expansions. Companies like CF Industries and Yara are now favoring investments in blue ammonia, which ensures compliance with the Carbon Border Adjustment Mechanism (CBAM), over traditional expansions.
Other drivers and restraints analyzed in the detailed report include:
- Shift to Granular Over Prilled Urea for Better Handling
- Automated Bulk-Blending Facilities Favor Dust-Free Granules
- Environmental Impacts of Nitrate Leaching and Eutrophication
For complete list of drivers and restraints, kindly check the Table Of Contents.
Segment Analysis
In 2025, agricultural-grade granules dominated demand capturing 77.23%, driven by India's consumption of 28 million tons during the kharif and rabi seasons, alongside Brazil's application of 6.2 million tons for soybeans and corn. Despite this substantial demand, the agricultural segment of the granular urea market is projected to grow at a modest CAGR through 2031. This tempered growth is attributed to India's push for nano-liquid alternatives, which aim to replace 30-50% of conventional nitrogen, and tightening usage caps in the EU. While farmers value the granules for their low dust content in mechanized seeders, the allure of controlled-release and inhibitor-coated products, bolstered by subsidy support, has moderated the market's expansion.
In 2025, industrial-grade granules occupied a smaller market share but are on track to grow at a 2.31% CAGR. This growth is driven by demand from formaldehyde-based wood composites, melamine feed, and selective catalytic reduction reagents, all of which require consistently sized, low-biuret granules. The industrial sector's adoption of these granules not only insulates producers from the volatility of farm subsidies but also allows them to maintain a pricing premium of 15-25%.
Geography Analysis
Asia-Pacific commanded 45.22% of global volume in 2025, and leads growth at a 2.19% CAGR. China's temporary export quotas stabilize domestic supply, while India's imports rose 13% in 2025 despite subsidy-budget constraints. Australia set an import record at 3.35 million tons in the first eight months of 2024 after local plant closures, illustrating how weather and capacity outages quickly swing regional trade flows.
North America benefits from low-cost shale gas, enabling globally competitive FOB costs that underpin exports to Latin America. CF Industries alone holds roughly 42% of regional granulation capacity and achieved USD 2.28 billion adjusted EBITDA in 2024. The United States also pilots carbon-capture projects attached to existing ammonia-urea lines, positioning the region to sell low-carbon products into premium markets once carbon-footprint labeling standards formalize.
Europe faces twin hurdles of elevated energy prices and tightening environmental caps. High gas costs forced ammonia production curtailments equal to 2.9 million tons of urea in 2024, prompting imports from Algeria, Egypt, and Qatar despite looming CBAM tariffs. Eastern Europe, especially Poland and Romania, retains cost advantages from pipeline gas access, partially offsetting Western shutdowns.
South America, led by Brazil and Argentina, continues rapid farmland conversion as rail and port build-outs compress inland basis values. The region's urea demand grows 2.6% annually, slightly above the global granular urea market CAGR. Middle East and Africa leverage abundant natural gas, with Saudi Arabia and Qatar exporting nearly one-third of global seaborne urea while Egypt ramps domestic consumption through irrigation megaprojects.
- Acron
- BASF
- CF Industries Holdings, Inc.
- Dangote Fertiliser Limited.
- EuroChem Group
- Grupa Azoty S.A.
- IFFCO
- Indorama Corporation
- Koch Fertilizer, LLC.
- Nutrien
- OCI
- PETRONAS Chemicals Group Berhad
- PhosAgro Group
- SABIC
- Uralchem
- Qatar Fertiliser Company (QAFCO)
- Yara
Additional Benefits:
- The market estimate (ME) sheet in Excel format
- 3 months of analyst support
TABLE OF CONTENTS
1 Introduction
- 1.1 Study Assumptions and Market Definition
- 1.2 Scope of the Study
2 Research Methodology
3 Executive Summary
4 Market Landscape
- 4.1 Market Overview
- 4.2 Market Drivers
- 4.2.1 Rising demand for nitrogen fertilizers
- 4.2.2 Government subsidies and fertilizer support programs
- 4.2.3 Shift to granular over prilled urea for better handling
- 4.2.4 Automated bulk-blending facilities favour dust-free granules
- 4.2.5 Digital ag-marketplaces enabling micro-batch procurement
- 4.3 Market Restraints
- 4.3.1 Volatile natural-gas and ammonia feed-stock costs
- 4.3.2 Tightening regulations on nitrate runoff and eutrophication
- 4.3.3 European Union quotas mandating enhanced-efficiency urea share
- 4.4 Value Chain Analysis
- 4.5 Porter's Five Forces
- 4.5.1 Threat of New Entrants
- 4.5.2 Bargaining Power of Buyers
- 4.5.3 Bargaining Power of Suppliers
- 4.5.4 Threat of Substitutes
- 4.5.5 Degree of Competition
5 Market Size and Growth Forecasts (Volume)
- 5.1 By Grade
- 5.1.1 Agricultural Grade
- 5.1.2 Industrial Grade
- 5.2 By Application
- 5.2.1 Agriculture
- 5.2.1.1 Cereals and Grains
- 5.2.1.2 Fruits and Vegetables
- 5.2.1.3 Oilseeds and Pulses
- 5.2.1.4 Other Agricultural Applications
- 5.2.2 Industrial
- 5.2.2.1 Adhesives and Resins
- 5.2.2.2 Chemicals
- 5.2.2.3 Other Industrial Applications
- 5.2.1 Agriculture
- 5.3 By Geography
- 5.3.1 Asia-Pacific
- 5.3.1.1 China
- 5.3.1.2 Japan
- 5.3.1.3 India
- 5.3.1.4 South Korea
- 5.3.1.5 ASEAN Countries
- 5.3.1.6 Rest of Asia-Pacific
- 5.3.2 North America
- 5.3.2.1 United States
- 5.3.2.2 Canada
- 5.3.2.3 Mexico
- 5.3.3 Europe
- 5.3.3.1 Germany
- 5.3.3.2 United Kingdom
- 5.3.3.3 France
- 5.3.3.4 Italy
- 5.3.3.5 Spain
- 5.3.3.6 Russia
- 5.3.3.7 NORDIC Countries
- 5.3.3.8 Rest of Europe
- 5.3.4 South America
- 5.3.4.1 Brazil
- 5.3.4.2 Argentina
- 5.3.4.3 Rest of South America
- 5.3.5 Middle-East and Africa
- 5.3.5.1 Saudi Arabia
- 5.3.5.2 South Africa
- 5.3.5.3 Rest of Middle-East and Africa
- 5.3.1 Asia-Pacific
6 Competitive Landscape
- 6.1 Market Concentration
- 6.2 Strategic Moves
- 6.3 Market Share(%)/Ranking Analysis
- 6.4 Company Profiles (includes Global Overview, Market Overview, Core Segments, Financials, Strategic Information, Products and Services, Recent Developments)
- 6.4.1 Acron
- 6.4.2 BASF
- 6.4.3 CF Industries Holdings, Inc.
- 6.4.4 Dangote Fertiliser Limited.
- 6.4.5 EuroChem Group
- 6.4.6 Grupa Azoty S.A.
- 6.4.7 IFFCO
- 6.4.8 Indorama Corporation
- 6.4.9 Koch Fertilizer, LLC.
- 6.4.10 Nutrien
- 6.4.11 OCI
- 6.4.12 PETRONAS Chemicals Group Berhad
- 6.4.13 PhosAgro Group
- 6.4.14 SABIC
- 6.4.15 Uralchem
- 6.4.16 Qatar Fertiliser Company (QAFCO)
- 6.4.17 Yara
7 Market Opportunities and Future Outlook
- 7.1 White-space and Unmet-need Assessment

 印度尿素市場:市場佔有率分析、產業趨勢與統計及成長預測(2026-2031)
 尿素市場規模、佔有率和趨勢分析報告:按形態、應用、最終用途、地區和細分市場分類(2026-2033 年)
 工業尿素市場規模、佔有率和成長分析:按等級/純度、應用、終端用戶產業、包裝、銷售管道和地區分類-2026-2033年產業預測
 尿素市場:2026-2032年全球市場預測(依最終用途、形態、應用、等級、通路及生產流程分類)
 顆粒尿素市場:按應用、產品類型和地區分類尿素市場:依形態、等級、純度、通路(間接/直接)及地區分類
 尿素市場分析及預測(至2035年):類型、產品、應用、最終用戶、形態、技術、製程、材料類型、安裝類型
 全球硫包覆尿素市場規模、佔有率、趨勢及成長分析報告(2026-2034)
 尿素市場規模、佔有率、趨勢及預測(依等級、應用、最終用途產業及地區分類),2026-2034年
 2026年全球尿素市場報告