


 |
市場調查報告書
商品編碼
2061968
備件物流:市場佔有率分析、產業趨勢與統計、成長預測(2026-2031)Spare Parts Logistics - Market Share Analysis, Industry Trends & Statistics, Growth Forecasts (2026 - 2031) |
||||||

※ 本網頁內容可能與最新版本有所差異。詳細情況請與我們聯繫。
根據 Mordor Intelligence 預測,備件物流市場規模將從 2025 年的 492.2 億美元成長到 2026 年的 515.7 億美元,到 2031 年將達到 654.7 億美元,2026 年至 2031 年的複合年成長率為 4.89%。
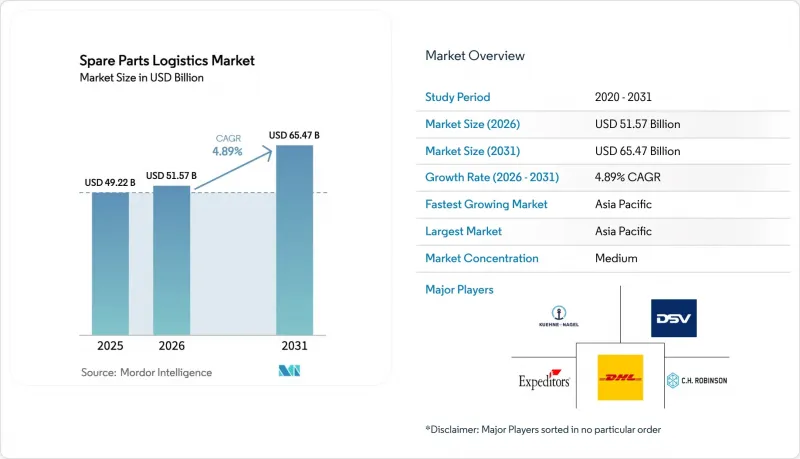
本報告按服務類型(運輸、倉儲物流、附加價值服務)、採購管道(OEM通路、獨立售後市場)、終端用戶產業(汽車、航太與國防、其他)、業務類型(B2B、B2C)和地區(北美、歐洲、亞太、其他)進行細分。市場預測以以金額為準(十億美元)表示。
全球備件物流市場趨勢及洞察
舊工業設備需要頻繁更換
隨著設備所有者不斷延長資產使用壽命,劣化導致的故障風險也隨之增加,零件的可用性變得至關重要。在這種營運環境下,即使缺少一個零件也可能導致生產停滯,並對下游的生產計劃和人員配置產生連鎖反應,因此,買家越來越重視備件物流市場的高供貨率和精確的前置作業時間。此外,工業領域正在採用預測性維護來預測故障並縮短維修週期,這使得能夠預先部署關鍵庫存單位(SKU)的供應商更具優勢。反映已安裝配置的數位雙胞胎模型有助於預測故障模式,並將準時補貨與服務水準目標相匹配,從而穩定維護組合的營運資金。由於成熟市場持續推遲資本投資,備件物流市場在製造商採用的運轉率保障計畫中正發揮核心作用。
從產品銷售轉型為服務型收入模式
基於服務的契約,即透過安裝設備產生收入的契約,正在改變備件物流市場的採購決策以及對物流合作夥伴的能力要求。互聯設備和服務生命週期管理平台能夠實現運作保證、固定費率合約以及依賴可預測的零件流的遠端診斷。基於結果的合約將風險轉移給能夠定價並交付承諾服務結果的供應商,從而推動了受監管行業對技術驅動型物流和合規設施的需求。能夠整合工程數據、庫存狀態和現場運營的供應商,正在從單純的運輸發展成為確保持續服務的整合夥伴關係關係。隨著服務化在區域和產業範圍內的擴展,備件物流市場越來越重視能夠即時可見且品質一致地管理複雜零件目錄的供應商。
SKU數量的快速成長導致庫存管理的複雜性增加。
隨著產品線因設備差異、材料和監管要求而日益細分,庫存單位(SKU)數量不斷增加,對備件物流市場的規劃系統和倉儲空間帶來壓力。許多MRO(維護、維修和營運)備件長期閒置,不僅佔用資金,而且由於擔心缺貨罰款,也阻礙了庫存合理化。退貨進一步增加了複雜性,因為電商通路退貨率高,需要緩衝庫存和特殊處理。採用人工智慧驅動的需求預測和自主補貨的工廠,透過根據重要性和故障風險對SKU進行分類,降低了緊急採購和庫存成本。此外,醫療設備的上市後監測和更嚴格的品質要求,也為醫療物流帶來了追蹤義務,增加了服務供應商的營運成本。
細分市場分析
到2025年,運輸服務將佔總收入的41.78%,但附加價值服務正以每年6.32%的速度成長,這提高了備件物流市場的複雜程度。公路網路支援區域內的高密度補給,空運負責緊急和高價值貨物的運輸,海運則負責日常維護庫存的存放。鐵路補充了洲際運輸能力,以可預測的營運時刻表連接亞洲樞紐和歐洲需求中心。高效能網路依賴資產管理,XPO持續投資於零擔貨運(LTL)並擴大其在北美的服務中心,從而提高了網路密度和服務質量,這便是最好的例證。在醫療和航太領域,溫度控制、序列化和合規儲存是必不可少的,而符合2026年生效的美國FDA品管系統法規的認證設施將擁有競爭優勢。
供應商管理庫存 (VMI)、套件組裝和簡化組裝等附加價值服務正在備件物流市場中佔據高溢價。這些服務將以往分散的流程整合為一體化的工作流程,提高了速度並減少了環節。擁有清關和保稅設施的供應商可以縮短跨境前置作業時間,並降低受管制物品的海關風險。數位雙胞胎和互聯服務平台的日益普及,提高了客戶現場零件投放的準確性,並將物流結果與維護週期和運轉率保證聯繫起來。 CEVA 和 HAECO 之間的全球航空貨運合作等夥伴關係,展現了航太備件領域當前所需的垂直整合深度,涵蓋從地面飛機處理到溫控部件的各個環節。
區域分析
預計到2025年,亞太地區將佔全球銷售額的38.21%,並在2031年之前以5.21%的複合年成長率成長。這主要得益於汽車、電子和航太價值鏈的發展,這些產業鏈對備件物流市場快速合規的配送需求日益成長。 2025年,中國汽車產業將生產3,453.1萬輛汽車,其中新能源汽車將達到1,662.6萬輛。此外,中國還將出口709.8萬輛汽車,並將保固和服務網路擴展到出口市場。 2026年初,區域製造業環境將趨於緊張,預示著供應鏈擁擠和新瓶頸的出現。這將提升關鍵SKU可靠回應和庫存管理的重要性。擁有認證溫控、符合危險品法規並能提供全天候營運的物流供應商正在航太和醫療保健產業贏得高價值合約。網路擴張也著重於綜合清關服務和保稅倉庫,從而降低海關風險,穩定整個備件物流市場的運輸時間。
北美和歐洲合計佔據公司業務的很大一部分,備件物流市場的需求受到工業資產老化、電氣化以及高度監管的醫療管道的驅動。 DSV於2025年收購DB Schenker,打造了一個業務遍及90多個國家的大規模平台,並透過設施和IT整合,在2028年前實現90億丹麥克朗(約合13億美元)的協同效應。 XPO持續投資其北美貨運網路,以擴大覆蓋範圍並提升服務水平,這對於確保製造地之間備件的及時補給至關重要。 2026年,FDA最終確定了參考ISO 13485:2016的品質管理系統法規,加強了醫療設備物流領域的倉儲和服務提供義務。這些地區的買家重視有據可查的品質系統、審計追蹤以及針對可維修零件和備用設備的完善的逆向物流。備件物流市場正受益於重組後的網路,該網路將庫存更靠近消費點,同時保持處理特殊物品跨境的能力。
南美洲和中東及非洲佔據剩餘市場佔有率,備件物流市場正呈現選擇性成長,這與汽車、能源和基礎設施相關項目密切相關。非洲的採礦和能源作業需要前置作業時間長的專用重型設備零件,因此預先部署的寄售庫存和預測性維護計劃對於確保運作至關重要。海灣國家正在投資先進製造業和電力項目,這些項目正在建立穩定的維護、維修和營運 (MRO) 流程,並伴隨著嚴格的合規要求。在南美洲,營運商正在將庫存本地化,以避免延誤並降低關稅風險,從而提高該地區汽車和機械設備的服務水準。獲得自由區授權並建立區域樞紐的供應商可以透過縮短前置作業時間和承諾快速反應來脫穎而出,從而獲得成功。隨著這些地區的擴張,備件物流市場將越來越重視那些能夠將全球採購網路與本地履約和合規處理能力相結合的合作夥伴,尤其是在受監管物品方面。
其他好處:
- Excel格式的市場預測(ME)表
- 3個月的分析師支持
目錄
第1章:引言
- 研究假設和市場定義
- 調查範圍
第2章:調查方法
第3章執行摘要
第4章 市場狀況
- 市場概覽
- 市場促進因素
- 舊工業設備需要頻繁更換
- 從產品銷售轉型為服務型收入模式
- 設備停機造成的成本壓力催生了對更快交貨的需求。
- 在新興製造地引進先進機械設備
- 多品牌服務提供者的成長
- 設備運轉率的提高會導致磨損週期的加速。
- 市場限制因素
- SKU數量的急劇增加導致庫存管理日益複雜。
- 長尾庫存持有成本正在對利潤率造成壓力。
- 不同世代設備之間缺乏零件標準化
- 高退貨率和複雜的逆向物流
- 價值供應鏈分析
- 監理情勢
- 技術展望
- 波特五力模型
- 地緣政治事件對市場的影響
第5章 市場規模與成長預測
- 按服務類型
- 運輸
- 路
- 航空
- 海
- 鐵路
- 倉儲/物流
- 附加價值服務
- 運輸
- 按銷售管道
- OEM通路
- 獨立售後市場 (IAM)
- 產業最終用途
- 車
- 航太/國防
- 電子和半導體
- 工業機械和重型設備
- 能源與電力
- 醫療設備
- 海事/造船
- 其他
- 商業類別
- 企業對企業 (B2B) 交易
- BtoC(Business to Consumer)
- 按地區
- 北美洲
- 美國
- 加拿大
- 墨西哥
- 南美洲
- 巴西
- 秘魯
- 智利
- 阿根廷
- 其他南美國家
- 亞太地區
- 印度
- 中國
- 日本
- 澳洲
- 韓國
- 東南亞(新加坡、馬來西亞、泰國、印尼、越南、菲律賓)
- 其他亞太國家
- 歐洲
- 英國
- 德國
- 法國
- 西班牙
- 義大利
- 比荷盧經濟聯盟(比利時、荷蘭、盧森堡)
- 北歐國家(丹麥、芬蘭、冰島、挪威、瑞典)
- 其他歐洲國家
- 中東和非洲
- 阿拉伯聯合大公國
- 沙烏地阿拉伯
- 南非
- 奈及利亞
- 其他中東和非洲國家
- 北美洲
第6章 競爭情勢
- 市場集中度
- 策略趨勢
- 市佔率分析
- 公司簡介
- DHL Group
- Kuehne+Nagel International AG
- DSV A/S
- Expeditors International of Washington
- CH Robinson
- CEVA Logistics
- GEODIS
- XPO Logistics
- Ryder System Inc.
- Penske Logistics
- Hitachi Transport System
- Yusen Logistics(Part of NYK Line)
- Nippon Express
- Sinotrans
- TVS Supply Chain Solutions
- Choice Logistics
- AIT Worldwide Logistics
- Logwin AG
- Kerry Logistics Network Limited
- Hellmann Worldwide Logistics
第7章 市場機會與未來展望
According to Mordor Intelligence, the spare parts logistics market size is expected to grow from USD 49.22 billion in 2025 to USD 51.57 billion in 2026 and is forecast to reach USD 65.47 billion by 2031 at 4.89% CAGR over 2026-2031.
This report is Segmented by Service Type (Transportation, Warehousing & Distribution, and Value-Added Services), by Source Channel (OEM Channel, and Independent Aftermarket), by End-Use Industry (Automotive, Aerospace & Defense, and More), by Business Type (B2B, and B2C), and by Geography (North America, Europe, Asia-Pacific, and More). The Market Forecasts are Provided in Terms of Value (USD Billion).
Global Spare Parts Logistics Market Trends and Insights
Aging Industrial Equipment Base Requiring Frequent Replacements
Equipment owners are extending asset lifetimes, raising the priority on parts availability as breakdown risks increase with age. In this operating environment, a single missing component can stall production and ripple through downstream schedules and labor plans, which pushes buyers to value high fill rates and accurate lead times in the spare parts logistics market. Industrial teams are also deploying predictive maintenance to anticipate failures and shorten repair windows, which rewards providers able to pre-position critical SKUs. Digital twins that mirror installed configurations help forecast failure modes and align just-in-time replenishment with service-level targets, which stabilizes working capital for maintenance portfolios. As deferred capital expenditures persist in mature markets, the spare parts logistics market becomes central to uptime assurance programs adopted by manufacturers.
Shift from Product Sales to Service-Based Revenue Models
Service-based contracts that monetize the installed base are changing procurement decisions and the required capabilities of logistics partners in the spare parts logistics market. Connected equipment and service lifecycle management platforms now enable uptime guarantees, fixed-fee arrangements, and remote diagnostics that depend on predictable parts flows. Outcome-based agreements shift risk to providers that can price and deliver against promised service outcomes, which increases demand for tech-enabled logistics and compliant facilities in regulated categories. Vendors that can unify engineering data, inventory status, and field operations move beyond transactional shipping into integrated partnerships that lock in recurring services. As servitization spreads across regions and sectors, the spare parts logistics market rewards providers who can manage complex parts catalogs with real-time visibility and consistent quality.
Extreme SKU Proliferation Creating Inventory Management Complexity
SKU counts expand as equipment variants, materials, and regulatory requirements fragment product lines, which stresses planning systems and warehouse space in the spare parts logistics market. Many MRO parts remain unmoved for long periods, which ties up capital and discourages rationalization due to fear of stockout penalties. Returns add more complexity because e-commerce channels have higher return rates that require buffer stock and specialized processing. Plants that deploy AI-driven demand sensing and autonomous replenishment reduce emergency purchases and inventory costs by segmenting SKUs by criticality and failure risk. Tighter post-market surveillance and device-quality requirements also introduce tracking obligations in healthcare logistics that raise operational overhead for service providers.
Other drivers and restraints analyzed in the detailed report include:
- Equipment Downtime Cost Pressures Demanding Faster Delivery
- Complex Machinery Adoption in Emerging Manufacturing Hubs
- Long-Tail Inventory Holding Costs Eroding Profit Margins
For complete list of drivers and restraints, kindly check the Table Of Contents.
Segment Analysis
Transportation services secured 41.78% of 2025 revenue, while value-added services are advancing at a 6.32% annual rate that raises the sophistication threshold for the spare parts logistics market. Road networks support dense intra-regional replenishment, air freight handles urgent and high-value shipments, and ocean lanes position scheduled maintenance inventories. Rail adds intercontinental capacity, linking Asian hubs to European demand centers with predictable timetables. High-performance networks rely on asset control, as shown by XPO's continued North American LTL investments and service-center expansion that enhance network density and service quality. In healthcare and aerospace, temperature control, serialization, and compliant storage are table stakes that reward certified facilities aligned with the United States FDA's Quality Management System Regulation in 2026.
Value-added services, including vendor-managed inventory, kitting, and light assembly, are capturing a complexity premium in the spare parts logistics market. These services consolidate formerly separate steps into integrated workflows that improve speed and reduce touch points. Providers with customs brokerage and bonded facilities shorten cross-border lead times and reduce clearance risk on regulated items. The growing use of digital twins and connected service platforms supports accurate staging of parts at customer sites, which ties logistics outcomes to maintenance windows and uptime guarantees. Partnerships like CEVA and HAECO's global air-freight collaboration show the vertical depth now expected in aerospace spare parts, from aircraft-on-ground execution to temperature-managed components.
Geography Analysis
Asia-Pacific captured 38.21% of global revenue in 2025 and is set to grow at a 5.21% CAGR to 2031, supported by automotive, electronics, and aerospace value chains that require fast and compliant spare parts flows in the spare parts logistics market. China's automotive sector produced 34.531 million vehicles in 2025, including 16.626 million new-energy vehicles, with exports of 7.098 million units that extend warranty and service networks into destination markets. Regional manufacturing conditions tightened in early 2026, signaling busier supply chains and emerging bottlenecks that increase the value of guaranteed response and staging for critical SKUs. Logistics providers with certified temperature control, dangerous-goods compliance, and around-the-clock operations win higher-value aerospace and healthcare contracts. Network expansions also focus on integrated customs brokerage and bonded storage, which reduces clearance risk and stabilizes transit times across the spare parts logistics market.
North America and Europe jointly account for a significant share of activity, with demand anchored in aging industrial assets, electrification, and compliance-heavy medical channels in the spare parts logistics market. DSV's 2025 acquisition of DB Schenker created a larger platform with operations in more than 90 countries, supported by targeted synergies of DKK 9.0 billion (USD 1.3 billion) by 2028 from facility consolidation and IT integration. XPO continued to invest in its North American less-than-truckload network to expand coverage and improve service levels, which is relevant for time-definite spare parts replenishment across manufacturing corridors. In 2026, the FDA finalized its Quality Management System Regulation that references ISO 13485:2016, which heightens storage and servicing obligations in medical equipment logistics. Buyers in these regions value documented quality systems, audit trails, and robust reverse logistics for repairable components and loaner devices. The spare parts logistics market benefits from reconfigured networks that bring inventory closer to consumption while maintaining cross-border capabilities for specialized items.
South America, the Middle East, and Africa represent the remaining share and show selective growth tied to automotive, energy, and infrastructure programs in the spare parts logistics market. Mining and energy operations in Africa require specialized heavy components with long lead times, which favor pre-positioned consignment stock and predictive maintenance programs for uptime. Gulf economies invest in advanced manufacturing and power projects that generate steady maintenance, repair, and operations flows with tight compliance needs. In South America, operators localize inventories to avoid delays and reduce tariff exposure, which improves service levels for regional automotive and machinery fleets. Providers that secure free-zone licenses and establish regional hubs can shorten lead times and succeed on response commitments that differentiate offers. As these regions scale, the spare parts logistics market rewards partners that blend global procurement reach with local fulfillment and compliant handling for regulated categories.
- DHL Group
- Kuehne + Nagel International AG
- DSV A/S
- Expeditors International of Washington
- C.H. Robinson
- CEVA Logistics
- GEODIS
- XPO Logistics
- Ryder System Inc.
- Penske Logistics
- Hitachi Transport System
- Yusen Logistics (Part of NYK Line)
- Nippon Express
- Sinotrans
- TVS Supply Chain Solutions
- Choice Logistics
- AIT Worldwide Logistics
- Logwin AG
- Kerry Logistics Network Limited
- Hellmann Worldwide Logistics
Additional Benefits:
- The market estimate (ME) sheet in Excel format
- 3 months of analyst support
TABLE OF CONTENTS
1 Introduction
- 1.1 Study Assumptions & Market Definition
- 1.2 Scope of the Study
2 Research Methodology
3 Executive Summary
4 Market Landscape
- 4.1 Market Overview
- 4.2 Market Drivers
- 4.2.1 Aging Industrial Equipment Base Requiring Frequent Replacements
- 4.2.2 Shift from Product Sales to Service-Based Revenue Models
- 4.2.3 Equipment Downtime Cost Pressures Demanding Faster Delivery
- 4.2.4 Complex Machinery Adoption in Emerging Manufacturing Hubs
- 4.2.5 Growth of Multi-Brand Service Providers
- 4.2.6 Increasing Equipment Utilization Rates Accelerating Wear Cycles
- 4.3 Market Restraints
- 4.3.1 Extreme SKU Proliferation Creating Inventory Management Complexity
- 4.3.2 Long-Tail Inventory Holding Costs Eroding Profit Margins
- 4.3.3 Lack of Component Standardization Across Equipment Generations
- 4.3.4 High Return Rates and Complex Reverse Logistics
- 4.4 Value / Supply-Chain Analysis
- 4.5 Regulatory Landscape
- 4.6 Technological Outlook
- 4.7 Porter's Five Forces
- 4.7.1 Threat of New Entrants
- 4.7.2 Bargaining Power of Suppliers
- 4.7.3 Bargaining Power of Buyers
- 4.7.4 Threat of Substitute Products
- 4.7.5 Intensity of Competitive Rivalry
- 4.8 Impact of Geo-Politics Events on the Market
5 Market Size & Growth Forecasts (Value, USD)
- 5.1 By Service Type
- 5.1.1 Transportation
- 5.1.1.1 Road
- 5.1.1.2 Air
- 5.1.1.3 Sea
- 5.1.1.4 Rail
- 5.1.2 Warehousing & Distribution
- 5.1.3 Value-Added Services
- 5.1.1 Transportation
- 5.2 By Source Channel
- 5.2.1 OEM Channel
- 5.2.2 Independent Aftermarket (IAM)
- 5.3 By End-Use Industry
- 5.3.1 Automotive
- 5.3.2 Aerospace & Defense
- 5.3.3 Electronics & Semiconductors
- 5.3.4 Industrial Machinery & Heavy Equipment
- 5.3.5 Energy & Power
- 5.3.6 Healthcare Equipment
- 5.3.7 Maritime & Shipbuilding
- 5.3.8 Others
- 5.4 By Business Type
- 5.4.1 Business to Business (B2B)
- 5.4.2 Business to Consumer (B2C)
- 5.5 By Geography
- 5.5.1 North America
- 5.5.1.1 United States
- 5.5.1.2 Canada
- 5.5.1.3 Mexico
- 5.5.2 South America
- 5.5.2.1 Brazil
- 5.5.2.2 Peru
- 5.5.2.3 Chile
- 5.5.2.4 Argentina
- 5.5.2.5 Rest of South America
- 5.5.3 Asia-Pacific
- 5.5.3.1 India
- 5.5.3.2 China
- 5.5.3.3 Japan
- 5.5.3.4 Australia
- 5.5.3.5 South Korea
- 5.5.3.6 South East Asia (Singapore, Malaysia, Thailand, Indonesia, Vietnam, and Philippines)
- 5.5.3.7 Rest of Asia-Pacific
- 5.5.4 Europe
- 5.5.4.1 United Kingdom
- 5.5.4.2 Germany
- 5.5.4.3 France
- 5.5.4.4 Spain
- 5.5.4.5 Italy
- 5.5.4.6 BENELUX (Belgium, Netherlands, and Luxembourg)
- 5.5.4.7 NORDICS (Denmark, Finland, Iceland, Norway, and Sweden)
- 5.5.4.8 Rest of Europe
- 5.5.5 Middle East and Africa
- 5.5.5.1 United Arab of Emirates
- 5.5.5.2 Saudi Arabia
- 5.5.5.3 South Africa
- 5.5.5.4 Nigeria
- 5.5.5.5 Rest of Middle East And Africa
- 5.5.1 North America
6 Competitive Landscape
- 6.1 Market Concentration
- 6.2 Strategic Moves
- 6.3 Market Share Analysis
- 6.4 Company Profiles (includes Global level Overview, Market level overview, Core Segments, Financials as available, Strategic Information, Products & Services, and Recent Developments)
- 6.4.1 DHL Group
- 6.4.2 Kuehne + Nagel International AG
- 6.4.3 DSV A/S
- 6.4.4 Expeditors International of Washington
- 6.4.5 C.H. Robinson
- 6.4.6 CEVA Logistics
- 6.4.7 GEODIS
- 6.4.8 XPO Logistics
- 6.4.9 Ryder System Inc.
- 6.4.10 Penske Logistics
- 6.4.11 Hitachi Transport System
- 6.4.12 Yusen Logistics (Part of NYK Line)
- 6.4.13 Nippon Express
- 6.4.14 Sinotrans
- 6.4.15 TVS Supply Chain Solutions
- 6.4.16 Choice Logistics
- 6.4.17 AIT Worldwide Logistics
- 6.4.18 Logwin AG
- 6.4.19 Kerry Logistics Network Limited
- 6.4.20 Hellmann Worldwide Logistics
7 Market Opportunities & Future Outlook

 汽車零件市場:預測至2034年-全球分析(按替換零件、車輛類型、動力傳動系統、車輛年份、服務類型、客戶細分、分銷管道和地區分類)
 2026年全球資產備件最佳化人工智慧(AI)市場報告
 備件物流市場報告:按類型、最終用戶和地區分類(2026-2034 年)2026年全球備件物流市場報告
 汽車零件物流市場:按車輛類型、物流服務類型、運輸方式、分銷管道和最終用戶分類-2026-2032年全球市場預測
 2026-2030年全球備件物流市場
 全球汽車零件物流市場規模、佔有率、趨勢及成長分析報告(2026-2034)備件物流市場:依物流服務、運輸方式、最終用戶、應用程式、產品類型、訂單類型、交貨速度和分銷管道分類,全球預測,2026-2032年2025年全球汽車零件售後市場報告
 備件物流市場機會、成長促進因素、產業趨勢分析及預測(2026-2035年)