


 |
市場調查報告書
商品編碼
1892881
備件物流市場機會、成長促進因素、產業趨勢分析及預測(2026-2035年)Spare Parts Logistics Market Opportunity, Growth Drivers, Industry Trend Analysis, and Forecast 2026 - 2035 |
||||||
2025 年全球備件物流市場價值為 232 億美元,預計到 2035 年將以 5.2% 的複合年成長率成長至 379 億美元。
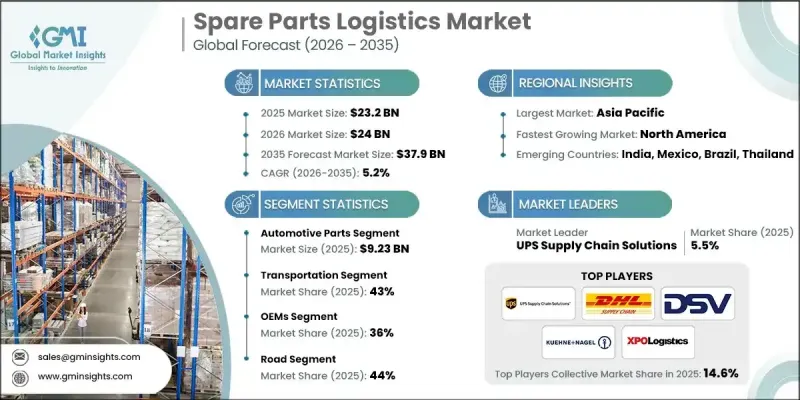
全球汽車、工業和電子設備車隊的不斷擴張推動了這一成長,也帶來了日益成長的計劃內和計劃外維護需求。企業、車隊營運商和終端用戶越來越依賴高效的備件物流網路來處理大量的庫存單位 (SKU)、時效性強的交付以及多層分銷系統,從而最大限度地減少營運停機時間。原始設備製造商 (OEM) 和物流供應商正在積極推動數位化轉型,以增強視覺性、追蹤和預測能力。雲端平台、物聯網感測器和即時分析能夠最佳化庫存管理、加快訂單履行速度並減少錯誤。 B2B 和 B2C 線上市場的興起正在重塑客戶的期望,促使供應商專注於規模更小、頻率更高、地理分佈更廣的交付。這些發展趨勢正在加強服務等級協定 (SLA),確保正常運作時間保證,並提升整體供應鏈效率。
| 市場範圍 | |
|---|---|
| 起始年份 | 2025 |
| 預測年份 | 2026-2035 |
| 起始值 | 232億美元 |
| 預測值 | 379億美元 |
| 複合年成長率 | 5.2% |
2025年,汽車零件市場規模達到92.3億美元,預計到2035年將以4.5%的複合年成長率成長。汽車保有量的成長、舊款車型需求的擴大以及線上銷售的加速發展是推動成長的主要因素。數位化解決方案正在推動更快的運輸速度、更有效率的最後一公里配送以及多倉庫策略的實施。為了滿足不斷變化的配送需求,汽車製造商和售後市場供應商正在大力投資自動化倉儲系統和整合物流平台。
預計到2025年,運輸環節將佔43%的市場佔有率,並預計在2026年至2035年間以6.4%的複合年成長率成長。備件物流高度依賴卡車、火車、航空和海運。電子商務的成長、更快的交付速度以及更精簡的庫存策略,都推動了對先進運輸網路的需求。儘管面臨貨運成本波動和地緣政治動盪等挑戰,供應商仍在開發多模式網路,並採用路線最佳化和運力管理系統,以確保網路的韌性和響應能力。
預計到2025年,美國備件物流市場將佔據86%的佔有率,創造48.7億美元的市場規模。電子商務的成長正在推動對更多物流中心、城市微型物流樞紐、當日送達服務和先進追蹤系統的需求,以提升多個行業的售後服務能力。
目錄
第1章:方法論
第2章:執行概要
第3章:行業洞察
- 產業生態系分析
- 供應商格局
- 利潤率分析
- 成本結構
- 每個階段的價值增加
- 影響價值鏈的因素
- 中斷
- 產業影響因素
- 成長促進因素
- 預測性維護的採用
- 電子商務零件擴張
- OEM垂直整合
- 物流自動化與機器人技術
- 設備電氣化程度不斷提高,零件複雜性日益增加
- 產業陷阱與挑戰
- 庫存複雜度高
- 運輸成本波動
- 市場機遇
- 積層製造在本地化生產的應用
- 人工智慧驅動的需求預測
- 數位市場的擴張
- 永續性和綠色物流
- 成長促進因素
- 成長潛力分析
- 監管環境
- 波特的分析
- PESTEL 分析
- 技術與創新格局
- 目前技術
- 新興技術
- 專利分析
- 定價分析
- 按地區
- 依產品
- 成本細分分析
- 永續性和環境方面
- 永續實踐
- 減少廢棄物策略
- 生產中的能源效率
- 環保舉措
- 碳足跡考量
第4章:競爭格局
- 介紹
- 公司市佔率分析
- 北美洲
- 歐洲
- 亞太地區
- 拉丁美洲
- MEA
- 主要市場參與者的競爭分析
- 競爭定位矩陣
- 戰略展望矩陣
- 重要新聞和舉措
- 併購
- 合作夥伴關係與合作
- 新產品發布
- 擴張計劃和資金
第5章:市場估算與預測:依備品分類,2022-2035年
- 汽車零件
- 引擎部件
- 活塞
- 過濾器
- 其他
- 變速器和傳動系統部件
- 煞車
- 暫停
- 轉向系統
- 車身及外部組件
- 電氣和電子系統
- 售後耗材
- 引擎部件
- 工業機械及設備零件
- 製造機械零件
- 馬達
- 齒輪
- 腰帶
- 工程機械部件
- 挖土機
- 裝載機
- 農業機械零件
- 聯結機
- 收割機
- 物料搬運及物流設備零件
- 液壓、氣動和機械子系統
- 製造機械零件
- 航太與國防備件
- 飛機部件
- 國防車輛部件
- 地面支援和維護設備
- 電子及半導體元件
- 半導體裝置
- 電信設備組件
- 能源與公用事業部分
- 其他
第6章:市場估算與預測:依服務類型分類,2022-2035年
- 運輸
- 倉儲
- 分配
- 庫存管理
第7章:市場估算與預測:依最終用途分類,2022-2035年
- OEM(原始設備製造商)
- 售後市場供應商
- 經銷商
- 電子商務平台
- 其他
第8章:市場估算與預測:依運輸方式分類,2022-2035年
- 路
- 軌
- 空氣
- 海
第9章:市場估計與預測:依地區分類,2022-2035年
- 北美洲
- 美國
- 加拿大
- 歐洲
- 德國
- 英國
- 法國
- 義大利
- 西班牙
- 北歐
- 荷蘭
- 俄羅斯
- 亞太地區
- 中國
- 印度
- 日本
- 澳新銀行
- 新加坡
- 泰國
- 越南
- 韓國
- 拉丁美洲
- 巴西
- 墨西哥
- 阿根廷
- MEA
- 南非
- 沙烏地阿拉伯
- 阿拉伯聯合大公國
第10章:公司簡介
- 全球參與者
- Agility Logistics
- Bollore Logistics
- CH Robinson
- CEVA Logistics
- DB Schenker
- DHL Supply Chain
- DSV Panalpina
- Expeditors International
- FedEx Supply Chain
- Hellmann Worldwide Logistics
- Kuehne+Nagel
- UPS Supply Chain Solutions
- XPO Logistics
- 區域玩家
- Ryder System
- Penske Logistics
- JB Hunt Transport Services
- BLG Logistics
- Nippon Express
- Kerry Logistics
- Yusen Logistics
- Kintetsu World Express
- COSCO Shipping Logistics
- 新興參與者和顛覆者
- Overhaul
- FourKites
- Shippeo
- Convoy
- Transfix
- Shippo
- Locus Robotics
- Imperial Logistics
The Global Spare Parts Logistics Market was valued at USD 23.2 billion in 2025 and is estimated to grow at a CAGR of 5.2% to reach USD 37.9 billion by 2035.
This growth is driven by the expanding fleets of automotive, industrial, and electronic equipment worldwide, which are creating a rising number of scheduled and unscheduled maintenance requirements. Businesses, fleet operators, and end-users are increasingly relying on efficient spare parts logistics networks to handle large volumes of SKUs, time-sensitive deliveries, and multi-tier distribution systems to minimize operational downtime. OEMs and logistics providers are embracing digital transformation to enhance visibility, tracking, and forecasting capabilities. Cloud platforms, IoT sensors, and real-time analytics enable optimized inventory management, faster order fulfillment, and reduced errors. The rise of B2B and B2C online marketplaces is reshaping customer expectations, prompting providers to focus on smaller, frequent, and geographically dispersed deliveries. These developments are strengthening service-level agreements, ensuring uptime guarantees, and enhancing overall supply chain efficiency.
| Market Scope | |
|---|---|
| Start Year | 2025 |
| Forecast Year | 2026-2035 |
| Start Value | $23.2 Billion |
| Forecast Value | $37.9 Billion |
| CAGR | 5.2% |
The automotive parts segment accounted for USD 9.23 billion in 2025 and is expected to grow at a CAGR of 4.5% through 2035. Growth is supported by rising vehicle numbers, expanding demand for older models, and accelerated online sales. Digital solutions are driving faster shipments, efficient last-mile delivery, and multi-warehouse strategies. OEMs and aftermarket suppliers are heavily investing in automated warehousing systems and integrated logistics platforms to meet evolving distribution demands.
The transportation segment held a 43% share in 2025 and is expected to grow at a CAGR of 6.4% from 2026 to 2035. Spare parts logistics depend heavily on truck, train, air, and sea transport. Growth in e-commerce, faster delivery expectations, and leaner inventory strategies are pushing the need for advanced transportation networks. Despite challenges like freight cost fluctuations and geopolitical disruptions, providers are developing multimodal networks with routing optimization and capacity management systems to ensure resilience and responsiveness.
US Spare Parts Logistics Market held 86% share in 2025, generating USD 4.87 billion. E-commerce growth is driving the need for additional fulfillment centers, urban micro-fulfillment hubs, same-day delivery, and advanced tracking systems to improve aftermarket service capabilities across multiple industries.
Key players in the Global Spare Parts Logistics Market include CEVA Logistics, DHL Supply Chain, DSV Panalpina, Penske Logistics, Ryder, XPO Logistics, DB Schenker, UPS Supply Chain Solutions, Kuehne + Nagel, and GXO Logistics. Companies in the Spare Parts Logistics Market are strengthening their market presence by investing in advanced technology solutions such as AI-driven inventory management, predictive analytics, and real-time tracking platforms. Strategic partnerships with OEMs and third-party logistics providers help expand geographic reach and improve operational efficiency. Providers are also implementing micro-fulfillment centers and last-mile delivery hubs to meet rising customer demands. Additionally, firms focus on multimodal transport solutions, routing optimization, and capacity management systems to enhance resilience and reliability.
Table of Contents
Chapter 1 Methodology
- 1.1 Market scope and definition
- 1.2 Research design
- 1.2.1 Research approach
- 1.2.2 Data collection methods
- 1.3 Data mining sources
- 1.3.1 Global
- 1.3.2 Regional/Country
- 1.4 Base estimates and calculations
- 1.4.1 Base year calculation
- 1.4.2 Key trends for market estimation
- 1.5 Primary research and validation
- 1.5.1 Primary sources
- 1.6 Forecast
- 1.7 Research assumptions and limitations
Chapter 2 Executive Summary
- 2.1 Industry 360° synopsis, 2021 - 2034
- 2.2 Key market trends
- 2.2.1 Spare part
- 2.2.2 Service
- 2.2.3 End use
- 2.2.4 Transportation mode
- 2.2.5 Regional
- 2.3 TAM Analysis, 2026-2034
- 2.4 CXO perspectives: Strategic imperatives
- 2.4.1 Executive decision points
- 2.4.2 Critical success factors
- 2.5 Future outlook and strategic recommendations
Chapter 3 Industry Insights
- 3.1 Industry ecosystem analysis
- 3.1.1 Supplier landscape
- 3.1.2 Profit margin analysis
- 3.1.3 Cost structure
- 3.1.4 Value addition at each stage
- 3.1.5 Factor affecting the value chain
- 3.1.6 Disruptions
- 3.2 Industry impact forces
- 3.2.1 Growth drivers
- 3.2.1.1 Predictive maintenance adoption
- 3.2.1.2 E-commerce parts expansion
- 3.2.1.3 OEM vertical integration
- 3.2.1.4 Logistics automation & robotics
- 3.2.1.5 Increasing equipment electrification & component complexity
- 3.2.2 Industry pitfalls and challenges
- 3.2.2.1 High inventory complexity
- 3.2.2.2 Transportation cost volatility
- 3.2.3 Market opportunities
- 3.2.3.1 Additive manufacturing for localized production
- 3.2.3.2 Ai-driven demand forecasting
- 3.2.3.3 Expansion of digital marketplaces
- 3.2.3.4 Sustainability and green logistics
- 3.2.1 Growth drivers
- 3.3 Growth potential analysis
- 3.4 Regulatory landscape
- 3.4.1 North America
- 3.4.2 Europe
- 3.4.3 Asia Pacific
- 3.4.4 Latin America
- 3.4.5 Middle east and Africa
- 3.5 Porter's analysis
- 3.6 PESTEL analysis
- 3.7 Technology and Innovation landscape
- 3.7.1 Current technology
- 3.7.2 Emerging technology
- 3.8 Patent analysis
- 3.9 Pricing analysis
- 3.9.1 By region
- 3.9.2 By product
- 3.10 Cost breakdown analysis
- 3.11 Sustainability and environmental aspects
- 3.12 Sustainable practices
- 3.13 Waste reduction strategies
- 3.14 Energy efficiency in production
- 3.15 Eco-friendly initiatives
- 3.16 Carbon footprint considerations
Chapter 4 Competitive Landscape, 2025
- 4.1 Introduction
- 4.2 Company market share analysis
- 4.2.1 North America
- 4.2.2 Europe
- 4.2.3 Asia Pacific
- 4.2.4 LATAM
- 4.2.5 MEA
- 4.3 Competitive analysis of major market players
- 4.4 Competitive positioning matrix
- 4.5 Strategic outlook matrix
- 4.6 Key news and initiatives
- 4.6.1 Mergers & acquisitions
- 4.6.2 Partnerships & collaborations
- 4.6.3 New Product Launches
- 4.6.4 Expansion Plans and funding
Chapter 5 Market Estimates & Forecast, By Spare Part, 2022 - 2035 ($Bn)
- 5.1 Key trends
- 5.2 Automotive parts
- 5.2.1 Engine components
- 5.2.1.1 Pistons
- 5.2.1.2 Filters
- 5.2.1.3 Others
- 5.2.2 Transmission and drivetrain parts
- 5.2.2.1 Brakes
- 5.2.2.2 Suspension
- 5.2.2.3 Steering systems
- 5.2.3 Body and exterior components
- 5.2.4 Electrical and electronic systems
- 5.2.5 Aftermarket consumables
- 5.2.1 Engine components
- 5.3 Industrial machinery & equipment components
- 5.3.1 Manufacturing machinery parts
- 5.3.1.1 Motors
- 5.3.1.2 Gears
- 5.3.1.3 Belts
- 5.3.2 Construction equipment components
- 5.3.2.1 Excavators
- 5.3.2.2 Loaders
- 5.3.3 Agricultural machinery parts
- 5.3.3.1 Tractors
- 5.3.3.2 Harvesters
- 5.3.4 Material handling and logistics equipment components
- 5.3.5 Hydraulic, pneumatic, and mechanical subsystems
- 5.3.1 Manufacturing machinery parts
- 5.4 Aerospace & defense spare parts
- 5.4.1 Aircraft components
- 5.4.2 Defense vehicle parts
- 5.4.3 Ground support and maintenance equipment
- 5.5 Electronics & semiconductor components
- 5.5.1 Semiconductor devices
- 5.5.2 Telecommunications equipment components
- 5.6 Energy & utilities parts
- 5.7 Others
Chapter 6 Market Estimates & Forecast, By Service, 2022 - 2035 ($Bn)
- 6.1 Key trends
- 6.2 Transportation
- 6.3 Warehousing
- 6.4 Distribution
- 6.5 Inventory management
Chapter 7 Market Estimates & Forecast, By End Use, 2022 - 2035 ($Bn)
- 7.1 Key trends
- 7.2 OEMs (Original Equipment Manufacturers)
- 7.3 Aftermarket Suppliers
- 7.4 Dealerships
- 7.5 E-commerce Platforms
- 7.6 Others
Chapter 8 Market Estimates & Forecast, By Transportation mode, 2022 - 2035 ($Bn)
- 8.1 Key trends
- 8.2 Road
- 8.3 Rail
- 8.4 Air
- 8.5 Sea
Chapter 9 Market Estimates & Forecast, By Region, 2022 - 2035 ($Bn)
- 9.1 Key trends
- 9.2 North America
- 9.2.1 US
- 9.2.2 Canada
- 9.3 Europe
- 9.3.1 Germany
- 9.3.2 UK
- 9.3.3 France
- 9.3.4 Italy
- 9.3.5 Spain
- 9.3.6 Nordics
- 9.3.7 Netherlands
- 9.3.8 Russia
- 9.4 Asia Pacific
- 9.4.1 China
- 9.4.2 India
- 9.4.3 Japan
- 9.4.4 ANZ
- 9.4.5 Singapore
- 9.4.6 Thailand
- 9.4.7 Vietnam
- 9.4.8 South Korea
- 9.5 Latin America
- 9.5.1 Brazil
- 9.5.2 Mexico
- 9.5.3 Argentina
- 9.6 MEA
- 9.6.1 South Africa
- 9.6.2 Saudi Arabia
- 9.6.3 UAE
Chapter 10 Company Profiles
- 10.1 Global Players
- 10.1.1 Agility Logistics
- 10.1.2 Bollore Logistics
- 10.1.3 C.H. Robinson
- 10.1.4 CEVA Logistics
- 10.1.5 DB Schenker
- 10.1.6 DHL Supply Chain
- 10.1.7 DSV Panalpina
- 10.1.8 Expeditors International
- 10.1.9 FedEx Supply Chain
- 10.1.10 Hellmann Worldwide Logistics
- 10.1.11 Kuehne+Nagel
- 10.1.12 UPS Supply Chain Solutions
- 10.1.13 XPO Logistics
- 10.2 Regional Players
- 10.2.1 Ryder System
- 10.2.2 Penske Logistics
- 10.2.3 J.B. Hunt Transport Services
- 10.2.4 BLG Logistics
- 10.2.5 Nippon Express
- 10.2.6 Kerry Logistics
- 10.2.7 Yusen Logistics
- 10.2.8 Kintetsu World Express
- 10.2.9 COSCO Shipping Logistics
- 10.3 Emerging players and disruptors
- 10.3.1 Overhaul
- 10.3.2 FourKites
- 10.3.3 Shippeo
- 10.3.4 Convoy
- 10.3.5 Transfix
- 10.3.6 Shippo
- 10.3.7 Locus Robotics
- 10.3.8 Imperial Logistics
 2026年全球資產備件最佳化人工智慧(AI)市場報告2026年全球備件物流市場報告
 汽車零件物流市場:按車輛類型、物流服務類型、運輸方式、分銷管道和最終用戶分類-2026-2032年全球市場預測
 2026-2030年全球備件物流市場
 全球汽車零件物流市場規模、佔有率、趨勢及成長分析報告(2026-2034)備件物流市場:依物流服務、運輸方式、最終用戶、應用程式、產品類型、訂單類型、交貨速度和分銷管道分類,全球預測,2026-2032年2025年全球汽車零件售後市場報告備件物流市場規模、佔有率、成長及全球產業分析:依類型、應用和地區劃分的洞察,以及2024年至2032年的預測備品物流的全球市場規模:各終端用戶,各運輸方法,各地區,範圍及預測
 全球備品物流市場