


 |
市場調查報告書
商品編碼
1959628
離岸風力發電市場機會、成長要素、產業趨勢分析及2026年至2035年預測Offshore Wind Energy Market Opportunity, Growth Drivers, Industry Trend Analysis, and Forecast 2026 - 2035 |
||||||
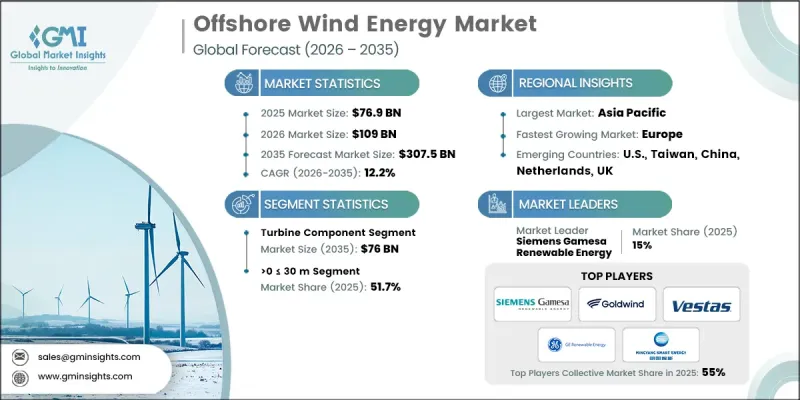
2025年全球離岸風力發電市場價值為769億美元,預計2035年將達到3075億美元,年複合成長率為12.2%。
在電力需求不斷成長和減少碳排放受到重視的推動下,世界各國政府正在推行扶持政策和法規結構,以促進離岸風力發電投資。上網電價補貼、特定技術的部署目標以及競爭性競標流程等機制正惠及整個產業。包括先進船舶、電網連接和更有效率的安裝方法在內的整個供應鏈的改進,正在縮短計劃工期並降低成本。導管架和單樁結構等基礎技術的創新,使得在更深、更具挑戰性的海洋環境中開展計劃成為可能。上網電價補貼(FIT)和差價合約(CfD)等政策提供了可預測的收入來源,提高了開發商的財務穩定性。此外,綠色債券、長期購電協議(PPA)以及對海上輸電基礎設施的投資正在加速全球市場成長。
| 市場範圍 | |
|---|---|
| 開始年份 | 2025 |
| 預測年份 | 2026-2035 |
| 起始值 | 769億美元 |
| 預測金額 | 3075億美元 |
| 複合年成長率 | 12.2% |
預計到2035年,風力渦輪機市場規模將達到760億美元,主要得益於更大、更有效率的渦輪機能夠降低每兆瓦時電力的成本。更長的葉片和更高的塔筒將有助於利用更強、更穩定的風力,從而提高能源回收回收率。領先的渦輪機製造商包括維斯塔斯(Vestas)、西門子歌美颯再生能源公司(Siemens Gamesa Renewable Energy)和通用電氣再生能源公司(GE Renewable Energy),而中國的金風科技(Goldwind)和民陽科技(Minyang)也迅速擴大市場佔有率。
預計到2035年,水深超過50公尺的離岸風計劃將以28.5%的複合年成長率成長,這主要得益於浮體式渦輪機技術的發展,例如立柱式浮標、半潛式平台和張力腳平臺。日本的《專屬經濟海域法》和韓國的《離岸風力發電法》等扶持政策正加速深海域浮體式海上風電的推廣應用。
2025年,美國離岸風力發電市場規模預計為31億美元,預計在2026年至2035年間以8.5%的複合年成長率成長。在技術進步、有利政策和環保舉措的推動下,北美地區到2025年將佔據4%的市場。紐約州、新澤西州、麻薩諸塞州、康乃狄克州、羅德島州、馬裡蘭州、維吉尼亞和北卡羅來納州等州已製定了雄心勃勃的離岸風電發展目標。對渦輪機、葉片、塔筒、基礎和電纜製造設施的投資,以及在東海岸、墨西哥灣沿岸和西海岸建設的專用離岸風電港口,正在推動市場進一步擴張。
目錄
第1章:調查方法和範圍
第2章執行摘要
第3章業界考察
- 產業生態系統
- 原物料供應及採購分析
- 製造能力評估
- 供應鏈韌性與風險因素
- 配電網路分析
- 監管環境
- 影響產業的因素
- 促進因素
- 產業潛在風險與挑戰
- 成長潛力分析
- 價格趨勢分析
- 按深度
- 按地區
- 成本結構分析
- 波特五力分析
- PESTEL 分析
- 新機會與趨勢
- 數位化和物聯網整合
- 進入新興市場
- 投資分析及未來展望
第4章 競爭情勢
- 介紹
- 企業市佔率分析
- 北美洲
- 歐洲
- 亞太地區
- 世界其他地區
- 戰略儀錶板
- 策略舉措
- 創新與科技趨勢
第5章 市場規模及預測:依組件分類,2022-2035年
- 渦輪
- 等級
- ≤ 2 兆瓦
- 2 至 5 兆瓦
- >5<=8兆瓦
- >8<=10兆瓦
- >10<=12 MW
- 大於12兆瓦
- 安裝
- 浮體式
- 軸
- 水平的
- 上風側
- 順風
- 垂直的
- 水平的
- 成分
- 刀刃
- 塔
- 其他
- 軸
- 固定的
- 軸
- 水平的
- 上風側
- 順風
- 垂直的
- 水平的
- 成分
- 刀刃
- 塔
- 其他
- 軸
- 浮體式
- 等級
- 支持結構
- 下部結構(鋼結構)
- 基礎
- 單樁
- 夾克
- 其他
- 電力基礎設施
- 電線電纜
- 變電站
- 其他
- 其他
第6章 市場規模及預測:依深度分類,2022-2035年
- 0-30米或更短
- 超過30米但不足50米
- 超過50米
第7章 市場規模及預測:依地區分類,2022-2035年
- 北美洲
- 美國
- 加拿大
- 歐洲
- 德國
- 西班牙
- 英國
- 法國
- 義大利
- 瑞典
- 波蘭
- 丹麥
- 葡萄牙
- 荷蘭
- 愛爾蘭
- 比利時
- 亞太地區
- 中國
- 印度
- 澳洲
- 日本
- 韓國
- 越南
- 菲律賓
- 台灣
- 世界其他地區
第8章:公司簡介
- China Longyuan Power Group
- Enessere
- Equinor ASA
- Furukawa Electric
- General Electric
- Global Energy(Group)Limited
- Goldwind
- IMPSA
- LS Cable &System
- Nexans
- Nordex SE
- Ørsted A/S
- Prysmian Group
- RWE Renewables
- Siemens Gamesa Renewable Energy
- Sumitomo Electric Industries
- Southwire Company
- Suzlon Energy Limited
- Vestas
- WEG
The Global Offshore Wind Energy Market was valued at USD 76.9 billion in 2025 and is estimated to grow at a CAGR of 12.2% to reach USD 307.5 billion by 2035.
Rising electricity demand, coupled with increased focus on reducing carbon emissions, has encouraged governments to implement supportive policies and regulatory frameworks, driving investments in offshore wind. The industry benefits from mechanisms such as fixed tariffs, technology-specific deployment targets, and competitive auction processes. Improvements across the supply chain, including advanced vessels, grid integration, and streamlined installation methods, are reducing project timelines and lowering costs. Innovations in foundation technologies, such as jacket and monopile structures, enable projects in deeper and more challenging marine environments. Policies like Feed-in Tariffs (FiTs) and Contracts for Difference (CfD) provide predictable revenue streams, enhancing financial security for developers. Additionally, green bonds, long-term Power Purchase Agreements (PPAs), and investment in offshore transmission infrastructure are accelerating market growth globally.
| Market Scope | |
|---|---|
| Start Year | 2025 |
| Forecast Year | 2026-2035 |
| Start Value | $76.9 Billion |
| Forecast Value | $307.5 Billion |
| CAGR | 12.2% |
The turbine segment is expected to reach USD 76 billion by 2035 as larger, more efficient turbines reduce the cost per MWh of electricity. Extended blade lengths and taller towers allow access to stronger, consistent winds, improving energy capture. Leading turbine manufacturers include Vestas, Siemens Gamesa Renewable Energy, and GE Renewable Energy, with Chinese players Goldwind and MingYang rapidly expanding their market presence.
The projects in water depths exceeding 50 meters are anticipated to grow at a CAGR of 28.5% through 2035, driven by floating turbine technologies such as spar-buoy, semi-submersible, and tension-leg platforms. Supportive policies like Japan's EEZ Bill and South Korea's OSS Bill are accelerating deepwater floating wind deployment.
U.S. Offshore Wind Energy Market was valued at USD 3.1 billion in 2025 and is forecasted to grow at a CAGR of 8.5% between 2026 and 2035. North America held a 4% market share in 2025, supported by technological advancements, favorable policies, and environmental initiatives. States including New York, New Jersey, Massachusetts, Connecticut, Rhode Island, Maryland, Virginia, and North Carolina are setting ambitious offshore wind targets. Investments in turbines, blade, tower, foundation, and cable manufacturing facilities, along with dedicated offshore wind ports on the East, Gulf, and West Coasts, are further driving market expansion.
Key players in the Global Offshore Wind Energy Market include Orsted A/S, Siemens Gamesa Renewable Energy, Vestas, GE Renewable Energy, Goldwind, China Longyuan Power Group, Enessere, Equinor ASA, Furukawa Electric, Global Energy (Group) Limited, IMPSA, LS Cable & System, Nexans, Nordex SE, Prysmian Group, RWE Renewables, Sumitomo Electric Industries, Southwire Company, Suzlon Energy Limited, and WEG. Key strategies adopted by companies in the offshore wind energy market include expanding global manufacturing and supply chain capabilities to reduce lead times, investing in R&D for larger and more efficient turbines, and deploying advanced floating foundation technologies to access deeper waters. Companies are also securing long-term Power Purchase Agreements (PPAs) to ensure steady revenue streams and participate in government-led competitive auctions to gain high-value contracts. Strategic partnerships with port operators, shipping companies, and local suppliers help optimize logistics and installation processes. Additionally, players are focusing on sustainability certifications and eco-friendly designs to strengthen brand credibility and align with regulatory requirements, enhancing their competitive positioning in the global offshore wind energy market.
Table of Contents
Chapter 1 Methodology & Scope
- 1.1 Research design
- 1.1.1 Research approach
- 1.1.2 Data collection methods
- 1.2 Base estimates and calculations
- 1.2.1 Base year calculation
- 1.2.2 Key trends for market estimates
- 1.3 Forecast model
- 1.3.1 Key trends for market estimates
- 1.3.1.1 Quantified market impact analysis
- 1.3.1.2 Mathematical impact of growth parameters on forecast
- 1.3.2 Scenario analysis framework
- 1.3.1 Key trends for market estimates
- 1.4 Primary research and validation
- 1.4.1 Some of the primary sources (but not limited to)
- 1.5 Data mining sources
- 1.5.1 Paid Sources
- 1.5.2 Sources, by region
- 1.6 Research trail & scoring components
- 1.6.1 Research trail components
- 1.6.2 Scoring components
- 1.7 Research transparency addendum
- 1.7.1 Source attribution framework
- 1.7.2 Quality assurance metrics
- 1.7.3 Our commitment to trust
- 1.8 Market definitions
Chapter 2 Executive Summary
- 2.1 Industry 360-degree synopsis, 2022 - 2035
- 2.2 Business trends
- 2.3 Component trends
- 2.4 Depth trends
- 2.5 Regional trends
Chapter 3 Industry Insights
- 3.1 Industry ecosystem
- 3.1.1 Raw material availability & sourcing analysis
- 3.1.2 Manufacturing capacity assessment
- 3.1.3 Supply chain resilience & risk factors
- 3.1.4 Distribution network analysis
- 3.2 Regulatory landscape
- 3.3 Industry impact forces
- 3.3.1 Growth drivers
- 3.3.2 Industry pitfalls & challenges
- 3.4 Growth potential analysis
- 3.5 Price trend analysis
- 3.5.1 By depth
- 3.5.2 By region
- 3.6 Cost structure analysis
- 3.7 Porter's analysis
- 3.7.1 Bargaining power of suppliers
- 3.7.2 Bargaining power of buyers
- 3.7.3 Threat of new entrants
- 3.7.4 Threat of substitutes
- 3.8 PESTEL analysis
- 3.8.1 Political factors
- 3.8.2 Economic factors
- 3.8.3 Social factors
- 3.8.4 Technological factors
- 3.8.5 Legal factors
- 3.8.6 Environmental factors
- 3.9 Emerging opportunities & trends
- 3.9.1 Digitalization & IoT integration
- 3.9.2 Emerging market penetration
- 3.10 Investment analysis and future outlook
Chapter 4 Competitive landscape, 2026
- 4.1 Introduction
- 4.2 Company market share analysis, 2025
- 4.2.1 North America
- 4.2.2 Europe
- 4.2.3 Asia Pacific
- 4.2.4 Rest of World
- 4.3 Strategic dashboard
- 4.4 Strategic initiatives
- 4.5 Innovation & technology landscape
Chapter 5 Market Size and Forecast, By Component, 2022 - 2035 (USD Billion & MW)
- 5.1 Key trends
- 5.2 Turbine
- 5.2.1 Rating
- 5.2.1.1 ≤ 2 MW
- 5.2.1.2 >2≤ 5 MW
- 5.2.1.3 >5≤ 8 MW
- 5.2.1.4 >8≤10 MW
- 5.2.1.5 >10≤ 12 MW
- 5.2.1.6 > 12 MW
- 5.2.2 Installation
- 5.2.2.1 Floating
- 5.2.2.1.1 Axis
- 5.2.2.1.1.1 Horizontal
- 5.2.2.1.1.1.1 Up wind
- 5.2.2.1.1.1.2 Down wind
- 5.2.2.1.1.2 Vertical
- 5.2.2.1.1.1 Horizontal
- 5.2.2.1.2 Component
- 5.2.2.1.2.1 Blade
- 5.2.2.1.2.2 Towers
- 5.2.2.1.2.3 Others
- 5.2.2.1.1 Axis
- 5.2.2.2 Fixed
- 5.2.2.2.1 Axis
- 5.2.2.2.1.1 Horizontal
- 5.2.2.2.1.1.1 Up wind
- 5.2.2.2.1.1.2 Down wind
- 5.2.2.2.1.2 Vertical
- 5.2.2.2.1.1 Horizontal
- 5.2.2.2.2 Component
- 5.2.2.2.2.1 Blade
- 5.2.2.2.2.2 Towers
- 5.2.2.2.2.3 Others
- 5.2.2.2.1 Axis
- 5.2.2.1 Floating
- 5.2.1 Rating
- 5.3 Support structure
- 5.3.1 Substructure (Steel)
- 5.3.2 Foundation
- 5.3.2.1 Monopile
- 5.3.2.2 Jacket
- 5.3.3 Others
- 5.4 Electrical Infrastructure
- 5.4.1 Wires & Cables
- 5.4.2 Substation
- 5.4.3 Others
- 5.5 Others
Chapter 6 Market Size and Forecast, By Depth, 2022 - 2035 (USD Billion & MW)
- 6.1 Key trends
- 6.2 > 0 to ≤ 30 m
- 6.3 > 30 to ≤ 50 m
- 6.4 > 50 m
Chapter 7 Market Size and Forecast, By Region, 2022 - 2035 (USD Billion & MW)
- 7.1 Key trends
- 7.2 North America
- 7.2.1 U.S.
- 7.2.2 Canada
- 7.3 Europe
- 7.3.1 Germany
- 7.3.2 Spain
- 7.3.3 UK
- 7.3.4 France
- 7.3.5 Italy
- 7.3.6 Sweden
- 7.3.7 Poland
- 7.3.8 Denmark
- 7.3.9 Portugal
- 7.3.10 Netherlands
- 7.3.11 Ireland
- 7.3.12 Belgium
- 7.4 Asia Pacific
- 7.4.1 China
- 7.4.2 India
- 7.4.3 Australia
- 7.4.4 Japan
- 7.4.5 South Korea
- 7.4.6 Vietnam
- 7.4.7 Philippines
- 7.4.8 Taiwan
- 7.5 Rest of World
Chapter 8 Company Profiles
- 8.1 China Longyuan Power Group
- 8.2 Enessere
- 8.3 Equinor ASA
- 8.4 Furukawa Electric
- 8.5 General Electric
- 8.6 Global Energy (Group) Limited
- 8.7 Goldwind
- 8.8 IMPSA
- 8.9 LS Cable & System
- 8.10 Nexans
- 8.11 Nordex SE
- 8.12 Ørsted A/S
- 8.13 Prysmian Group
- 8.14 RWE Renewables
- 8.15 Siemens Gamesa Renewable Energy
- 8.16 Sumitomo Electric Industries
- 8.17 Southwire Company
- 8.18 Suzlon Energy Limited
- 8.19 Vestas
- 8.20 WEG
 2026-2034年全球離岸風力發電電纜市場規模、佔有率、趨勢和成長分析報告
 離岸風力發電市場預測-按組件、位置、最終用戶和地區分類的全球分析-2034年
 離岸風力發電:市場佔有率分析、產業趨勢與統計及成長預測(2026-2031)
 離岸風力發電市場:按組件、基礎類型、渦輪機功率、應用和最終用戶分類-2026-2032年全球市場預測
 離岸風力發電市場:依基礎類型、組件、安裝地點和區域分類
 2026年全球離岸風電市場報告
 離岸風力發電市場報告:按組件、基礎類型、容量、位置和地區分類(2026-2034 年)離岸風力發電單樁市場依結構類型、水深等級、風扇容量等級及最終用戶分類,2026-2032年預測近期技術發展及電力製X路徑的技術經濟評估離岸風力發電貫入試驗市場規模、佔有率、成長及全球產業分析:按類型、應用和地區的洞察,2026-2034年預測