


 |
市場調查報告書
商品編碼
2061595
智慧交通系統:市場佔有率分析、產業趨勢與統計、成長預測(2026-2031)Intelligent Transport Systems - Market Share Analysis, Industry Trends & Statistics, Growth Forecasts (2026 - 2031) |
||||||
※ 本網頁內容可能與最新版本有所差異。詳細情況請與我們聯繫。
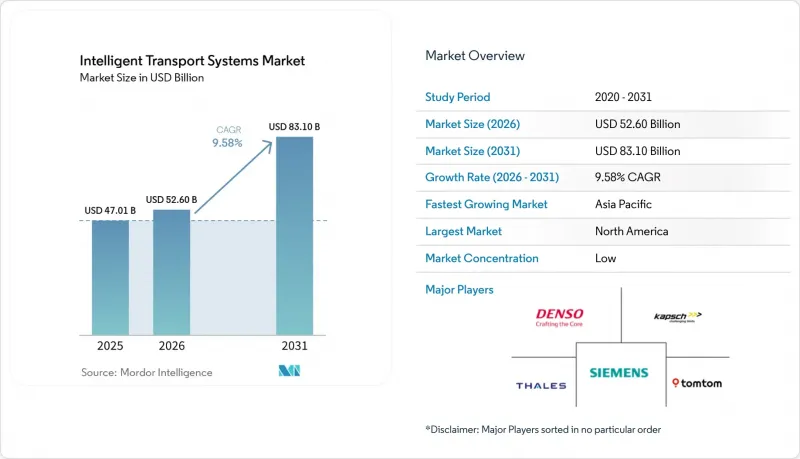
根據 Mordor Intelligence 預測,智慧型運輸系統(ITS) 的市場規模預計將從 2025 年的 470.1 億美元成長到 2026 年的 526 億美元,到 2031 年將達到 831 億美元。
預計從 2026 年到 2031 年,其複合年成長率將達到 9.58%。
本報告按運輸方式(公路、鐵路等)、組件(硬體、軟體等)、類型(自動交通管理系統、自動交通資訊系統等)、應用(交通管理等)、部署方式(本地部署、雲端部署等)、技術(物聯網感測器和車聯網、人工智慧和機器學習分析等)以及地區進行細分。市場預測以美元計價。
全球智慧型運輸系統(ITS)市場趨勢與洞察
政府對智慧城市和交通安全的投入正在激增。
聯邦和超國家計畫正以前所未有的規模投入資金,用於開發互聯互通的交通走廊。光是2024年,美國運輸部就撥款5,400萬美元用於智慧交通系統(SMART)津貼,旨在幫助各機構從被動的交通規劃轉向人工智慧驅動的預測性交通流量控制。同時,歐盟的「數位歐洲」計畫已撥款75億歐元用於數位基礎建設,目標是在2027年前建成,其中智慧交通系統(ITS)是核心,旨在減少排放並提升競爭力。州級項目,例如亞利桑那州耗資1960萬美元的V2X走廊項目,展現了資金如何迅速轉化為能夠產生可貨幣化數據的資產。曾經長達五年的合約授予週期,如今已縮短至兩年以內,這使得那些能夠提供即用型硬體和承包分析解決方案的供應商更具優勢。採用者透過在其他地區擁有同等感測器密度之前收集資料流,從而獲得持續的先發優勢。
都市區日益嚴重,迫使人們引入自動交通管理系統(ATMMS)。
日常交通堵塞已使先進的交通管理系統從「錦上添花」變為「必不可少」。馬裡蘭州安娜德爾縣的一項審計顯示,每個繁忙路口每年因交通堵塞造成的損失高達32.4萬美元的時間成本和4.8萬美元的額外燃油成本,這推動了先進交通管理系統(ATMS)的快速部署。北京的「車路雲一體化」計畫已將1,200個路口的平均通行時間縮短了15%,迫使其他大都會效仿。在波士頓,人工智慧驅動的號誌燈調整已將市中心主要路口的停車次數減少了30%,這表明傳統的控制設備可以透過軟體再利用,而無需徹底的重建。預計到2024年,不斷上漲的鋼材和瀝青價格將使高速公路建設成本增加24%。這使得軟體最佳化成為預算緊張的政府機構唯一可行的交通堵塞解決方案。
高額資本投資及現有基礎建設維修成本
2024年,公路建設成本的年通膨率達24%,導致預算實際價值縮水,迫使各機構延後非緊急升級項目。據美國鋼鐵協會(AISI)稱,鋼材價格上漲11.2%,使兩黨共同支持的基礎設施法案的購買力下降了約40%。大規模維修項目,例如哥本哈根耗資8,000萬歐元的智慧照明項目,仍需數年時間才能收回投資,且在市政債市場資金籌措困難。因此,許多機構正將重點從批量更換控制器轉向分階段、軟體優先的升級改造,以延長模擬控制面板的使用壽命。由於整合成本通常高於設備價格,採購部門必須將現代化改造工作分散到多個財政年度,減緩了系統整體效能的提升。
細分市場分析
預計到2025年,航運業僅佔智慧型運輸系統收入的6.35%,但隨著自動化、數位雙胞胎和自動駕駛拖船等技術在港口的應用,其複合年成長率(CAGR)預計將達到12.86%,成為成長最快的產業。公路運輸業將維持61.45%的市場佔有率,並在國家安全項目的支持下,佔據智慧型運輸系統(ITS)市場規模的最大佔有率。投資配備人工智慧視覺和5G通訊技術的岸橋將提高泊位容量,並透過與卡車車隊的協調,將貨櫃的停留時間縮短20%。億航智慧推出的自動駕駛空中計程車「EH216 S」展示了空中航線如何繞過地面瓶頸,儘管該子部門仍處於發展初期。鐵路運輸的優點在於擁有優先通行權。美國貨運鐵路營運商利用邊緣分析技術在故障發生前數小時進行檢測,從而將機車故障率降低了40%。
展望未來,多模態將協調航運時刻表、鐵路車次和公路運輸資源分配,從而提高系統的整體資產利用率。在智慧型運輸系統(ITS)市場,基於單一資料架構對海運、鐵路和公路物流流程建模的解決方案正日益普及。中國的港口雲端平台已整合堆場起重機、閘口攝影機和海關資料庫,引領全球應用。目前,一些公路計畫正在試驗採用C-V2X(車聯網)技術的交叉路口,該技術可將訊號燈時間資訊傳輸給重型卡車,從而減少因怠速造成的油耗。這些趨勢共同推動資金向軟體層面轉移,該軟體負責平衡不同運輸方式之間的貨物運輸,從而減少尖峰時段的交通堵塞和排放氣體。
儘管硬體在2025年仍將佔銷售額的48.55%,但軟體13.84%的複合年成長率顯示市場正在發生重大轉變。各機構優先考慮能夠適應不斷變化的安全標準的靈活許可模式,而永久許可控制器正逐步被淘汰。在軟體包中,服務、諮詢、整合和託管網路安全服務成長最為迅速,這反映出市場需要持續最佳化而非週期性更換設備。隨著物聯網節點的商品化,硬體在智慧交通系統(ITS)市場的佔有率將會下降。路側單元(RSU)將轉變為簡單的數據採集設備,為人工智慧管道提供數據。
如今,供應商將分析儀表板與韌體更新捆綁銷售,將一次性交易轉化為持續的收入來源。邊緣容器支援新演算法的空中下載 (OTA) 部署,延長硬體壽命並降低總體擁有成本 (TCO),這在預算受限的環境中是一個關鍵的賣點。隨著模組化閘道取代整體式機櫃,採購模式也從資本支出轉向類似 SaaS 的營運成本模式。這形成了一個良性循環:經常性收入被重新投入研發,從而提升系統效能並進一步加深客戶對平台的依賴。
區域分析
到2025年,北美將佔智慧型運輸系統(ITS)市場收入的27.65%。聯邦政府對聯網汽車的撥款,包括2025會計年度620億美元的撥款,正在提升計畫的可見度,並刺激各州進行後續計畫。亞利桑那州耗資1960萬美元的V2X走廊項目已展現出可複製的投資回報率,而德克薩斯州交通部(DOT)的C-V2X交叉路口試驗則使該地區成為基礎設施-車輛融合領域的領導者。社會目標也被納入地方政府的試點計畫。阿布奎基市的微型公車服務將雜貨店與交通不便的地區連接起來,展示了數據豐富的系統如何解決公平性差異問題。清晰的問責框架和充足的創業投資正在吸引邊緣人工智慧新創公司參與公共部門的競標,與監管不透明的地區相比,這加快了專案的部署速度。
亞太地區是成長最快的地區,預計到2031年將維持10.16%的複合年成長率。城市堵塞和政府對數位經濟目標的支持正在推動該地區積極部署。億航的無人飛行計程車EH216 S已在中國獲得載客飛行許可,凸顯了先進空中運輸監管的柔軟性。北京覆蓋1200個路口的「車路雲」互聯系統已將出行時間縮短了15%,並成為國家標準的基礎。新加坡10億新元的AI基金和中國在2025年實現2,000萬輛新能源汽車的目標,為供應商提供了可預測的需求曲線。機器人計程車合作計畫正從試點計畫擴展到商業化階段,小馬AI在深圳簽訂的1000輛訂單鞏固了商業化進程,並增加了提供給分析引擎的數據量。
在歐洲,隨著安全和氣候變遷相關法規的協調統一,智慧交通系統(ITS)的穩定發展仍在持續。通用安全法規II強制要求安裝ADAS設備,並要求路邊設施與新一代車隊之間進行資料交換。哥本哈根一項耗資8,000萬歐元的智慧照明維修計畫實現了55%的節能,充分展現了ITS預算如何與碳排放目標相契合。歐盟的「數位歐洲基金」計畫到2027年撥款75億歐元,為數位雙胞胎孿生試點計畫和跨境走廊提供資金支持。西門子交通集團與德國鐵路公司簽署的數十億歐元契約,體現了對承包平台的採購,而非零散的升級改造。同時,嚴格的GDPR和人工智慧透明度法規雖然減緩了智慧交通系統的普及速度,但也增強了公眾信心,並促進了永續的市場滲透。
其他好處:
- Excel格式的市場預測(ME)表
- 3個月的分析師支持
目錄
第1章:引言
- 研究假設和市場定義
- 調查範圍
第2章:調查方法
第3章執行摘要
第4章 市場狀況
- 市場概覽
- 市場促進因素
- 政府對智慧城市和交通安全的投入正在迅速增加。
- 日益嚴重的都市區堵塞問題,使得引進自動交通管理系統(ATMMS)成為必要。
- 強制性交通安全法規(e-Call、ADAS整合)
- 邊緣原生AI數位雙胞胎可實現即時流程最佳化。
- 電動車充電基礎設施與智慧交通系統平台的整合
- 透過聯網汽車分析實現數據貨幣化模型
- 市場限制因素
- 維修現有基礎設施需要大量資本投資和成本
- 區域間標準的互通性和碎片化
- 與網路安全相關的法律責任和合規成本增加
- 有關人工智慧演算法透明度的法規正在減緩先進技術的應用。
- 產業價值鏈分析
- 監理情勢
- 技術展望
- 波特五力分析
- 投資分析
第5章 市場規模與成長預測
- 透過交通工具
- 路
- 鐵路
- 航空
- 海上運輸
- 按組件
- 硬體
- 軟體
- 服務
- 按類型
- 智慧型運輸管理系統(ATMS)
- 高級旅行資訊系統(ATIS)
- 智慧型運輸收費系統(ATPS)
- 先進公共運輸系統(APTS)
- 先進商用車輛運行(ACVOS)
- 協同式車輛-基礎設施系統(CVIS)
- 透過使用
- 交通管理
- 大眾運輸和車票發行
- 道路安全保障
- 貨物和車輛管理
- 環境和排放氣體監測
- 智慧停車和引導系統
- 通行費和壅塞費
- 支援連網自動駕駛汽車(CAV)
- 其他用途
- 部署模式
- 現場
- 雲
- 邊緣/霧
- 透過技術
- 物聯網感測器和V2X
- 人工智慧和機器學習分析
- 數位雙胞胎平台
- 5G 和 C-V2X 連接
- 按地區
- 北美洲
- 美國
- 加拿大
- 墨西哥
- 南美洲
- 巴西
- 阿根廷
- 其他南美國家
- 歐洲
- 德國
- 英國
- 法國
- 義大利
- 西班牙
- 其他歐洲國家
- 亞太地區
- 中國
- 日本
- 韓國
- 印度
- 其他亞太國家
- 中東
- 沙烏地阿拉伯
- 阿拉伯聯合大公國
- 土耳其
- 其他中東國家
- 非洲
- 南非
- 奈及利亞
- 埃及
- 其他非洲國家
- 北美洲
第6章 競爭情勢
- 市場集中度
- 策略趨勢
- 市佔率分析
- 公司簡介
- Siemens AG
- Thales Group
- IBM Corporation
- Garmin Ltd.
- NoTraffic
- TomTom NV
- Cubic Corporation
- Mobileye
- Applied Information
- Denso Corporation
- Cisco Systems Inc.
- Kapsch TrafficCom AG
- Huawei Technologies Co. Ltd.
- Iteris Inc.
- Q-Free ASA
- Swarco AG
- TransCore LP
- Advantech Co. Ltd.
- Continental AG
- Siemens Mobility(Yunex Traffic)
- AtkinsRealis
- Econolite Group Inc.
第7章 市場機會與未來展望
According to Mordor Intelligence, the intelligent transport systems market size is expected to increase from USD 47.01 billion in 2025 to USD 52.60 billion in 2026 and reach USD 83.10 billion by 2031, growing at a CAGR of 9.58% over 2026-2031.
This report is Segmented by Mode of Transport (Roadways, Railways, and More), Component (Hardware, Software, and More), Type (ATMS, ATIS, and More), Application (Traffic Management, and More), Deployment Mode (On-Premise, Cloud, and More), Technology (IoT Sensors and V2X, AI and Machine-Learning Analytics, and More), and Geography. The Market Forecasts are Provided in Terms of Value (USD).
Global Intelligent Transport Systems Market Trends and Insights
Government Smart-City and Traffic-Safety Funding Surge
Federal and supranational programmes are directing unprecedented sums into connected-corridor build-outs. The U.S. Department of Transportation awarded USD 54 million in SMART grants during 2024 alone, aiming to shift agencies from reactive timing plans to predictive, AI-assisted flow control. In parallel, the EU's Digital Europe Programme has earmarked EUR 7.5 billion through 2027 for digital infrastructure, with intelligent transportation systems tagged as a centerpiece because they cut emissions while lifting competitiveness. State-level executions such as Arizona's USD 19.6 million V2X corridor prove how quickly funds translate into assets that produce monetisable data. Contract award cycles that once stretched five years now close inside two, rewarding vendors that package turnkey analytics with shovel-ready hardware. Early adopters gain durable first-mover advantages by harvesting data streams before peer regions possess equivalent sensor density.
Escalating Urban Congestion Demanding ATMS Roll-outs
Daily gridlock has turned advanced traffic management systems from nice-to-have to fiscal necessity. An audit in Anne Arundel County, Maryland found a single busy junction costs users USD 324,000 in lost time and USD 48,000 in excess fuel each year, catalysing rapid ATMS procurement. Beijing's vehicle-road-cloud program has shaved 15% off average trip times across 1,200 intersections, compelling rival megacities to follow suit. Boston's AI-enabled signal adjustments removed 30% of stops at major downtown nodes, showing that legacy controllers can be repurposed via software rather than rebuilt in concrete. Escalating steel and asphalt prices, highway construction costs rose 24% in 2024-leave software optimisation as the only viable congestion remedy for budget-constrained agencies.
High Capex and Legacy Infrastructure Retrofit Costs
Annual highway construction cost inflation reached 24% in 2024, eroding the real value of earmarked budgets and pushing agencies to defer non-critical upgrades. Steel prices rose 11.2%, dampening the purchasing power of the Bipartisan Infrastructure Law by roughly 40%, according to the American Iron and Steel Institute. Large-scale retrofits like Copenhagen's EUR 80 million smart-lighting project still demand multi-year paybacks that municipal bond markets struggle to underwrite. Consequently, many agencies pivot to incremental, software-first deployments that extend the life of analogue cabinets instead of wholesale controller swaps. Integration fees often eclipse device prices, forcing procurement offices to spread modernisation across several fiscal cycles and delaying system-wide performance gains.
Other drivers and restraints analyzed in the detailed report include:
- Mandatory Road-Safety Regulations (e-Call, ADAS Integration)
- Edge-Native AI Digital Twins Enabling Real-Time Flow Optimisation
- Rising Cybersecurity-Liability Compliance Costs
For complete list of drivers and restraints, kindly check the Table Of Contents.
Segment Analysis
The maritime segment captured just 6.35% of Intelligent Transportation Systems market revenue in 2025 but posts the fastest 12.86% CAGR as ports deploy automation, digital twins, and autonomous tugs. Roadways retained 61.45% share, equivalent to the largest slice of the Intelligent Transportation Systems market size, supported by national safety programmes. Investments in quay cranes fitted with AI vision and 5G links improve berth throughput and synchronise with trucking fleets, cutting container dwell time by 20%. EHang's EH216 S autonomous air-taxi rollout illustrates how airways leapfrog ground bottlenecks, although the sub-sector remains nascent. Railways benefit from right-of-way control; U.S. freight operators reduced locomotive failures 40% via edge analytics that flag defects hours before breakdowns.
Looking ahead, cross-modal orchestration aligns sailing schedules with rail slots and truck dispatch, raising asset utilisation system-wide. The Intelligent Transportation Systems market increasingly rewards solutions that model maritime, rail, and road flows in a single data fabric. China's port cloud platforms already integrate yard cranes, gate cameras, and customs databases, foreshadowing global adoption. Roadway projects now pilot C-V2X intersections that broadcast signal timing to heavy-duty trucks, reducing idle fuel. Collectively, these trends shift funding toward software layers that balance freight among modes, lessening peak-hour congestion and emissions.
Hardware still represented 48.55% revenue in 2025, yet software's 13.84% CAGR signals a profound pivot. Agencies value flexible licensing that keeps pace with evolving safety standards, pushing perpetual-license controllers aside. Services, consulting, integration, and managed cybersecurity, expand fastest inside the software bundle, reflecting a need for continuous optimisation rather than periodic box swaps. The Intelligent Transportation Systems market share for hardware will erode as IoT nodes commoditise; roadside units become simple data collectors feeding AI pipelines.
Vendors now bundle analytics dashboards with firmware updates, converting one-time transactions into annuities. Edge containers allow over-the-air deployment of new algorithms that lengthen hardware life and lower total cost of ownership, a key selling point amid budget squeezes. As modular gateways replace monolithic cabinets, procurement shifts from capital outlay to operating-expenditure models akin to SaaS. The outcome is a virtuous cycle: recurring revenue funds R&D that in turn raises system performance, deepening customer dependence on the platform.
Geography Analysis
North America contributed 27.65% of Intelligent Transportation Systems market revenue in 2025. Federal grants, such as the USD 62 billion connected-vehicle earmark for fiscal 2025, stabilise pipeline visibility and spark state-level copycat projects. Arizona's USD 19.6 million V2X corridor demonstrates replicable ROI, while Texas DOT's C-V2X intersection trials position the region as a leader in infrastructure-vehicle fusion. Municipal pilots also layer social goals: Albuquerque's micro-transit service links food deserts to grocers, showing how data-rich systems tackle equity gaps. Clear liability frameworks and deep venture capital pools pull edge-AI startups into public-sector tenders, accelerating rollouts versus regions with opaque rules.
Asia Pacific is the fastest-growing region at a 10.16% CAGR through 2031. Megacity congestion and state backing for digital economy goals push aggressive deployment timetables. China's EHang EH216 S autonomous flying-taxi fleet, cleared for passenger service, underscores regulatory agility in advanced air mobility. Beijing's 1,200-intersection vehicle-road-cloud scheme trimmed travel time 15% and now anchors national standards. Singapore's SGD 1 billion AI reserve and China's 20 million NEV target by 2025 give suppliers predictable demand curves. Robotaxi partnerships scaling beyond pilot fleets, Pony AI's 1,000-vehicle pact in Shenzhen, validate commercialisation pathways and pump data volumes that feed analytics engines.
Europe sustains steady expansion under harmonised safety and climate legislation. The General Safety Regulation II mandates ADAS equipment, compelling roadsides to exchange data with next-generation fleets. Copenhagen's EUR 80 million smart-lighting retrofit achieved 55% energy savings, revealing how ITS budgets align with carbon targets. EU Digital Europe funds of EUR 7.5 billion through 2027 ensure capital availability for digital twin pilots and cross-border corridors. Siemens Mobility's multibillion Euro Deutsche Bahn contract exemplifies turnkey platform purchasing over piecemeal upgrades, while stringent GDPR and AI-transparency rules moderate adoption speed yet raise public trust, fostering durable market adoption.
- Siemens AG
- Thales Group
- IBM Corporation
- Garmin Ltd.
- NoTraffic
- TomTom N.V.
- Cubic Corporation
- Mobileye
- Applied Information
- Denso Corporation
- Cisco Systems Inc.
- Kapsch TrafficCom AG
- Huawei Technologies Co. Ltd.
- Iteris Inc.
- Q-Free ASA
- Swarco AG
- TransCore LP
- Advantech Co. Ltd.
- Continental AG
- Siemens Mobility (Yunex Traffic)
- AtkinsRealis
- Econolite Group Inc.
Additional Benefits:
- The market estimate (ME) sheet in Excel format
- 3 months of analyst support
TABLE OF CONTENTS
1 INTRODUCTION
- 1.1 Study Assumptions and Market Definition
- 1.2 Scope of the Study
2 RESEARCH METHODOLOGY
3 EXECUTIVE SUMMARY
4 MARKET LANDSCAPE
- 4.1 Market Overview
- 4.2 Market Drivers
- 4.2.1 Government smart-city and traffic-safety funding surge
- 4.2.2 Escalating urban congestion demanding ATMS roll-outs
- 4.2.3 Mandatory road-safety regulations (e-Call, ADAS integration)
- 4.2.4 Edge-native AI digital twins enabling real-time flow optimisation
- 4.2.5 Integration of EV-charging assets with ITS platforms
- 4.2.6 Data-monetisation models from connected-vehicle analytics
- 4.3 Market Restraints
- 4.3.1 High capex and legacy infrastructure retrofit costs
- 4.3.2 Interoperability and standards fragmentation across regions
- 4.3.3 Rising cybersecurity-liability compliance costs
- 4.3.4 AI-algorithm transparency rules slowing advanced deployments
- 4.4 Industry Value Chain Analysis
- 4.5 Regulatory Landscape
- 4.6 Technological Outlook
- 4.7 Porter's Five Forces Analysis
- 4.7.1 Threat of New Entrants
- 4.7.2 Bargaining Power of Buyers
- 4.7.3 Bargaining Power of Suppliers
- 4.7.4 Threat of Substitutes
- 4.7.5 Intensity of Rivalry
- 4.8 Investment Analysis
5 MARKET SIZE AND GROWTH FORECASTS (VALUE)
- 5.1 By Mode of Transport
- 5.1.1 Roadways
- 5.1.2 Railways
- 5.1.3 Airways
- 5.1.4 Maritime
- 5.2 By Component
- 5.2.1 Hardware
- 5.2.2 Software
- 5.2.3 Services
- 5.3 By Type
- 5.3.1 Advanced Traffic Management Systems (ATMS)
- 5.3.2 Advanced Traveler Information Systems (ATIS)
- 5.3.3 Advanced Transportation Pricing Systems (ATPS)
- 5.3.4 Advanced Public Transportation Systems (APTS)
- 5.3.5 Advanced Commercial Vehicle Operations (ACVOS)
- 5.3.6 Cooperative Vehicle-Infrastructure Systems (CVIS)
- 5.4 By Application
- 5.4.1 Traffic Management
- 5.4.2 Public Transport and Ticketing
- 5.4.3 Road Safety and Security
- 5.4.4 Freight and Fleet Management
- 5.4.5 Environmental and Emission Monitoring
- 5.4.6 Smart Parking and Guidance
- 5.4.7 Tolling and Congestion Pricing
- 5.4.8 Connected and Autonomous Vehicle (CAV) Support
- 5.4.9 Other Applications
- 5.5 By Deployment Mode
- 5.5.1 On-Premise
- 5.5.2 Cloud
- 5.5.3 Edge / Fog
- 5.6 By Technology
- 5.6.1 IoT Sensors and V2X
- 5.6.2 AI and Machine-Learning Analytics
- 5.6.3 Digital Twin Platforms
- 5.6.4 5G and C-V2X Connectivity
- 5.7 By Geography
- 5.7.1 North America
- 5.7.1.1 United States
- 5.7.1.2 Canada
- 5.7.1.3 Mexico
- 5.7.2 South America
- 5.7.2.1 Brazil
- 5.7.2.2 Argentina
- 5.7.2.3 Rest of South America
- 5.7.3 Europe
- 5.7.3.1 Germany
- 5.7.3.2 United Kingdom
- 5.7.3.3 France
- 5.7.3.4 Italy
- 5.7.3.5 Spain
- 5.7.3.6 Rest of Europe
- 5.7.4 Asia-Pacific
- 5.7.4.1 China
- 5.7.4.2 Japan
- 5.7.4.3 South Korea
- 5.7.4.4 India
- 5.7.4.5 Rest of Asia-Pacific
- 5.7.5 Middle East
- 5.7.5.1 Saudi Arabia
- 5.7.5.2 United Arab Emirates
- 5.7.5.3 Turkey
- 5.7.5.4 Rest of Middle East
- 5.7.6 Africa
- 5.7.6.1 South Africa
- 5.7.6.2 Nigeria
- 5.7.6.3 Egypt
- 5.7.6.4 Rest of Africa
- 5.7.1 North America
6 COMPETITIVE LANDSCAPE
- 6.1 Market Concentration
- 6.2 Strategic Moves
- 6.3 Market Share Analysis
- 6.4 Company Profiles (includes Global level Overview, Market level overview, Core Segments, Financials as available, Strategic Information, Market Rank/Share for key companies, Products and Services, and Recent Developments)
- 6.4.1 Siemens AG
- 6.4.2 Thales Group
- 6.4.3 IBM Corporation
- 6.4.4 Garmin Ltd.
- 6.4.5 NoTraffic
- 6.4.6 TomTom N.V.
- 6.4.7 Cubic Corporation
- 6.4.8 Mobileye
- 6.4.9 Applied Information
- 6.4.10 Denso Corporation
- 6.4.11 Cisco Systems Inc.
- 6.4.12 Kapsch TrafficCom AG
- 6.4.13 Huawei Technologies Co. Ltd.
- 6.4.14 Iteris Inc.
- 6.4.15 Q-Free ASA
- 6.4.16 Swarco AG
- 6.4.17 TransCore LP
- 6.4.18 Advantech Co. Ltd.
- 6.4.19 Continental AG
- 6.4.20 Siemens Mobility (Yunex Traffic)
- 6.4.21 AtkinsRealis
- 6.4.22 Econolite Group Inc.
7 MARKET OPPORTUNITIES AND FUTURE OUTLOOK
- 7.1 White-space and Unmet-need Assessment
 智慧型運輸系統(ITS)市場規模、佔有率和趨勢分析報告:按產品、系統、應用、地區和細分市場分類的預測(2026-2033 年)
 智慧型運輸系統市場報告:按運輸方式、產品、協議、交付方式、應用和地區分類(2026-2034 年)
 智慧型運輸系統(ITS)市場機會、成長要素、產業趨勢分析及2026-2035年預測
 2034年自動駕駛公共運輸市場預測:按車輛類型、組件、動力系統、應用和區域分類的全球分析
 2026-2030年全球公共運輸市場
 智慧交通系統可變顯示器市場 - 全球產業規模、佔有率、趨勢、機會及預測(按組件、技術、應用、地區和競爭格局分類),2021-2031年
 智慧交通解決方案市場按組件、解決方案、部署類型、應用和最終用戶分類 - 全球預測 2026-2032日本智慧交通系統市場報告:按產品、通訊協定、運輸方式、應用和地區分類(2026-2034年)
 公共運輸市場規模、佔有率和成長分析(按推進類型、模式、出行方式、通路管道、應用、最終用戶和地區分類)-2026-2033年產業預測全球智慧公共交通市場:預測(至2032年)-依交通途徑、解決方案類型、部署方式、技術、最終使用者和地區進行分析