


 |
市場調查報告書
商品編碼
2038728
智慧型運輸系統(ITS)市場機會、成長要素、產業趨勢分析及2026-2035年預測Intelligent Transportation System (ITS) Market Opportunity, Growth Drivers, Industry Trend Analysis, and Forecast 2026 - 2035 |
||||||
2025年全球智慧型運輸系統(ITS)市值為504億美元,預計2035年將以10.7%的複合年成長率成長至1353億美元。
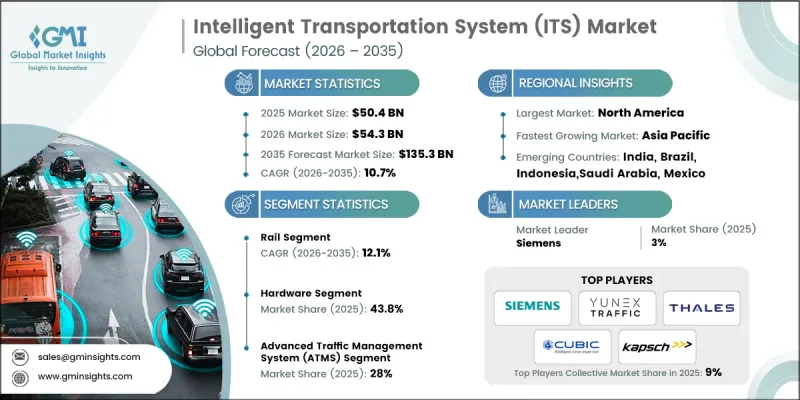
在都市區,隨著更智慧的出行解決方案和數位基礎設施升級成為優先事項,智慧型運輸系統(ITS) 市場正呈現強勁成長動能。透過公私合作資金籌措模式擴大財政支持,正在加速大規模部署,同時降低實施風險。對無縫、非接觸式旅遊體驗日益成長的需求,推動了數位票價系統和彈性支付解決方案的普及。世界各國政府正積極實施法律規範,透過先進的交通技術提高交通效率、緩解擁擠並增強道路安全。對交通網路現代化改造的投資,以及智慧監控和通訊系統的整合,進一步促進了ITS的普及。人工智慧的興起,透過預測分析和即時最佳化,正在變革交通管理,使城市能夠更有效地管理擁塞。此外,不斷發展的收費框架正轉向動態定價模式,旨在調節交通流量並提高產生收入。所有這些趨勢共同推動智慧型運輸系統(ITS) 市場走上永續長期成長的道路。
| 市場範圍 | |
|---|---|
| 開始年份 | 2025 |
| 預測期 | 2026-2035 |
| 上市時的市場規模 | 504億美元 |
| 預計金額 | 1353億美元 |
| 複合年成長率 | 10.7% |
預計到2025年,鐵路運輸將佔全球運輸總量的41%,並將在2035年之前以12.1%的複合年成長率成長。隨著全球電氣化進程和鐵路網擴張的推進,鐵路運輸市場將持續成長。對鐵路基礎設施的持續投資有助於提高效率和運輸能力。先進監控系統和預測性維護技術的應用,能夠提升資產利用率和營運績效,進而提高系統整體可靠性。
預計到2025年,硬體領域將佔據43.8%的市場佔有率,並在2026年至2035年間以10.5%的複合年成長率成長。該領域的成長主要得益於高效能運算元件、節能處理器和連網型設備的日益普及。邊緣運算和感測器整合技術的進步正在提升即時數據處理能力,而數位基礎設施的擴展則為擴充性且高效的交通網路提供了支援。
美國智慧型運輸系統(ITS)市場預計到2025年將達到161億美元。隨著城市採用利用人工智慧(AI)和數據分析的先進交通管理解決方案,該市場正在不斷擴張。市政當局為提高出行效率和緩解交通堵塞而採取的措施正在推動ITS的普及。在先進通訊技術支援下,互聯交通生態系統的發展正在加強車輛、基礎設施和城市系統之間的協調。
目錄
第1章:調查方法
第2章執行摘要
第3章業界考察
- 生態系分析
- 供應商情況
- 利潤率
- 成本結構
- 每個階段增加的價值
- 影響價值鏈的因素
- 中斷
- 影響產業的因素
- 促進因素
- 政府資金和公私合作模式
- 歐洲和北美通勤者對計量型票務服務的需求
- 北美和亞太地區政府加強對有效交通管理的支持。
- 加大對歐洲鐵路基礎設施的投資
- 產業潛在風險與挑戰
- 與舊有系統整合的複雜性
- 海事設備高成本
- 市場機遇
- 智慧城市的擴張
- 人工智慧和預測分析的整合
- 聯網汽車與自動駕駛汽車生態系統
- 官民合作關係(PPP)和基礎建設資金籌措
- 促進因素
- 成長潛力分析
- 科技與創新趨勢
- 當前技術趨勢
- 新興技術
- 價格分析(基於初步調查)
- 對過去價格趨勢的分析
- 按業務類型分類的定價策略(溢價/價值/成本加成)
- 監理情勢
- 北美洲
- 美國聯邦通訊委員會(FCC)
- 加拿大創新、科學與經濟發展部 (ISED)
- 歐洲
- 歐盟委員會通訊網路、通訊與網路總司
- 歐洲電子監理局(BEREC)
- 亞太地區
- 中國工業和資訊化部
- 印度電訊監理局(TRAI)
- 拉丁美洲
- 巴西國家電訊管理局(ANATEL)
- 墨西哥聯邦電訊(IFT)
- 中東和非洲
- 沙烏地阿拉伯通訊與資訊科技委員會(CITC)
- 南非獨立通訊機構(ICASA)
- 北美洲
- 波特五力分析
- PESTEL 分析
- 成本細分分析
- 專利分析(基於初步研究)
- 交易數據分析(基於付費資料庫)
- 進出口量和進出口額的趨勢
- 主要貿易走廊及關稅的影響
- 人工智慧和生成式人工智慧對市場的影響
- 利用人工智慧改造現有經營模式
- 按細分市場分類的生成式人工智慧用例和部署藍圖
- 風險、限制和監管考量
- 永續性和環境方面
- 永續計劃
- 減少廢棄物策略
- 生產中的能源效率
- 具有環保意識的舉措
- 碳足跡考量
- 預測假設和情境分析(基於初步研究)
- 基本案例-驅動複合年成長率的關鍵宏觀經濟與產業變量
- 樂觀情境-宏觀經濟與產業的順風
- 悲觀情景-宏觀經濟放緩或產業逆風
第4章 競爭情勢
- 介紹
- 企業市佔率分析
- 北美洲
- 歐洲
- 亞太地區
- 拉丁美洲
- 中東和非洲(MEA)
- 主要市場公司的競爭分析
- 競爭定位矩陣
- 主要進展
- 併購
- 夥伴關係與合作
- 新產品發布
- 業務拓展計劃及資金籌措
第5章 市場估計與預測:依運輸方式分類,2022-2035年
- 鐵路
- 路
- 航空
- 海
第6章 市場估計與預測:依組件分類,2022-2035年
- 硬體
- 通訊網路
- 介面板
- 感應器
- 監測和檢測系統
- 監視錄影機
- 其他
- 軟體
- 視覺化軟體
- 影像偵測管理軟體
- 交通管理系統
- 流量分析與人工智慧平台
- 其他
- 服務
- 專業服務
- 託管服務
第7章 市場估計與預測:依系統分類,2022-2035年
- 智慧型運輸管理系統(ATMS)
- 高級旅行資訊系統(ATIS)
- 智慧型運輸收費系統(ATPS)
- 先進公共運輸系統(APTS)
- 先進農村交通系統(ARTS)
- 商用車輛營運(CVO)
第8章 市場估計與預測:依應用領域分類,2022-2035年
- 交通管理
- 車輛管理和資產監控
- 智慧票
- 公共交通和乘客訊息
- 道路安全保障
- 智慧停車和引導
- 通行費/壅塞費
- 環境與排放氣體監測
- 連網自動駕駛汽車 (CAV) 輔助
- 其他
第9章 市場估計與預測:依地區分類,2022-2035年
- 北美洲
- 美國
- 加拿大
- 歐洲
- 德國
- 英國
- 法國
- 義大利
- 西班牙
- 北歐國家
- 俄羅斯
- 波蘭
- 羅馬尼亞
- 亞太地區
- 中國
- 印度
- 日本
- 韓國
- ANZ
- 越南
- 印尼
- 菲律賓
- 拉丁美洲
- 巴西
- 墨西哥
- 阿根廷
- 中東和非洲(MEA)
- 南非
- 沙烏地阿拉伯
- 阿拉伯聯合大公國
第10章:公司簡介
- 世界公司
- Cisco Systems
- Conduent
- Cubic Transportation Systems
- Hitachi
- IBM
- Indra Sistemas
- Kapsch TrafficCom
- NEC Corporation
- Siemens Mobility
- Thales
- 當地公司
- Econolite
- Iteris
- Q-Free ASA
- Sumitomo Electric Industries
- SWARCO
- TomTom
- TransCore
- Yunex Traffic
- 新興企業
- Applied Information
- Jenoptik Mobility Solutions
- Miovision
- Rekor Systems
The Global Intelligent Transportation System Market was valued at USD 50.4 billion in 2025 and is estimated to grow at a CAGR of 10.7% to reach USD 135.3 billion by 2035.
The intelligent transportation system market is witnessing strong momentum as urban areas prioritize smarter mobility solutions and digital infrastructure upgrades. Increasing financial support through collaborative funding models between public and private entities is accelerating large-scale deployment while reducing implementation risks. Rising demand for seamless and contactless travel experiences is encouraging the adoption of digital fare systems and flexible payment solutions. Governments are actively introducing regulatory frameworks to enhance traffic efficiency, reduce congestion, and improve road safety through advanced transportation technologies. Investments in modernizing transportation networks are further driving adoption, supported by the integration of intelligent monitoring and communication systems. The emergence of artificial intelligence is transforming traffic management through predictive analytics and real-time optimization, enabling cities to manage congestion more effectively. Additionally, evolving tolling frameworks are shifting toward dynamic pricing models designed to regulate traffic flow and enhance revenue generation. These developments collectively position the intelligent transportation system market for sustained long-term growth.
| Market Scope | |
|---|---|
| Start Year | 2025 |
| Forecast Year | 2026-2035 |
| Start Value | $50.4 Billion |
| Forecast Value | $135.3 Billion |
| CAGR | 10.7% |
The rail segment accounted for 41% share in 2025 and is expected to grow at a CAGR of 12.1% through 2035. The segment continues to expand as electrification initiatives and network enhancements gain traction globally. Ongoing investments in rail infrastructure are supporting efficiency improvements and capacity expansion. The adoption of advanced monitoring systems and predictive maintenance technologies is enabling better asset utilization and operational performance, contributing to overall system reliability.
The hardware segment held a share of 43.8% in 2025 and is anticipated to grow at a CAGR of 10.5% from 2026 to 2035. Growth in this segment is driven by increasing deployment of high-performance computing components, energy-efficient processors, and connected devices. Advancements in edge computing and sensor integration are strengthening real-time data processing capabilities, while expanding digital infrastructure is supporting scalable and efficient transportation networks.
U.S. Intelligent Transportation System Market reached USD 16.1 billion in 2025. The market is expanding as cities implement advanced traffic management solutions powered by artificial intelligence and data analytics. Municipal initiatives focused on improving mobility efficiency and reducing congestion are driving adoption. The development of connected transportation ecosystems, supported by enhanced communication technologies, is enabling better coordination between vehicles, infrastructure, and urban systems.
Key companies operating in the Global Intelligent Transportation System Market include Kapsch TrafficCom, Siemens Mobility, Conduent, Cubic Transportation Systems, Indra Sistemas, Iteris, SWARCO, Thales, TomTom, and Yunex Traffic. Companies in the intelligent transportation system market are focusing on innovation, partnerships, and digital transformation to strengthen their market position. Investments in artificial intelligence, data analytics, and cloud-based platforms are enabling more advanced and scalable solutions. Strategic collaborations with government agencies and infrastructure developers are helping companies secure long-term projects and expand their global footprint. Firms are also prioritizing the development of integrated mobility platforms that enhance user experience and operational efficiency. Continuous advancements in hardware and software capabilities, along with the adoption of smart city initiatives, are supporting product differentiation.
Table of Contents
Chapter 1 Methodology
- 1.1 Research approach
- 1.2 Quality commitments
- 1.3 GMI AI policy & data integrity commitment
- 1.4 Research trail & confidence scoring
- 1.4.1 Research trail components
- 1.4.2 Scoring components
- 1.5 Data collection
- 1.5.1 Partial list of primary sources
- 1.6 Data mining sources
- 1.6.1 Paid sources
- 1.7 Base estimates and calculations
- 1.7.1 Base year calculation
- 1.8 Forecast model
- 1.9 Research transparency addendum
Chapter 2 Executive Summary
- 2.1 Industry 360° synopsis
- 2.2 Key market trends
- 2.2.1 Regional
- 2.2.2 Mode of transport
- 2.2.3 Component
- 2.2.4 System
- 2.2.5 Application
- 2.3 TAM analysis, 2026-2035
- 2.4 CXO perspectives: Strategic imperatives
Chapter 3 Industry Insights
- 3.1 Industry ecosystem analysis
- 3.1.1 Supplier landscape
- 3.1.2 Profit margin
- 3.1.3 Cost structure
- 3.1.4 Value addition at each stage
- 3.1.5 Factor affecting the value chain
- 3.1.6 Disruptions
- 3.2 Industry impact forces
- 3.2.1 Growth drivers
- 3.2.1.1 Government funding and PPP models
- 3.2.1.2 Demand for Pay-as-you-go ticketing service among commuters in Europe and North America
- 3.2.1.3 Rise in favorable government initiatives for effective traffic management in North America and Asia Pacific
- 3.2.1.4 Growing investment in railway infrastructure in Europe
- 3.2.2 Industry pitfalls and challenges
- 3.2.2.1 Integration complexities with legacy systems
- 3.2.2.2 High cost of maritime equipment
- 3.2.3 Market opportunities
- 3.2.3.1 Smart city expansion
- 3.2.3.2 Ai & predictive analytics integration
- 3.2.3.3 Connected & autonomous vehicle ecosystem
- 3.2.3.4 Public-private partnerships (PPP) & infrastructure funding
- 3.2.1 Growth drivers
- 3.3 Growth potential analysis
- 3.4 Technology and innovation landscape
- 3.4.1 Current technological trends
- 3.4.2 Emerging technologies
- 3.5 Pricing analysis (Driven by Primary Research)
- 3.5.1 Historical price trend analysis
- 3.5.2 Pricing strategy by player type (premium / value / cost-plus)
- 3.6 Regulatory landscape
- 3.6.1 North America
- 3.6.1.1 Federal Communications Commission (FCC)
- 3.6.1.2 Innovation, Science and Economic Development Canada (ISED)
- 3.6.2 Europe
- 3.6.2.1 European Commission - DG CONNECT
- 3.6.2.2 Body of European Regulators for Electronic Communications (BEREC)
- 3.6.3 Asia Pacific
- 3.6.3.1 Ministry of Industry and Information Technology (MIIT), China
- 3.6.3.2 Telecom Regulatory Authority of India (TRAI)
- 3.6.4 Latin America
- 3.6.4.1 Agencia Nacional de Telecomunicacoes (ANATEL), Brazil
- 3.6.4.2 Instituto Federal de Telecomunicaciones (IFT), Mexico
- 3.6.5 Middle East & Africa
- 3.6.5.1 Communications and Information Technology Commission (CITC), Saudi Arabia
- 3.6.5.2 Independent Communications Authority of South Africa (ICASA)
- 3.6.1 North America
- 3.7 Porter's analysis
- 3.8 PESTEL analysis
- 3.9 Cost breakdown analysis
- 3.10 Patent analysis (Driven by Primary Research)
- 3.11 Trade data analysis (Driven by paid database)
- 3.11.1 Import/export volume & value trends
- 3.11.2 Key trade corridors & tariff impact
- 3.12 Impact of AI & Generative AI on the Market
- 3.12.1 AI-driven disruption of existing business models
- 3.12.2 Gen AI use cases & adoption roadmap by segment
- 3.12.3 Risks, limitations & regulatory considerations
- 3.13 Sustainability and environmental aspects
- 3.13.1 Sustainable practices
- 3.13.2 Waste reduction strategies
- 3.13.3 Energy efficiency in production
- 3.13.4 Eco-friendly initiatives
- 3.13.5 Carbon footprint considerations
- 3.14 Forecast assumptions & scenario analysis (Driven by primary research)
- 3.14.1 Base Case - key macro & industry variables driving CAGR
- 3.14.2 Optimistic Scenarios - Favorable macro and industry tailwinds
- 3.14.3 Pessimistic Scenario - Macroeconomic slowdown or industry headwinds
Chapter 4 Competitive Landscape, 2025
- 4.1 Introduction
- 4.2 Company market share analysis
- 4.2.1 North America
- 4.2.2 Europe
- 4.2.3 Asia Pacific
- 4.2.4 LATAM
- 4.2.5 MEA
- 4.3 Competitive analysis of major market players
- 4.4 Competitive positioning matrix
- 4.5 Key developments
- 4.5.1 Mergers & acquisitions
- 4.5.2 Partnerships & collaborations
- 4.5.3 New product launches
- 4.5.4 Expansion plans and funding
Chapter 5 Market Estimates & Forecast, By Mode of Transport, 2022 - 2035 ($Mn)
- 5.1 Key trends
- 5.2 Rail
- 5.3 Road
- 5.4 Air
- 5.5 Marine
Chapter 6 Market Estimates & Forecast, By Component, 2022 - 2035 ($Mn)
- 6.1 Key trends
- 6.2 Hardware
- 6.2.1 Telecommunication networks
- 6.2.2 Interface boards
- 6.2.3 Sensors
- 6.2.4 Monitoring & detection systems
- 6.2.5 Surveillance cameras
- 6.2.6 Others
- 6.3 Software
- 6.3.1 Visualization software
- 6.3.2 Video detection management software
- 6.3.3 Transit management system
- 6.3.4 Traffic analytics & AI platforms
- 6.3.5 Others
- 6.4 Services
- 6.4.1 Professional services
- 6.4.2 Managed services
Chapter 7 Market Estimates & Forecast, By System, 2022 - 2035 ($Mn)
- 7.1 Key trends
- 7.2 Advanced Traffic Management System (ATMS)
- 7.3 Advanced Traveler Information System (ATIS)
- 7.4 Advanced Transportation Pricing System (ATPS)
- 7.5 Advanced Public Transport System (APTS)
- 7.6 Advanced Rural Transportation System (ARTS)
- 7.7 Commercial Vehicle Operation (CVO)
Chapter 8 Market Estimates & Forecast, By Application, 2022 - 2035 ($Mn)
- 8.1 Key trends
- 8.2 Traffic management
- 8.3 Fleet management & asset monitoring
- 8.4 Smart ticketing
- 8.5 Public transport & passenger information
- 8.6 Road safety & security
- 8.7 Smart parking & guidance
- 8.8 Tolling & congestion pricing
- 8.9 Environmental & emission monitoring
- 8.10 Connected & autonomous vehicle (CAV) support
- 8.11 Others
Chapter 9 Market Estimates & Forecast, By Region, 2022 - 2035 ($Mn)
- 9.1 Key trends
- 9.2 North America
- 9.2.1 U.S.
- 9.2.2 Canada
- 9.3 Europe
- 9.3.1 Germany
- 9.3.2 UK
- 9.3.3 France
- 9.3.4 Italy
- 9.3.5 Spain
- 9.3.6 Nordics
- 9.3.7 Russia
- 9.3.8 Poland
- 9.3.9 Romania
- 9.4 Asia Pacific
- 9.4.1 China
- 9.4.2 India
- 9.4.3 Japan
- 9.4.4 South Korea
- 9.4.5 ANZ
- 9.4.6 Vietnam
- 9.4.7 Indonesia
- 9.4.8 Philippines
- 9.5 Latin America
- 9.5.1 Brazil
- 9.5.2 Mexico
- 9.5.3 Argentina
- 9.6 MEA
- 9.6.1 South Africa
- 9.6.2 Saudi Arabia
- 9.6.3 UAE
Chapter 10 Company Profiles
- 10.1 Global players
- 10.1.1 Cisco Systems
- 10.1.2 Conduent
- 10.1.3 Cubic Transportation Systems
- 10.1.4 Hitachi
- 10.1.5 IBM
- 10.1.6 Indra Sistemas
- 10.1.7 Kapsch TrafficCom
- 10.1.8 NEC Corporation
- 10.1.9 Siemens Mobility
- 10.1.10 Thales
- 10.2 Regional players
- 10.2.1 Econolite
- 10.2.2 Iteris
- 10.2.3 Q-Free ASA
- 10.2.4 Sumitomo Electric Industries
- 10.2.5 SWARCO
- 10.2.6 TomTom
- 10.2.7 TransCore
- 10.2.8 Yunex Traffic
- 10.3 Emerging players
- 10.3.1 Applied Information
- 10.3.2 Jenoptik Mobility Solutions
- 10.3.3 Miovision
- 10.3.4 Rekor Systems
 智慧交通系統:市場佔有率分析、產業趨勢與統計、成長預測(2026-2031)
 智慧型運輸系統(ITS)市場規模、佔有率和趨勢分析報告:按產品、系統、應用、地區和細分市場分類的預測(2026-2033 年)
 智慧型運輸系統市場報告:按運輸方式、產品、協議、交付方式、應用和地區分類(2026-2034 年)
 2034年自動駕駛公共運輸市場預測:按車輛類型、組件、動力系統、應用和區域分類的全球分析
 2026-2030年全球公共運輸市場
 智慧交通系統可變顯示器市場 - 全球產業規模、佔有率、趨勢、機會及預測(按組件、技術、應用、地區和競爭格局分類),2021-2031年
 智慧交通解決方案市場按組件、解決方案、部署類型、應用和最終用戶分類 - 全球預測 2026-2032日本智慧交通系統市場報告:按產品、通訊協定、運輸方式、應用和地區分類(2026-2034年)
 公共運輸市場規模、佔有率和成長分析(按推進類型、模式、出行方式、通路管道、應用、最終用戶和地區分類)-2026-2033年產業預測全球智慧公共交通市場:預測(至2032年)-依交通途徑、解決方案類型、部署方式、技術、最終使用者和地區進行分析