


 |
市場調查報告書
商品編碼
2044245
五氧化二鈮:市場佔有率分析、產業趨勢與統計、成長預測(2025-2031)Niobium Pentoxide - Market Share Analysis, Industry Trends & Statistics, Growth Forecasts (2025 - 2031) |
||||||

※ 本網頁內容可能與最新版本有所差異。詳細情況請與我們聯繫。
預計五氧化二鈮市場將從 2025 年的 7.73 千噸和 2026 年的 8.51 千噸成長到 2031 年的 13.76 千噸,2026 年至 2031 年的年複合成長率(CAGR)為 10.09%。
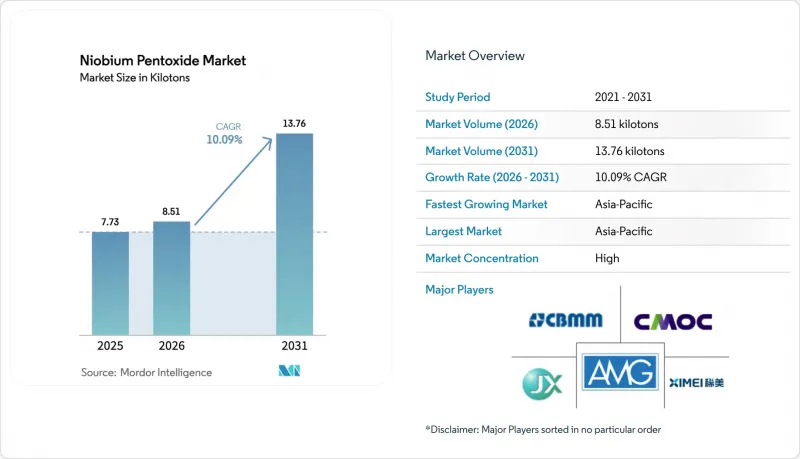
亞洲強勁的基礎設施投資、北美航太機隊的穩定更新以及用於超快充電的電池化學品的快速普及,共同支撐著兩位數的需求成長。高抗張強度鋼的大宗消費持續支撐著市場需求,而光學玻璃、積層製造粉末以及用於5G的高頻濺射材料等利基應用領域的快速擴張,正在提升整體價值結構。自2024年以來,巴西以外的供應鏈多元化進程不斷加速,但CBMM(巴西銅礦公司)龐大的礦石蘊藏量仍是價格形成的基礎。因此,具有前瞻性的採購團隊正在簽訂長期承購協議,並投資於閉合迴路回收利用,以對沖價格波動風險。
全球五氧化二鈮市場趨勢及洞察
對高屈光光學玻璃的需求不斷成長
為滿足智慧型手機和擴增實境(AR)鏡頭的需求,日本玻璃製造商在2024年擴大了摻鈮五氧化二氮(Nb2O5)空白玻璃的產量,無需添加鉛即可實現1.9或更高的屈光。非球面相機鏡頭中鈮五氧化二氮的含量目前高達20%(重量比),這使得高階智慧型手機的模組更薄,頭戴式顯示器的光學元件更輕。汽車製造商也在固體雷射雷達(LiDAR)的波導管中使用摻鈮二氧化矽,以減少散射損耗。儘管光學應用領域的消費量僅佔全球總產量的不到2%,但其高利潤率支撐著4N精煉產量的成長。因此,生產商正在調整高附加價值玻璃和散裝鋼材的供應路線,以最大限度地提高資產利用率。
高強度鋼和高溫合金的應用日益廣泛。
管道建造者依靠添加0.02%至0.05%的鈮來滿足API 5L X80標準,而無需進行焊後熱處理。這項優勢正在加速北極和深海工程的建設。在中國,2024年至2025年間,每年將鋪設約8,000公里的輸油管,即使鋼筋需求成長放緩,對鈮鐵的需求依然強勁。在航空航太領域,含鈮高溫合金(例如Inconel 718)的抗蠕變性能超過650°C,這是2024年認證的齒輪傳動渦扇盤的強制要求。來自基礎設施和航太領域的雙重需求,正在鞏固氧化物大規模消費的長期基礎。
接觸Nb2O5粉塵可能引發健康與安全問題。
美國職業安全與健康管理局 (OSHA) 將可吸入鈮化合物粉塵的濃度限制在 5 mg/m³,迫使煉油廠安裝封閉式處理設施和即時監測設備。歐洲的 REACH 法規要求下游製程中,對於超過一噸的鈮化合物粉塵,必須接觸評估,這使得新生產線的合規相關工程成本增加了 8% 至 12%。北美的小規模煉油廠正在合併以分攤這些成本,預計供應商數量將從 2020 年的 11 家減少到 2025 年的 7 家。雖然自動化和惰性氣體輸送降低了訴訟風險,但利潤率仍在持續下降 1% 至 2% 個百分點,抑制了短期投資意願。
細分市場分析
預計到2025年,3N級五氧化二鈮將佔全球產量的67.26%,鞏固其作為鈮鐵合金和中間合金製造製程中首選原料的地位。預計到2031年,該細分市場將以10.77%的複合年成長率成長,與五氧化二鈮市場的整體擴張保持同步。工業級氧化物在顏料和玻璃應用領域相對滯後,因為其較寬的雜質容差允許部分替代成本較低的鋯和鈰化合物。同時,4N級五氧化二鈮用於半導體濺射和單晶生長,並隨著對高頻濾波器需求的成長而迅速擴張。 JX Advanced Metals公司在2024年將其4N級產能提高了40%,以供應韓國的一家晶圓廠,這表明,在多年供應合約的支持下,超高純度產品的溢價是合理的。
長期以來,鈮鐵的季度基準價格保護了冶金級鈮鐵買家免受現貨價格波動的影響,並促進了整個五氧化二鈮市場的可預測現金流。相較之下,4N精煉商則受制於半導體資本支出週期,而該週期的年波動幅度可能高達30%。 ISO 11135:2024新定義了一種中間「醫療設備」等級,將鉭和鈦的含量限制在500 ppm以下,從而有效地將3N(大宗)鈮鐵和超高純度4N頻譜分類開來。同時通過ISO 9001和這項新醫療標準認證的加工商預計將在新興的滅菌和成像領域佔據利基市場。
《五氧化二鈮市場報告》按等級(工業級、3N、4N)、應用(鈮金屬、光學玻璃、超級電容器、高溫合金、陶瓷及其他)和地區(北美、南美、歐洲、亞太、中東和非洲)進行細分。市場預測以噸為單位。
區域分析
預計到2025年,亞太地區將佔五氧化二鈮市場規模的46.72%,並將在2031年之前以12.59%的年均成長率成長,成為所有地區中成長最快的地區。中國佔全球粗鋼產量的54%,支撐著對鈮鐵的需求;而日本和韓國則在半導體和光學價值鏈相關的超高純度鈮鐵細分市場中主導。在印度,由於高速公路建設和油氣管道的擴建,以及2026年新建2.5萬公里高速公路的政策目標,對鈮微量合金鋼的需求正在成長。在越南和印度尼西亞,一些專門為高層建築提供鈮鐵的綜合鋼鐵廠已經開始運作,並逐漸成為二線市場。
北美和歐洲對五氧化二鈮的消費主要受成熟的鋼鐵需求所驅動。 2025年,美國將獲得2,640萬美元的第三類津貼,用於重啟位於華頓的國內氧化物生產,從而將航太和國防領域與單一來源風險隔離。在歐洲,4N純度的鈮主要應用於半導體製造設備,但歐盟排放交易體系(EU ETS)下的碳定價機制推高了精煉成本,導致一些精煉商將超純鈮生產轉移到亞洲。儘管2024年歐盟關鍵原料法案簡化了鈮計畫的授權程序,但要確保與亞洲供應商的價格競爭力仍面臨挑戰。
南美、中東和非洲對五氧化二鈮的需求正在成長。 Globe Metals公司位於馬拉威的Kanika專案已於2024年完工,計畫於2027年開始生產,年產量為3,267噸。該項目可望滿足全球4%的需求,並有助於上游業務的多元化發展。中東地區的需求主要集中在用於酸性天然氣管道的鈮基不銹鋼上,例如沙烏地阿美公司的Jafra油田項目,該項目已於2024年開工。這些區域性的特定需求將起到一定的緩衝作用,雖然小規模,但對於應對巴西的供應中斷具有重要的戰略意義。
其他好處
- Excel格式的市場預測(ME)表
- 3個月的分析師支持
目錄
第1章:引言
- 研究假設和市場定義
- 調查範圍
第2章:調查方法
第3章執行摘要
第4章 市場狀況
- 市場概覽
- 市場促進因素
- 對高屈光光學玻璃的需求不斷成長
- 高抗張強度鋼和高溫合金的廣泛應用
- 基於Nb2O5的快速充電電池和超級電容器的擴展
- 5G/AR濺鍍技術的新應用
- 無鉛高介電常數陶瓷作為氧化鉛的替代品
- 市場限制因素
- 接觸Nb2O5粉塵可能引發健康與安全問題。
- 巴西供應鏈集中度
- 超高純度精煉過程中的高能耗和高碳排放
- 價值鏈分析
- 波特五力模型
- 供應商的議價能力
- 買方的議價能力
- 新進入者的威脅
- 替代品的威脅
- 競爭程度
- 供應分析
- 監理政策分析
- 貿易分析
- 價格趨勢分析
- 生產成本分析
第5章 市場規模與成長預測
- 按年級
- 工業級(99-99.8%)
- 3N(99.9%)
- 4N(99.99%)
- 透過使用
- 鈮金屬
- 光學玻璃
- 超級電容器
- 超合金
- 陶瓷製品
- 其他
- 按地區
- 亞太地區
- 中國
- 印度
- 日本
- 韓國
- ASEAN
- 亞太其他地區
- 北美洲
- 美國
- 加拿大
- 墨西哥
- 歐洲
- 德國
- 英國
- 法國
- 義大利
- 西班牙
- 北歐國家
- 土耳其
- 俄羅斯
- 其他歐洲國家
- 南美洲
- 巴西
- 阿根廷
- 南美洲其他地區
- 中東和非洲
- 沙烏地阿拉伯
- 南非
- 其他中東和非洲國家
- 亞太地區
第6章 競爭情勢
- 市場集中度
- 策略趨勢
- 市佔率和排名分析
- 公司簡介
- CBMM
- Edgetech Industries LLC
- Admat Inc.
- American Elements
- AMG
- Chengdu Huarui Industrial Co., Ltd.
- CMOC
- F& X Electro-Materials Limited
- Global Advanced Metals Pty Ltd
- Hebei Suoyi New Material Technology Co., Ltd.
- JX Advanced Metals Corporation
- Kurt J. Lesker Company
- Materion Corp.
- Mitsui Mining & Smelting Co., Ltd.
- MPIL
- SCI Engineered Materials
- Solikamsk Magnesium Plant
- Taki Chemical Co., Ltd.
- TANIOBIS
- XIMEI Resources Holding Limited
第7章 市場機會與未來展望
The Niobium Pentoxide Market size is projected to expand from 7.73 kilotons in 2025 and 8.51 kilotons in 2026 to 13.76 kilotons by 2031, registering a CAGR of 10.09% between 2026 to 2031.
Robust infrastructure spending in Asia, a steady aerospace-fleet renewal cycle in North America, and rapid adoption of ultra-fast-charging battery chemistries are sustaining double-digit demand growth. Bulk consumption in high-strength steels continues to anchor volumes, yet rapidly scaling niche uses in optical glass, additive-manufacturing powders, and 5G radio-frequency sputtering targets are improving the overall value mix. Supply-chain diversification initiatives outside Brazil have gathered pace since 2024, but CBMM's dominant ore reserve still underpins price discovery. Forward-looking procurement teams are therefore tying up long-term offtake contracts and investing in closed-loop recycling to hedge volatility.
Global Niobium Pentoxide Market Trends and Insights
Growing Demand for High-Refractive-Index Optical Glass
Japanese glassmakers ramped Nb2O5-doped blank output in 2024 to satisfy smartphone and augmented-reality lens programs, achieving refractive indices above 1.9 without lead additions. Aspherical camera elements now contain up to 20 weight percent niobium pentoxide, enabling thinner modules in premium handsets and lighter optics in head-mounted displays. Automakers are also specifying niobium-doped silica in solid-state lidar waveguides to reduce scattering losses. Optical uses consume less than 2% of global volume, yet their margin premium supports incremental capacity for 4N refining. Producers, therefore, balance allocations between high-value glass and bulk steel channels to maximize asset utilization.
Rising Adoption in High-Strength Steels and Superalloys
Pipeline builders rely on 0.02-0.05% niobium additions to hit API 5L X80 grade without post-weld heat treatment, a benefit that speeds Arctic and deepwater projects. China laid nearly 8,000 kilometers of transmission pipe annually between 2024 and 2025, keeping ferroniobium demand resilient even as rebar growth slowed. In aviation, niobium-bearing superalloys such as Inconel 718 deliver creep resistance above 650 °C, a prerequisite for geared turbofan disks certified in 2024. The dual pull from infrastructure and aerospace secures a long-run foundation for bulk oxide consumption.
Health and Safety Concerns from Nb2O5 Dust Exposure
OSHA caps respirable niobium-compound dust at 5 mg/m3, pushing refiners to install enclosed handling and real-time monitors. Europe's REACH regime demands downstream exposure assessments for volumes over one tonne, adding compliance engineering costs of 8-12% on new lines. Smaller North American converters have merged to amortize these expenses, leaving seven suppliers in 2025 versus eleven in 2020. Automation and inert-gas transfers relieve litigation risk, yet margin erosion of one to two points persists, tempering near-term investment appetites.
Other drivers and restraints analyzed in the detailed report include:
- Expansion of Nb2O5-Based Fast-Charging Batteries and Supercapacitors
- Emerging Use in 5G / AR Sputtering Targets
- Supply-Chain Concentration in Brazil
For complete list of drivers and restraints, kindly check the Table Of Contents.
Segment Analysis
The 3N grade captured 67.26% of global volume in 2025, underscoring its status as preferred feedstock for ferroniobium and master-alloy chains. This segment is forecast to post a 10.77% CAGR to 2031, keeping pace with overall niobium pentoxide market expansion. Industrial-grade oxide trails because pigment and glass uses tolerate wider impurity windows, allowing partial substitution by lower-cost zirconium or cerium compounds. Meanwhile, the 4N segment serves semiconductor sputtering targets and single-crystal growth, and is expanding quickly as radio-frequency filter demand rises. JX Advanced Metals lifted 4N capacity by 40% in 2024 to supply Korean fabs, a sign that ultra-pure streams can justify premium pricing when underpinned by multiyear volume commitments.
Long-standing quarterly ferroniobium benchmarks shield metallurgical-grade buyers from spot volatility, fostering predictable cash flow across the niobium pentoxide market. By contrast, 4N refiners must ride semiconductor capital-expenditure cycles that swing as much as 30% year over year. ISO 11135:2024 now defines an intermediate "medical-device" grade that caps tantalum and titanium below 500 ppm, effectively splitting the spectrum between bulk 3N and ultra-pure 4N. Converters that certify to both ISO 9001 and the new medical standard are poised to capture emerging sterilization and imaging niches.
The Niobium Pentoxide Market Report is Segmented by Grade (Industrial Grade, 3N, and 4N), Application (Niobium Metal, Optical Glass, Supercapacitors, Superalloys, Ceramics, and Others), and Geography (North America, South America, Europe, Asia-Pacific, and Middle East and Africa). The Market Forecasts are Provided in Terms of Volume (Tons).
Geography Analysis
Asia-Pacific accounted for 46.72% of the niobium pentoxide market volume in 2025 and is projected to grow at 12.59% through 2031, the fastest regional growth. China's 54% share of global crude-steel output anchors ferroniobium pull, while Japan and South Korea command ultra-pure niches tied to semiconductor and optics value chains. India's highway build-out and oil-and-gas pipeline expansions are boosting demand for niobium-microalloyed steels, supported by policy targets that aim for 25,000 kilometers of new highways by 2026. Vietnam and Indonesia are emerging as secondary hubs as they commission integrated mills specifying ferroniobium for high-rise construction.
North American and European consumption of niobium pentoxide is affected by mature steel demand. The United States restarted domestic oxide production in 2025 at Boyertown under a USD 26.4 million Title III award, insulating aerospace and defense flows from single-source risk. Europe tilts toward 4N purity for semiconductor equipment, yet carbon-pricing under the EU ETS inflates refining costs, prompting some converters to relocate ultra-pure steps to Asia. The EU Critical Raw Materials Act of 2024 streamlines permits for niobium projects, but price parity with Asian supply remains elusive.
South America, the Middle East, and Africa together are witnessing rising demand for niobium pentoxide. Globe Metals' Kanyika project in Malawi, finalized in 2024, targets first production by 2027 at 3,267 tpa, which could supply 4% of global demand and diversify the upstream base. Middle-East uptake centers on niobium-stabilized stainless steels for sour-gas pipelines, an example being Saudi Aramco's Jafurah field that broke ground in 2024. These niche regional drivers provide a modest but strategically important buffer against any Brazilian disruption.
- CBMM
- Edgetech Industries LLC,
- Admat Inc.,
- American Elements
- AMG
- Chengdu Huarui Industrial Co., Ltd.
- CMOC
- F&X Electro-Materials Limited
- Global Advanced Metals Pty Ltd
- Hebei Suoyi New Material Technology Co., Ltd.
- JX Advanced Metals Corporation
- Kurt J. Lesker Company
- Materion Corp.
- Mitsui Mining & Smelting Co., Ltd.
- MPIL
- SCI Engineered Materials
- Solikamsk Magnesium Plant
- Taki Chemical Co., Ltd.
- TANIOBIS
- XIMEI Resources Holding Limited
Additional Benefits:
- The market estimate (ME) sheet in Excel format
- 3 months of analyst support
TABLE OF CONTENTS
1 Introduction
- 1.1 Study Assumptions and Market Definition
- 1.2 Scope of the Study
2 Research Methodology
3 Executive Summary
4 Market Landscape
- 4.1 Market Overview
- 4.2 Market Drivers
- 4.2.1 Growing demand for high-refractive-index optical glass
- 4.2.2 Rising adoption in high-strength steels and superalloys
- 4.2.3 Expansion of Nb2O5-based fast-charging batteries and supercapacitors
- 4.2.4 Emerging use in 5G/AR sputtering targets
- 4.2.5 Lead-free high-k dielectric ceramics replacing PbO
- 4.3 Market Restraints
- 4.3.1 Health and safety concerns from Nb2O5 dust exposure
- 4.3.2 Supply-chain concentration in Brazil
- 4.3.3 High energy and carbon footprint of ultra-pure refining
- 4.4 Value Chain Analysis
- 4.5 Porter's Five Forces
- 4.5.1 Bargaining Power of Suppliers
- 4.5.2 Bargaining Power of Buyers
- 4.5.3 Threat of New Entrants
- 4.5.4 Threat of Substitutes
- 4.5.5 Degree of Competition
- 4.6 Supply Analysis
- 4.7 Regulatory Policy Analysis
- 4.8 Trade Analysis
- 4.9 Price Trend Analysis
- 4.10 Production Cost Analysis
5 Market Size and Growth Forecasts (Volume)
- 5.1 By Grade
- 5.1.1 Industrial Grade (99-99.8 %)
- 5.1.2 3N (99.9 %)
- 5.1.3 4N (99.99 %)
- 5.2 By Application
- 5.2.1 Niobium Metal
- 5.2.2 Optical Glass
- 5.2.3 Supercapacitors
- 5.2.4 Superalloys
- 5.2.5 Ceramics
- 5.2.6 Others
- 5.3 By Geography
- 5.3.1 Asia-Pacific
- 5.3.1.1 China
- 5.3.1.2 India
- 5.3.1.3 Japan
- 5.3.1.4 South Korea
- 5.3.1.5 ASEAN Countries
- 5.3.1.6 Rest of Asia-Pacific
- 5.3.2 North America
- 5.3.2.1 United States
- 5.3.2.2 Canada
- 5.3.2.3 Mexico
- 5.3.3 Europe
- 5.3.3.1 Germany
- 5.3.3.2 United Kingdom
- 5.3.3.3 France
- 5.3.3.4 Italy
- 5.3.3.5 Spain
- 5.3.3.6 Nordic Countries
- 5.3.3.7 Turkey
- 5.3.3.8 Russia
- 5.3.3.9 Rest of Europe
- 5.3.4 South America
- 5.3.4.1 Brazil
- 5.3.4.2 Argentina
- 5.3.4.3 Rest of South America
- 5.3.5 Middle-East and Africa
- 5.3.5.1 Saudi Arabia
- 5.3.5.2 South Africa
- 5.3.5.3 Rest of Middle-East and Africa
- 5.3.1 Asia-Pacific
6 Competitive Landscape
- 6.1 Market Concentration
- 6.2 Strategic Moves
- 6.3 Market Share/Ranking Analysis
- 6.4 Company Profiles {(includes Global level Overview, Market level overview, Core Segments, Financials as available, Strategic Information, Market Rank/Share for key companies, Products and Services, and Recent Developments)}
- 6.4.1 CBMM
- 6.4.2 Edgetech Industries LLC,
- 6.4.3 Admat Inc.,
- 6.4.4 American Elements
- 6.4.5 AMG
- 6.4.6 Chengdu Huarui Industrial Co., Ltd.
- 6.4.7 CMOC
- 6.4.8 F&X Electro-Materials Limited
- 6.4.9 Global Advanced Metals Pty Ltd
- 6.4.10 Hebei Suoyi New Material Technology Co., Ltd.
- 6.4.11 JX Advanced Metals Corporation
- 6.4.12 Kurt J. Lesker Company
- 6.4.13 Materion Corp.
- 6.4.14 Mitsui Mining & Smelting Co., Ltd.
- 6.4.15 MPIL
- 6.4.16 SCI Engineered Materials
- 6.4.17 Solikamsk Magnesium Plant
- 6.4.18 Taki Chemical Co., Ltd.
- 6.4.19 TANIOBIS
- 6.4.20 XIMEI Resources Holding Limited
7 Market Opportunities and Future Outlook
- 7.1 White-space and Unmet-Need Assessment

 高純度鈮金屬市場規模:依產品類型、終端用戶產業、地區及預測分類。
 五氧化二鈮市場-2026-2032年全球市場預測
 鈮:市場佔有率分析、產業趨勢與統計、成長預測(2026-2031)
 鈮棒市場規模、佔有率和成長分析:按產品類型、形狀和規格、應用領域、終端用戶產業和地區分類-2026-2033年產業預測
 四甲基庚二酮鈮市場規模、佔有率和成長分析:按產品等級/純度、應用/製程技術、最終用途、最終用途產業和地區分類 - 產業預測,2026-2033年2026-2034年全球五氧化二鈮市場規模、佔有率、趨勢和成長分析報告鈮及鈮合金市場按類型、應用、終端用戶產業、形態、等級及生產方法分類-2026-2032年全球預測
 五氧化二鈮市場規模、佔有率及成長分析(按等級、應用和地區)-產業預測,2025-2032
 全球五氧化二鈮市場
 2032 年鈮市場預測:按類型、純度等級、通路、應用、最終用戶和地區進行的全球分析