


 |
市場調查報告書
商品編碼
2044244
英國共享辦公空間:市場佔有率分析、產業趨勢與統計及成長預測(2026-2031)UK Co-Working Office Spaces - Market Share Analysis, Industry Trends & Statistics, Growth Forecasts (2026 - 2031) |
||||||
※ 本網頁內容可能與最新版本有所差異。詳細情況請與我們聯繫。
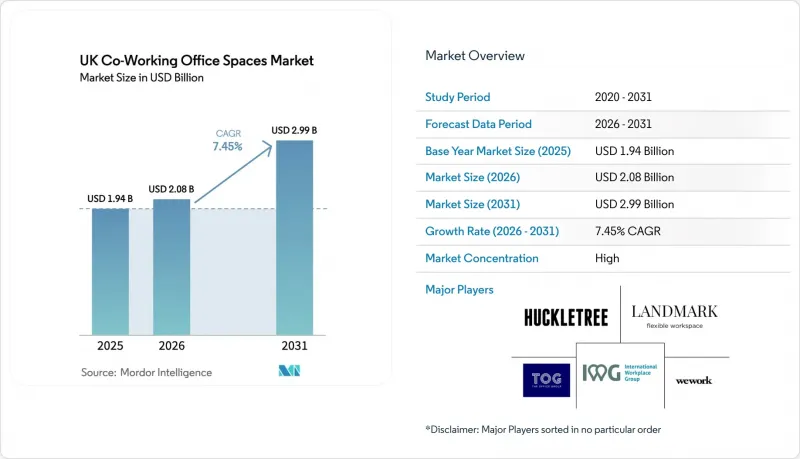
英國共享辦公空間市場在 2025 年的價值為 19.4 億美元,預計到 2031 年將達到 29.9 億美元,而 2026 年為 20.8 億美元,預測期(2026-2031 年)的複合年成長率為 7.45%。
越來越多的雇主正式採用混合辦公模式,推動了市場需求的成長,並將靈活的辦公空間從臨時福利轉變為房地產策略的核心要素。企業正在重新評估總部規模,同時增加區域衛星辦公室的數量,從而擴大了英國共享辦公空間市場的潛在客戶群。同時,ESG(環境、社會和治理)要求迫使業主維修或開發符合BREEAM或LEED認證標準的建築,這促使營運商優先選擇獲得認證的物業,此類物業的租金溢價可達15-20%。資金充裕,家族辦公室、基礎設施基金和房地產投資信託基金(REITs)將未開發的資金投入到收益分成協議中,這些協議既能保護運營商免受高昂的室內翻新成本之苦,又能為業主提供利潤分成的機會。同時,曼徹斯特和貝爾法斯特等區域中心城市正在縮小與倫敦的差距,這表明英國共同工作空間市場正在經歷持續的地域再平衡,從而分散營運商的投資組合風險。
英國共享辦公空間市場趨勢與洞察
混合辦公模式的廣泛採用有助於維持彈性辦公空間兩位數的入住率。
目前,英國三分之二的雇主要求員工每周至少部分時間在辦公室辦公,這一比例自2023年以來急劇上升。預計到2025年,平均辦公室運轉率將達到66%。因此,企業正從固定租金租賃轉向可根據員工人數彈性調整的變動成本辦公桌租賃模式。科技巨頭正在推廣將即時數據整合到排班工具中的佔用感測器生態系統,而能夠與這些系統整合的營運商也正與企業簽訂合約。這種普及趨勢支撐著英國共享辦公空間市場維持兩位數的穩定吸收率。
科技、創新和專業服務類租戶正在多個城市擴大業務。
政府對遊戲、電影和數位媒體的補貼(自2024年起總額達4.8億美元)正吸引租戶湧向曼徹斯特、伯明罕和利茲。這些城市在新興創新區提供一體化工作室和共享辦公空間。專業服務公司也呈現類似的趨勢,它們嘗試在倫敦以外部署近岸交付團隊以控制人事費用,這正在將英國共同工作空間市場拓展到大都會區以外。
倫敦中心城區局部供應過剩導致辦公桌租金下降。
2022年至2024年間,倫敦金融城和威斯敏斯特區的辦公空間庫存增加了超過100萬平方英尺,但運轉率低於70%。 2024年初,平均每月辦公桌租金達到994美元,但周邊地區的房東為了填補空置房源,現在提供免租期和室內裝修補貼,這給現有營運商的利潤率帶來了壓力。
細分市場分析
大型園區正處於最快的成長軌道上,預計在2026年至2031年間將以9.11%的複合年成長率成長。 Bruntwood SciTech和British Land等營運商正在開發20萬平方英尺的CL2級環保項目,透過將室內施工時間縮短至八週,吸引生物技術和人工智慧驅動的藥物研發企業。中型園區仍佔據英國共享辦公空間市場最大的佔有率,達到43%。這得歸功於在多個城市運營5000至2萬平方英尺辦公室的公司的支持。面積小於5000平方英尺的小規模社區辦公室正在倫敦郊區蓬勃發展,滿足了人們在家附近工作的需求,同時最大限度地減少了通勤負擔。這三種形式的結合使營運商的收入來源多元化,從而降低了其受經濟波動的影響。
由於需求多樣化,營運商需要平衡其投資組合。園區型辦公空間通常以與主要租戶簽訂多年合約為核心,中型中心則作為衛星辦公點,而小規模辦公空間則滿足自由工作者的需求。如果某個集團的辦公空間規模過於集中於某一特定類型,則可能面臨運轉率驟降的風險,因為租戶的需求會隨之改變。因此,英國共享辦公空間市場的擴張計畫已普遍包含至少涵蓋各個規模層級的資產,以應對結構性變化。
其他好處
- Excel格式的市場預測(ME)表
- 3個月的分析師支持
目錄
第1章:引言
- 研究假設和市場定義
- 調查範圍
第2章:調查方法
第3章執行摘要
第4章 市場狀況
- 市場概覽
- 市場促進因素
- 隨著混合辦公模式的普及,靈活空間的吸收能力持續維持兩位數成長。
- 透過科技、創新和專業服務租戶實現跨城市企業發展。
- 區域性地點(曼徹斯特、伯明罕、利茲)的需求激增,降低了對倫敦的依賴。
- 為了滿足租戶的 ESG 要求,我們正在向 BREEAM/LEED 認證的空間遷移。
- 家族辦公室和基礎設施基金預留資金,用於投資盈利的共享辦公空間專案。
- 房東與物業管理公司之間的收益分成模式,降低了新物業的進入門檻。
- 市場限制因素
- 倫敦市中心部分區域的辦公空間供應過剩,導致辦公桌租金下降。
- 能源、設施管理和人事費用的上漲給企業的EBITDA獲利率。
- 英國通膨和景氣衰退擔憂導致中小企業需求波動
- 非常規競爭對手將削弱定價權(飯店大廳通行證、零售快閃店)
- 價值/供應鏈分析
- 概述
- 房地產開發商和資產所有者——關鍵的定量和定性見解
- 工作空間設計技術顧問—關鍵的定量和定性見解
- 模組化家具和智慧辦公室解決方案提供者—關鍵定量和定性洞察
- 監管狀態(用途分類 E,EPC-B 2030 強制性要求,營業稅減免措施)
- 科技展望(房地產科技、基於物聯網的辦公桌預訂、人工智慧驅動的空間最佳化)
- 辦公室房地產關鍵指標(供應量、租金、價格、運轉率/空置率)
- 遠距辦公對空間需求的影響
- 波特五力模型
- 供應商的議價能力
- 買方的議價能力
- 新進入者的威脅
- 替代品的威脅
- 競爭公司之間的競爭
第5章 市場規模與成長預測
- 按設施規模
- 小規模
- 中號
- 大規模
- 部門
- 資訊科技與資訊科技服務
- BFSI
- 專業商業諮詢服務
- 其他服務(零售、生命科學、能源、法律)
- 按最終用途
- 自由工作者
- 公司
- 新創企業及其他
- 國家
- 英格蘭
- 倫敦
- 英國的其他中東和非洲國家
- 蘇格蘭
- 威爾斯
- 北愛爾蘭
- 英格蘭
第6章 競爭情勢
- 市場集中度
- 策略趨勢
- 公司簡介
- International Workplace Group plc(IWG)
- WeWork
- The Office Group
- Landmark
- Huckletree
- Labs
- Work Well Offices
- The Brew
- Jactin House
- Icon Offices
- Wimbletech CIC
- The Skiff
- Soho Works
- Creative Works
- The Hoxton
- Mare Street Market
- Southbank Centre
- Bruntwood Works
- Knotel UK
- Clockwise Offices
第7章 市場機會與未來展望
The UK co-working spaces market size was valued at USD 1.94 billion in 2025 and estimated to grow from USD 2.08 billion in 2026 to reach USD 2.99 billion by 2031, at a CAGR of 7.45% during the forecast period (2026-2031).
Demand is being propelled by employers formalizing hybrid policies, which has shifted flexible workspace from a cyclical perk to a core component of real-estate strategy. Enterprises are renegotiating headquarters footprints while adding regional satellites, a move that enlarges the addressable pool for the UK co-working spaces market. ESG mandates are simultaneously pushing landlords to retrofit or develop BREEAM- and LEED-certified buildings, encouraging operators to prioritize certified assets where rent premiums reach 15-20%. Capital is abundant: family offices, infrastructure funds, and REITs are allocating dry powder to revenue-share agreements that shield operators from heavy fit-out costs and give landlords upside participation. Meanwhile, regional hubs such as Manchester and Belfast are closing the gap with London, signaling a durable geographic rebalancing that diversifies portfolio risk for providers active in the UK co-working spaces market.
UK Co-Working Office Spaces Market Trends and Insights
Hybrid-Work Penetration Sustaining Double-Digit Flexible-Space Absorption
Two-thirds of UK employers now require employees in the office at least part of the week, up sharply since 2023, and average office utilization hit 66% in 2025. Companies are therefore shifting from fixed leases toward variable-cost desks that can expand or contract with headcount. Technology giants have mainstreamed occupancy-sensor ecosystems that feed real-time data into scheduling tools, and operators able to plug into this stack are winning enterprise contracts. This uptake underpins stable, double-digit absorption across the UK co-working spaces market.
Technology, Creative & Professional-Services Tenants Extending Multi-City Footprints
Government grants for gaming, film, and digital media-totaling USD 480 million since 2024-are driving tenants to Manchester, Birmingham, and Leeds, where new innovation districts bundle studio space with co-working floors. Professional-services firms mirror this pattern, piloting nearshore delivery teams outside London to control salary costs, which enlarges the UK co-working spaces market beyond the capital.
Localized Oversupply in Central-London Sub-Markets Depressing Desk Rates
Inventory in the City and Westminster grew by more than 1 million sq ft between 2022-2024, yet utilization lingers below 70%. Average monthly desk rates reached USD 994 in early 2024, but landlords in fringe zones now offer rent-free periods and fit-out subsidies to fill space, straining margins for incumbent operators.
Other drivers and restraints analyzed in the detailed report include:
- Regional-Hub Demand Spike Narrowing London Dependence
- Shift Toward BREEAM/LEED-Certified Spaces to Meet Occupiers' ESG Mandates
- Elevated Energy, FM and Labor Costs Squeezing Operator EBITDA Margins
For complete list of drivers and restraints, kindly check the Table Of Contents.
Segment Analysis
Large campuses accounted for the fastest expansion path, registering a 9.11% CAGR outlook as of 2026-2031. Operators like Bruntwood SciTech and British Land are building 200,000 sq ft CL2-ready developments that compress fit-out timelines to eight weeks, making them magnets for biotech and AI drug-discovery ventures. Medium-scale hubs still hold the greatest slice at 43% of the UK co-working spaces market share, favored by enterprises distributing 5,000-20,000 sq ft footprints across multiple cities. Small neighborhood locations under 5,000 sq ft flourish in suburban London, absorbing work-from-near-home demand with minimal commute friction. Collectively, the trio of formats gives providers a diversified revenue mix that insulates them from cycle swings.
Demand heterogeneity requires operators to balance portfolio mix. Campuses can anchor multi-year agreements with anchor tenants, while medium hubs function as satellite nodes, and small sites satisfy freelancers. Groups that over-index on one scale risk occupancy shocks as tenant requirements evolve. Consequently, expansion blueprints in the UK co-working spaces market now bundle at least one asset in each scale tier to hedge against structural shifts.
The United Kingdom Co-Working Office Spaces Market Report is Segmented by Size & Scale of Facility (Small, Medium, Large), by Sector (IT & ITES, BFSI, Business Consulting & Professional Services, Other Services), by End Use (Freelancers, Enterprises, Start-Ups & Others), and by Geography (England, Scotland, Wales, Northern Ireland). The Market Forecasts are Provided in Terms of Value (USD).
List of Companies Covered in this Report:
- International Workplace Group plc (IWG)
- WeWork
- The Office Group
- Landmark
- Huckletree
- Labs
- Work Well Offices
- The Brew
- Jactin House
- Icon Offices
- Wimbletech CIC
- The Skiff
- Soho Works
- Creative Works
- The Hoxton
- Mare Street Market
- Southbank Centre
- Bruntwood Works
- Knotel UK
- Clockwise Offices
Additional Benefits:
- The market estimate (ME) sheet in Excel format
- 3 months of analyst support
TABLE OF CONTENTS
1 Introduction
- 1.1 Study Assumptions & Market Definition
- 1.2 Scope of the Study
2 Research Methodology
3 Executive Summary
4 Market Landscape
- 4.1 Market Overview
- 4.2 Market Drivers
- 4.2.1 Hybrid-work penetration sustaining double-digit flexible-space absorption
- 4.2.2 Technology, creative & professional-services tenants extending multi-city footprints
- 4.2.3 Regional-hub demand spike (Manchester, Birmingham, Leeds) narrowing London dependence
- 4.2.4 Shift toward BREEAM/LEED-certified spaces to meet occupiers' ESG mandates
- 4.2.5 Family-office & infrastructure-fund capital earmarked for income-resilient co-working portfolios
- 4.2.6 Landlord-operator revenue-share models lowering entry barriers for new sites
- 4.3 Market Restraints
- 4.3.1 Localized oversupply in Central-London sub-markets depressing desk rates
- 4.3.2 Elevated energy, FM and labour costs squeezing operator EBITDA margins
- 4.3.3 SME demand volatility amid UK inflation/recession fears
- 4.3.4 Upcoming non-traditional competition (hotel-lobby passes, retail pop-ups) eroding pricing power
- 4.4 Value / Supply-Chain Analysis
- 4.4.1 Overview
- 4.4.2 Real-Estate Developers & Asset Owners - Key Quantitative and Qualitative Insights
- 4.4.3 Workspace Design & Technology Consultants - Key Quantitative and Qualitative Insights
- 4.4.4 Modular Furniture & Smart-Office Solution Providers - Key Quantitative and Qualitative Insights
- 4.5 Regulatory Landscape (Planning-use-class E, EPC-B 2030 mandate, business-rates reliefs)
- 4.6 Technological Outlook (prop-tech, IoT-enabled desk booking, AI space-optimisation)
- 4.7 Key Office-Real-Estate Metrics (Supply, Rentals, Prices, Occupancy/Vacancy %)
- 4.8 Impact of Remote Working on Space Demand
- 4.9 Porter's Five Forces
- 4.9.1 Bargaining Power of Suppliers
- 4.9.2 Bargaining Power of Buyers
- 4.9.3 Threat of New Entrants
- 4.9.4 Threat of Substitutes
- 4.9.5 Intensity of Competitive Rivalry
5 Market Size & Growth Forecasts (Value, USD)
- 5.1 By Size & Scale of Facility
- 5.1.1 Small
- 5.1.2 Medium
- 5.1.3 Large
- 5.2 By Sector
- 5.2.1 IT & ITES
- 5.2.2 BFSI
- 5.2.3 Business Consulting & Professional Services
- 5.2.4 Other Services (Retail, Lifesciences, Energy, Legal)
- 5.3 By End Use
- 5.3.1 Freelancers
- 5.3.2 Enterprises
- 5.3.3 Start-ups & Others
- 5.4 By Country
- 5.4.1 England
- 5.4.1.1 London
- 5.4.1.2 Rest of England
- 5.4.2 Scotland
- 5.4.3 Wales
- 5.4.4 Northern Ireland
- 5.4.1 England
6 Competitive Landscape
- 6.1 Market Concentration
- 6.2 Strategic Moves
- 6.3 Company Profiles {(includes Global-level Overview, Market-level overview, Core Segments, Financials as available, Strategic Information, Market Rank/Share, Products & Services, Recent Developments)}
- 6.3.1 International Workplace Group plc (IWG)
- 6.3.2 WeWork
- 6.3.3 The Office Group
- 6.3.4 Landmark
- 6.3.5 Huckletree
- 6.3.6 Labs
- 6.3.7 Work Well Offices
- 6.3.8 The Brew
- 6.3.9 Jactin House
- 6.3.10 Icon Offices
- 6.3.11 Wimbletech CIC
- 6.3.12 The Skiff
- 6.3.13 Soho Works
- 6.3.14 Creative Works
- 6.3.15 The Hoxton
- 6.3.16 Mare Street Market
- 6.3.17 Southbank Centre
- 6.3.18 Bruntwood Works
- 6.3.19 Knotel UK
- 6.3.20 Clockwise Offices
7 Market Opportunities & Future Outlook
- 7.1 White-Space & Unmet-Need Assessment
 辦公空間市場規模、佔有率和成長分析:按物業類型、等級、租賃類型、公司規模、最終用途產業、用途和地區分類-2026-2033年產業預測
 印度彈性辦公空間:市場佔有率分析、產業趨勢與統計及成長預測(2026-2031)
 共享辦公空間市場:按類型、產品類型、營運模式、產業和最終用戶分類-2026-2032年全球市場預測
 辦公空間市場-全球產業規模、佔有率、趨勢、機會、預測:按類型、應用、地區和競爭格局分類,2021-2031年
 2026年全球公用廚房預約平台市場報告
 共享辦公空間預訂平台市場預測至2034年——全球平台類型、工作空間類型、定價模式、功能、應用、最終用戶和區域分析2026年全球共享辦公桌市場報告2026年全球共享辦公空間市場報告
 全球共享辦公空間市場規模、佔有率、趨勢和成長分析報告(2026-2034)
 共享辦公空間市場:按空間類型和區域分類