


 |
市場調查報告書
商品編碼
2044099
微電網:市場佔有率分析、產業趨勢與統計、成長預測(2026-2031)Microgrid - Market Share Analysis, Industry Trends & Statistics, Growth Forecasts (2026 - 2031) |
||||||
※ 本網頁內容可能與最新版本有所差異。詳細情況請與我們聯繫。
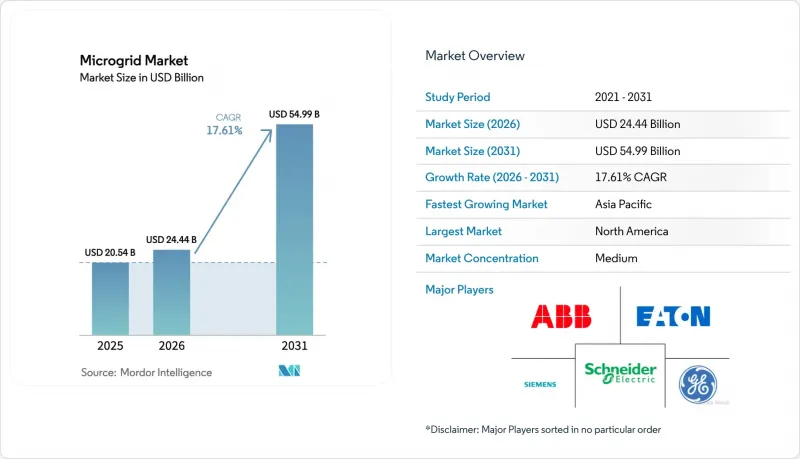
預計微電網市場將從 2025 年的 205.4 億美元成長到 2026 年的 244.4 億美元,到 2031 年將達到 549.9 億美元,2026 年至 2031 年的複合年成長率為 17.61%。
這一成長的促進因素包括逆變器和電池成本的下降、電網形成技術的進步(推動可再生能源採用率超過90%)以及將電網韌性與監管收入直接掛鉤的現行政策要求。電力公司的試點項目正在擴展為全面的饋線級項目,軍事基地也迅速朝著淨零排放目標邁進。即使硬體日趨商品化,軟體仍在推動利潤成長。美國西部地區日益成長的野火相關責任、島國柴油燃料物流挑戰以及資料中心對黑啟動能力的需求,都在推動分散式、自給自足電力系統的商業化。所有這些因素共同推動企劃案融資從津貼主導的試點計畫轉向結構化的、基於結果的合約。
全球微電網市場趨勢與洞察
加速非洲和南亞農村電氣化進程
根據世界銀行的數據,2020年至2024年間,非洲34個國家部署了8,700個微電網,為410萬人提供服務,但仍有6億人缺乏穩定的電力供應。到2030年,這項未滿足的需求將導致微電網市場出現420億美元的投資缺口。 [1] 國際金融公司(IFC)在2024年至2025年間籌集了5億美元的混合融資,旨在將奈及利亞和肯亞開發商的資本成本降低6個百分點。印度新能源和可再生能源部已在2024年至2025年間撥款344億盧比(約4.13億美元),用於將20萬台農業水泵改造為太陽能驅動,預計每年可節省12億公升柴油。孟加拉基礎設施發展有限公司將於2024年為1850個太陽能微電網提供額外資金,而亞洲開發銀行(亞銀)已承諾在2025年向南亞和東南亞的混合系統提供11億美元的資金。這些措施將共同降低離網微電網的資本成本並縮短建造時間,取代昂貴的柴油燃料。
IT/OT的整合正在推動北美先進微電網控制設備的發展。
美國國家電氣製造商協會 (NEMA) 發布了美國標準 US 80056-2024,為微電網市場的基礎—操作技術(OT) 設備和企業 IT 系統之間的雙向資料交換建立了通用資料模型。因此,微電網控制器現在可以整合來自天氣預報、批發價格訊號和建築管理系統的輸入訊息,每 15 分鐘最佳化一次發電計劃。Schneider Electric的 EcoStruxure 微電網顧問系統已在美國 47 個站點實現了到 2025 年年中高峰需求費用降低 23%。同時,ABB 的 Ability Energy Manager 可直接與企業 ERP(企業資源計劃)系統整合,從而在 PJM 容量市場中實現需量反應競標的自動化。然而,網路安全情勢依然不盡人意。美國國家標準與技術研究院 (NIST) 在 2024 年進行的審計發現,62% 的受訪計畫缺乏統一認證。標準化加速了控制器的普及,但也提高了合規性要求。
美國各州之間的法規差異導致電網連接核准在全美延誤。
儘管聯邦能源監管委員會 (FERC) 第 2023 號指令簡化了發電設施的核准流程,但微電網市場的州級核准流程仍然不一致。加州的叢集調查將 2024 年的核准中位數時間縮短至 18 個月,而德克薩斯州的順序調查則導致 142 吉瓦的項目被擱置。紐約州現在強制要求 5 兆瓦以上的微電網必須提供綜合慣性,這導致 23 個總計 87 兆瓦的項目被推遲。 2024 年 8 月,佛羅裡達州暫停了為期一年的新申請,凍結了一項計劃中的 12 億美元投資。在各州法規統一之前,開發商可能傾向於風險較高的方案,優先考慮表後系統和規則更清晰的市場。
細分市場分析
在2025年規劃的項目中,併網配置佔62.3%。這為電力公司提供了一種替代昂貴電網升級的方案,同時也為微電網市場帶來了輔助服務收入。離網系統仍是7.33億人口的生命線,這些人口主要分佈在撒哈拉以南非洲和南亞,缺乏穩定的電力供應。在柴油價格超過每公升1.40美元、輸電費用接近每千瓦時0.04美元的地區,離網資產可提供更高的內部報酬率。對於併網專案而言,參與容量市場(例如PJM的結算價格為每兆瓦每天269.92美元)可提供額外的收入來源,從而縮短投資回收期。
在微電網市場,混合連接目前介於這兩種模式之間。在波多黎各,超過5兆瓦的微電網必須配備自動傳輸切換功能;而加州修訂後的21號規則則要求智慧逆變器能夠應對電壓和頻率波動。透過星鍊和其他技術實現的衛星回程傳輸,使得在非洲數百個站點進行遠距離診斷成為可能,從而降低了維護成本。在各個地區,孤島運作能力正從選用功能轉變為專案必備條件。
即使到了2025年,硬體仍將佔微電網市場收入的63.3%,但鋰離子電池和太陽能組件價格的持續下降正給系統整合商的利潤率帶來壓力。相較之下,軟體目前的毛利率為25%至35%,預計將以22.3%的複合年成長率成長。基於機器學習的調度透過最佳化充放電週期,使其與15分鐘批發價格和需求費用的適用時間相匹配,有助於提高收入。 「即服務」合約也正在興起。例如,Engie公司透過以低於電網價格的價格出售電力,同時保留資產所有權,從而降低了客戶的資本支出(CAPEX)。基於績效的營運契約,保證98%或更高的運轉率,現在已成為公共部門採購的標準。
微電網市場報告按連接類型(併網和離網)、交付類型(硬體、軟體和服務)、電源(太陽能、熱電聯產、燃料電池等)、類型(交流微電網、直流微電網等)、額定功率(1MW 以下、1-5MW 及其他)、最終用戶(公共產業、商業和工業以及住宅)和地區(北美地區及其他地區及其他地區。
區域分析
2025年,北美佔全球裝置容量的38.6%。這得歸功於加州18億美元的獎勵支出以及國防部強制性的淨零排放基地計畫。 2024年至2025年間,加拿大資助了18個由原住民主導的微電網計畫;墨西哥隨著分散式電力市場的重新開放,啟動了67兆瓦的工業計畫。在美國,各州之間監管差異仍然是最大的瓶頸。
亞太地區是成長最快的地區,預計到2031年複合年成長率將達到23.7%。在印度,PM-KUSUM計畫正在推動農業水泵大規模太陽能改造;在日本,福島第一核電事故後,政府實施了災害應變標準;在中國,「十四五」計畫的目標是在偏遠省份實現50吉瓦分散式太陽能發電。東南亞島嶼正在用太陽能和電池儲能系統取代昂貴的柴油進口,而澳洲則透過其鄰近地區的電池舉措,在預防野火和社區儲能之間取得平衡。
預計到2025年,歐洲將佔據22%的市場佔有率,是電網形成技術的先驅。在芬蘭,90兆瓦的電池儲能將提供複合慣性力,瑞典也已訂購了200兆瓦的專案。英國和西班牙的獎勵正在加速島嶼地區和脆弱電網中本地電池儲能的部署。基於NIS2的網路安全指令將增加合規成本,但會增強營運商的應變能力。
南美洲和中東及非洲地區的裝置容量僅佔全球總裝置容量的18%,但成長率接近20%。巴西正在利用生質能燃料,阿根廷正在重振再生能源計畫(RenovAr),哥倫比亞已確定了340個離網地區。在沿岸地區,石油公司正在部署混合動力系統以減少柴油消耗,而南非電力公司正在核准私人微電網,以緩解長期計劃性停電問題。
其他好處:
- Excel格式的市場預測(ME)表
- 3個月的分析師支持
目錄
第1章:引言
- 研究假設和市場定義
- 調查範圍
第2章:調查方法
第3章執行摘要
第4章 市場狀況
- 市場概覽
- 市場促進因素
- 加速非洲和南亞農村電氣化進程
- IT/OT 的融合正在推動北美地區先進微電網控制器的普及。
- 用於加勒比海島嶼災害復原的模組化「箱式」微電網
- 美國和澳洲的公共產業主導的社區韌性計劃
- 併網逆變器將使北歐市場可再生能源的佔有率提高到 90% 以上。
- 國防部資助的淨零排放基地將推進混合微電網建設(北約和印太司令部)
- 市場限制因素
- 美國各州的監理規定不統一,導致互聯互通的核准延誤。
- 印度PM-KUSUM計畫的補助償還風險
- 鋰離子電池價格波動擾亂了 2024-2025 會計年度的資本投資計畫。
- 多供應商專案中缺乏網路安全標準
- 供應鏈分析
- 監理趨勢(目標、政策)
- 技術展望
- 波特五力模型
- 供應商的議價能力
- 買方的議價能力
- 新進入者的威脅
- 替代品的威脅
- 競爭公司之間的競爭
第5章 市場規模與成長預測
- 連結性別
- 併網微電網
- 獨立/隔離式微電網
- 報價
- 硬體(發電機、能源儲存系統、電源轉換器/逆變器和控制器)
- 軟體(能源管理平台和微電網控制器)
- 服務(工程、採購和施工 (EPC)、營運和維護 (O&M)、諮詢和顧問)
- 透過電源
- 太陽能發電(PV)
- 熱電聯產(天然氣)
- 柴油發電機
- 風力
- 燃料電池
- 其他(生質能、水力發電)
- 按類型
- 交流微電網
- 直流微電網
- 混合交流/直流微電網
- 額定功率
- 小於1兆瓦
- 1~5 MW
- 5~10 MW
- 10兆瓦或以上
- 最終用戶
- 公共產業
- 商業和工業用途
- 住宅
- 按地區
- 北美洲
- 美國
- 加拿大
- 墨西哥
- 歐洲
- 英國
- 德國
- 法國
- 西班牙
- 北歐國家
- 俄羅斯
- 其他歐洲地區
- 亞太地區
- 中國
- 印度
- 日本
- 韓國
- 東南亞國協
- 亞太其他地區
- 南美洲
- 巴西
- 阿根廷
- 哥倫比亞
- 南美洲其他地區
- 中東和非洲
- 阿拉伯聯合大公國
- 沙烏地阿拉伯
- 南非
- 埃及
- 其他中東和非洲地區
- 北美洲
第6章 競爭情勢
- 市場集中度
- 策略性舉措(併購、合作、購電協議)
- 市場佔有率分析(主要公司的市場排名和佔有率)
- 公司簡介
- ABB Ltd
- Siemens AG
- Schneider Electric SE
- General Electric Company
- Hitachi Energy Ltd
- Eaton Corporation PLC
- Honeywell International Inc.
- Toshiba Corporation
- S&C Electric Company
- ENGIE EPS SA
- Standard Microgrid Inc.
- PowerSecure Inc.
- Bloom Energy Corporation
- Caterpillar Inc.
- Wartsila Corporation
- Rolls-Royce Power Systems AG(MTU)
- Ameresco Inc.
- Tesla Inc.
- Enphase Energy Inc.
- Heila Technologies
- Spirae LLC
- Xendee Corporation
- HOMER Energy LLC
- AutoGrid Systems
第7章 市場機會與未來展望
The Microgrid Market size is expected to grow from USD 20.54 billion in 2025 to USD 24.44 billion in 2026 and is forecast to reach USD 54.99 billion by 2031 at 17.61% CAGR over 2026-2031.
Behind that growth are falling inverter and battery costs, grid-forming technology that lets renewable penetration exceed 90%, and policy mandates that now tie resilience directly to regulated returns. Utility pilots are scaling into full feeder-level projects, military bases are racing toward net-zero targets, and software has become the margin engine even as hardware commoditizes. Growing wildfire liabilities in the western United States, diesel logistics in island nations, and the need for black-start capability at data centers all reinforce the business case for distributed, self-sufficient power systems. Together, these forces continue to shift project finance away from grant-driven pilots toward structured, performance-based contracts.
Global Microgrid Market Trends and Insights
Accelerated Rural Electrification in Africa & South Asia
World Bank data show 8,700 mini-grids serving 4.1 million people were installed in 34 African nations between 2020 and 2024, yet 600 million residents still lack reliable electricity; this unmet demand represents a USD 42 billion investment gap through 2030 in the microgrid market.[1] The International Finance Corporation mobilized USD 500 million of blended finance between 2024 and 2025, cutting developer capital costs in Nigeria and Kenya by six percentage points. India's Ministry of New and Renewable Energy budgeted INR 34.4 billion (USD 413 million) for 2024-2025 to solarize 200,000 agricultural pumps, displacing 1.2 billion liters of diesel annually. Bangladesh's Infrastructure Development Company Limited funded 1,850 additional solar mini-grids in 2024, while the Asian Development Bank committed USD 1.1 billion in 2025 to hybrid systems across South and Southeast Asia. Together, these initiatives narrow the cost of capital and shorten build cycles for off-grid microgrids that substitute costly diesel fuel.
IT/OT Convergence Spurs Advanced Microgrid Controllers in North America
The National Electrical Manufacturers Association published the US 80056-2024 standard, creating a common data model for bidirectional exchange between operational technology devices and enterprise IT systems supporting the microgrid market. As a result, microgrid controllers now integrate weather forecasts, wholesale price signals, and building-management inputs to optimize dispatch every 15 minutes. Schneider Electric's EcoStruxure Microgrid Advisor cut peak-demand charges by 23% across 47 U.S. sites by mid-2025, while ABB's Ability Energy Manager links directly with enterprise resource-planning suites to automate demand-response bids in PJM's capacity market. Cybersecurity, however, remains uneven: a 2024 National Institute of Standards and Technology audit found unified authentication missing in 62% of surveyed projects. Standardization accelerates controller roll-outs yet raises the bar for compliance.
Fragmented Codes Stalling Inter-connection Approvals in U.S. States
FERC Order 2023 streamlined generator queues, yet state-level processes still diverge in the microgrid market: California's cluster studies cut median approval time to 18 months in 2024, while Texas's serial study left 142 GW waiting. New York now insists that microgrids above 5 MW provide synthetic inertia, delaying 23 projects totaling 87 MW. Florida imposed a one-year moratorium on new applications in August 2024, freezing USD 1.2 billion of planned investment. Until state codes align, developers will hedge by favoring behind-the-meter systems or markets with clearer rules.
Other drivers and restraints analyzed in the detailed report include:
- Modular "Box" Microgrids for Disaster-Recovery in Caribbean Islands
- Utility-led Community Resilience Programs in U.S. & Australia
- Subsidy Claw-Back Risk in India's PM-KUSUM Programme
For complete list of drivers and restraints, kindly check the Table Of Contents.
Segment Analysis
Grid-connected configurations held 62.3% of 2025 deployments, providing utilities with non-wire alternatives to costly transmission upgrades while offering ancillary-service revenue across the microgrid market. Off-grid systems remain the lifeline for 733 million people without reliable electricity, largely in sub-Saharan Africa and South Asia. Off-grid assets deliver higher internal rates of return where diesel costs exceed USD 1.40 per liter and transmission tariffs approach USD 0.04 per kWh. For grid-tied projects, capacity-market participation, for example, PJM's USD 269.92 per MW-day clearing price, adds an extra income stream that lifts payback.
Hybrid connectivity now sits between the two models in the microgrid market. Puerto Rico mandates automatic transfer switching for microgrids above 5 MW, while California's updated Rule 21 requires smart inverters that ride through voltage and frequency disturbances. Satellite backhaul, often via Starlink, is lowering maintenance costs by enabling remote diagnostics at hundreds of African sites. Across all geographies, islanding capability is shifting from an optional feature to a project requirement.
Hardware still represented 63.3% of microgrid market revenue in 2025, yet lithium-ion batteries and PV modules both keep falling in price, compressing integrator margins. Software, by contrast, now earns 25% to 35% gross margins and is projected to expand at a 22.3% CAGR. Machine-learning dispatch can lift revenue by optimizing charge-discharge cycles against 15-minute wholesale prices and demand-charge windows. As-a-service contracts have emerged: Engie retains asset ownership and sells power below the grid tariff, lowering customer capex. Performance-based operations agreements with availability guarantees above 98% are now standard on public-sector procurements.
The Microgrid Market Report is Segmented by Connectivity (Grid-Connected and Off-Grid), Offering (Hardware, Software, and Services), Power Sources (Solar Photovoltaic, Combined Heat and Power, Fuel Cells, and More), Type (AC Microgrids, DC Microgrids, and More), Power Rating (Up To 1 MW, 1 To 5 MW, and More), End-User (Utilities, Commercial and Industrial, and Residential), and Geography (North America, Asia-Pacific, and More).
Geography Analysis
North America held 38.6% of installations in 2025, supported by a USD 1.8 billion incentive outlay in California and Department of Defense mandates for net-zero bases. Canada financed 18 Indigenous-led microgrids between 2024 and 2025, and Mexico's reopened distributed-generation market sparked 67 MW of industrial projects. State-level code fragmentation remains the leading bottleneck south of the border.
Asia-Pacific is the fastest-growing region at a 23.7% CAGR through 2031. India's PM-KUSUM solarizes agricultural pumps at scale, Japan enforces post-Fukushima resilience standards, and China's 14th Five-Year Plan targets 50 GW of distributed solar in frontier provinces. Southeast Asian islands substitute costly diesel imports with solar-battery systems, while Australia's neighborhood battery initiatives marry wildfire mitigation with community storage.
Europe, with 22% market share in 2025, pioneers grid-forming technology: Finland's 90 MW battery provides synthetic inertia, and Sweden has awarded a 200 MW project. Incentives in the United Kingdom and Spain accelerate community batteries on islands and weak grids. Cybersecurity directives under NIS2 raise compliance costs but improve operator readiness.
South America and the Middle East & Africa together account for 18% of installations, yet post near-20% growth. Brazil leverages biomass feedstock, Argentina revives RenovAr, and Colombia maps 340 off-grid communities. In the Gulf, oil companies deploy hybrid systems to cut diesel burn, while South Africa's utilities approve private microgrids to offset chronic load-shedding.
- ABB Ltd
- Siemens AG
- Schneider Electric SE
- General Electric Company
- Hitachi Energy Ltd
- Eaton Corporation PLC
- Honeywell International Inc.
- Toshiba Corporation
- S&C Electric Company
- ENGIE EPS SA
- Standard Microgrid Inc.
- PowerSecure Inc.
- Bloom Energy Corporation
- Caterpillar Inc.
- Wartsila Corporation
- Rolls-Royce Power Systems AG (MTU)
- Ameresco Inc.
- Tesla Inc.
- Enphase Energy Inc.
- Heila Technologies
- Spirae LLC
- Xendee Corporation
- HOMER Energy LLC
- AutoGrid Systems
Additional Benefits:
- The market estimate (ME) sheet in Excel format
- 3 months of analyst support
TABLE OF CONTENTS
1 Introduction
- 1.1 Study Assumptions & Market Definition
- 1.2 Scope of the Study
2 Research Methodology
3 Executive Summary
4 Market Landscape
- 4.1 Market Overview
- 4.2 Market Drivers
- 4.2.1 Accelerated Rural Electrification in Africa & South Asia
- 4.2.2 IT/OT Convergence Spurs Advanced Microgrid Controllers in North America
- 4.2.3 Modular "Box" Microgrids for Disaster-Recovery in Caribbean Islands
- 4.2.4 Utility-led Community Resilience Programs in U.S. & Australia
- 4.2.5 Grid-Forming Inverters Enabling 90%+ Renewables in Nordic Markets
- 4.2.6 Defense-Funded Net-Zero Bases Driving Hybrid Microgrids (NATO & INDOPACOM)
- 4.3 Market Restraints
- 4.3.1 Fragmented Codes Stalling Inter-connection Approvals in U.S. States
- 4.3.2 Subsidy Claw-Back Risk in India's PM-KUSUM Programme
- 4.3.3 Lithium-ion Price Volatility Disrupting CAPEX Planning 2024-25
- 4.3.4 Limited Cyber-security Standards for Multi-Vendor Projects
- 4.4 Supply-Chain Analysis
- 4.5 Regulatory Outlook (Targets, Policies)
- 4.6 Technological Outlook
- 4.7 Porter's Five Forces
- 4.7.1 Bargaining Power of Suppliers
- 4.7.2 Bargaining Power of Buyers
- 4.7.3 Threat of New Entrants
- 4.7.4 Threat of Substitutes
- 4.7.5 Intensity of Competitive Rivalry
5 Market Size & Growth Forecasts
- 5.1 By Connectivity
- 5.1.1 Grid-Connected Microgrids
- 5.1.2 Off-Grid/Islanded Microgrids
- 5.2 By Offering
- 5.2.1 Hardware (Power Generators, Energy-Storage Systems, Power Converters & Inverters, and Controllers)
- 5.2.2 Software (Energy Management Platforms, and Microgrid Controllers)
- 5.2.3 Services (Engineering, Procurement & Construction (EPC), Operations & Maintenance (O&M), and Consulting & Advisory)
- 5.3 By Power Source
- 5.3.1 Solar Photovoltaic (PV)
- 5.3.2 Combined Heat and Power (Natural Gas)
- 5.3.3 Diesel Generators
- 5.3.4 Wind
- 5.3.5 Fuel Cells
- 5.3.6 Others (Biomass, Hydro)
- 5.4 By Type
- 5.4.1 AC Microgrids
- 5.4.2 DC Microgrids
- 5.4.3 Hybrid AC/DC Microgrids
- 5.5 By Power Rating
- 5.5.1 Below 1 MW
- 5.5.2 1 to 5 MW
- 5.5.3 5 to 10 MW
- 5.5.4 Above 10 MW
- 5.6 By End-User
- 5.6.1 Utilities
- 5.6.2 Commercial and Industrial
- 5.6.3 Residential
- 5.7 By Geography
- 5.7.1 North America
- 5.7.1.1 United States
- 5.7.1.2 Canada
- 5.7.1.3 Mexico
- 5.7.2 Europe
- 5.7.2.1 United Kingdom
- 5.7.2.2 Germany
- 5.7.2.3 France
- 5.7.2.4 Spain
- 5.7.2.5 Nordic Countries
- 5.7.2.6 Russia
- 5.7.2.7 Rest of Europe
- 5.7.3 Asia-Pacific
- 5.7.3.1 China
- 5.7.3.2 India
- 5.7.3.3 Japan
- 5.7.3.4 South Korea
- 5.7.3.5 ASEAN Countries
- 5.7.3.6 Rest of Asia-Pacific
- 5.7.4 South America
- 5.7.4.1 Brazil
- 5.7.4.2 Argentina
- 5.7.4.3 Colombia
- 5.7.4.4 Rest of South America
- 5.7.5 Middle East and Africa
- 5.7.5.1 United Arab Emirates
- 5.7.5.2 Saudi Arabia
- 5.7.5.3 South Africa
- 5.7.5.4 Egypt
- 5.7.5.5 Rest of Middle East and Africa
- 5.7.1 North America
6 Competitive Landscape
- 6.1 Market Concentration
- 6.2 Strategic Moves (M&A, Partnerships, PPAs)
- 6.3 Market Share Analysis (Market Rank/Share for key companies)
- 6.4 Company Profiles (includes Global level Overview, Market level overview, Core Segments, Financials as available, Strategic Information, Products & Services, and Recent Developments)
- 6.4.1 ABB Ltd
- 6.4.2 Siemens AG
- 6.4.3 Schneider Electric SE
- 6.4.4 General Electric Company
- 6.4.5 Hitachi Energy Ltd
- 6.4.6 Eaton Corporation PLC
- 6.4.7 Honeywell International Inc.
- 6.4.8 Toshiba Corporation
- 6.4.9 S&C Electric Company
- 6.4.10 ENGIE EPS SA
- 6.4.11 Standard Microgrid Inc.
- 6.4.12 PowerSecure Inc.
- 6.4.13 Bloom Energy Corporation
- 6.4.14 Caterpillar Inc.
- 6.4.15 Wartsila Corporation
- 6.4.16 Rolls-Royce Power Systems AG (MTU)
- 6.4.17 Ameresco Inc.
- 6.4.18 Tesla Inc.
- 6.4.19 Enphase Energy Inc.
- 6.4.20 Heila Technologies
- 6.4.21 Spirae LLC
- 6.4.22 Xendee Corporation
- 6.4.23 HOMER Energy LLC
- 6.4.24 AutoGrid Systems
7 Market Opportunities & Future Outlook
- 7.1 White-space & Unmet-Need Assessment
 微電網市場-全球產業規模、佔有率、趨勢、機會、預測:按類型、消費模式、電源、終端用戶產業、地區、競爭格局分類,2021-2031年直流微電網市場-全球產業規模、佔有率、趨勢、機會與預測:依連接方式、電源、儲能設備、應用、地區、競爭格局分類,2021-2031年
 微電網市場分析及預測(至2035年):類型、服務、技術、組件、應用、部署、最終用戶、功能、解決方案
 微電網市場:按組件、技術、電源、額定輸出、所有權模式和應用分類-2026-2032年全球市場預測
 微電網市場分析:按能源來源、應用和地區分類(2026-2034 年)
 2026年全球並聯型安裝市場報告2026年全球微電網控制器軟體市場報告
 微電網市場(至 2035 年):依組件、電源、容量範圍、連接方式、技術、終端用戶產業和地區劃分:產業趨勢和全球預測
 2026-2030年全球微電網市場
 混合微電網市場機會、成長要素、產業趨勢分析及2026-2035年預測