


 |
市場調查報告書
商品編碼
2043976
南美洲數位電子看板:市場佔有率分析、產業趨勢與統計、成長預測(2026-2031 年)South America Digital Signage - Market Share Analysis, Industry Trends & Statistics, Growth Forecasts (2026 - 2031) |
||||||
※ 本網頁內容可能與最新版本有所差異。詳細情況請與我們聯繫。
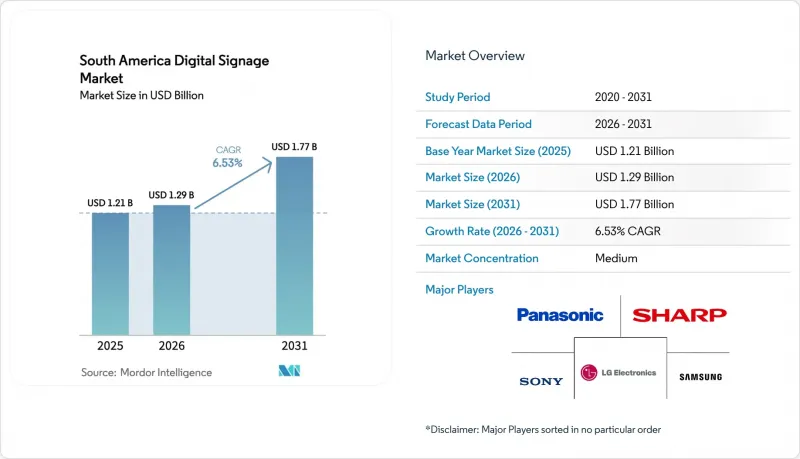
2025年南美數位電子看板市場價值12.1億美元,預計2031年將從2026年的12.9億美元成長到17.7億美元,預測期(2026-2031年)複合年成長率為6.53%。
零售媒體的普及、程式化戶外數位廣告交易以及智慧城市建設的投資,正在擴大連網螢幕在購物中心、交通樞紐和公共廣場的覆蓋範圍。儘管硬體在2025年仍將是最大的成本因素,但營運商正轉向透過數據驅動的內容輪播實現用戶付費的託管服務。面板價格的下降,尤其是大型LED面板的價格下降,降低了中型城市的進入門檻。同時,電子紙模組為亞馬遜盆地和安第斯山脈高地的獨立電網安裝創造了機會。監管方面的不確定性依然存在,但寬頻普及率的提高和5G的部署正在增強該地區即時競價和雲端內容管理的基礎。
南美數位電子看板市場趨勢與洞察
零售業現代化與全通路策略投資的增加
零售連鎖店正在貨架末端、收銀台和藥房櫃檯安裝連接螢幕,將店內促銷活動與行動應用程式和電商網站連接起來。預計到2024年,巴西零售媒體收入將成長42.3%,81%的受訪品牌計畫在2026年增加支出,因為螢幕正從提升品牌知名度的手段轉變為追蹤轉換率的效果行銷終端。利用會員數據,雜貨店可以提供即時優惠,而QR碼方便顧客在行動裝置上兌換獎勵。這項策略使Mercado Libre的「黑色星期五」銷售額較去年同期成長了80%。阿根廷的雜貨零售商正在採用類似的模式來抵消門市擴張成本,而智利的零售商則優先考慮高亮度室內顯示螢幕,以規避要求戶外螢幕夜間關閉的光污染法規。
快速消費品和通訊業。
日常消費品(FMCG) 和電信品牌正將其預算從靜態廣告看板轉向程序化數位戶外廣告 (DOOH),後者能夠實現受眾測量和靈活的定時購買。 2024 年 8 月,德高集團 (JCDecaux) 和 VIOOH 在聖保羅推出了街頭設施的程序化廣告投放服務,試點廣告客戶 InfinitePay 的案例表明,該服務在提升品牌認知度和網站流量方面均取得了顯著成效。 VIOOH 的研究表明,巴西新增 DOOH 廣告支出中有 87% 來自線上管道的轉移,而非傳統的戶外廣告形式。通訊業者正在利用交通樞紐的螢幕推廣 5G 套餐,並在通勤途中吸引乘客的注意力,而博彩平台等新興廣告主群體也進一步豐富了市場需求。儘管主要城市以外地區的覆蓋不足仍然是一個挑戰,但隨著 4G 和 5G 網路的日益普及,預計未來將能夠利用更廣泛的廣告空間。
較高的初始系統和整合成本
一套完整的電視牆,總合顯示器、媒體播放機、軟體許可和安裝費用在內,總成本可能超過25萬美元,這對小規模零售商和預算緊張的市政當局來說是一筆不小的負擔。阿根廷的貨幣波動推高了進口硬體的價格,導致買家推遲升級或選擇不支援程序化交易的低配置型號。雖然有以未來廣告收入換取延期付款的收益分成協議,但在巴西以外地區仍然不常見。
細分市場分析
到2025年,硬體將佔南美數位電子看板市場佔有率的57.37%,因為零售商和運輸公司已在面板、支架和佈線方面進行了投資。服務業預計將實現6.84%的複合年成長率,這反映了對內容調度、運作監控和程序化廣告銷售的需求,這些服務可以將固定贊助轉化為基於曝光量的收入。
該服務的快速成長顯示其模式正從資本投資轉向經常性營運成本模式。整合商將創新製作、數據分析和合規報告打包在一起,使一家在巴西、阿根廷和智利擁有200家門市的零售商能夠將複雜的技術工作外包出去。整合人工智慧的雲端平台,用於預測性維護和動態創新最佳化,現在採用訂閱模式,使供應商能夠轉向經常性收入來源。
到2025年,液晶顯示器和LED面板將佔據南美洲數位電子看板市場61.28%的佔有率。這些面板因其高亮度和尺寸範圍廣而備受青睞,適用於室內零售商店和戶外交通設施。儘管電子紙目前仍屬於小眾市場,但隨著太陽能模組的出現,亞馬遜河港口和安第斯山脈物流走廊的指示牌能夠持續可見,預計其市場佔有率將以7.44%的年成長率成長。
E Ink 的「Spectra 6」提供全彩刷新率,適用於電子貨架標籤和表;三星的 13 吋生物樹脂電子紙顯示器符合市政永續發展要求。 OLED 和 micro-LED 仍然是高成本選擇,僅限於高階零售商和企業旗艦店大廳;但隨著 DirectView LED 價格的下降,傳統投影系統的受歡迎程度正在降低。
其他好處:
- Excel格式的市場預測(ME)表
- 3個月的分析師支持
目錄
第1章:引言
- 市場分析與定義的前提條件
- 分析範圍
第2章 分析方法
第3章執行摘要
第4章 市場狀況
- 市場概覽
- 市場促進因素
- 零售業現代化與全通路策略投資的增加
- 在快速消費品和通訊業。
- 大型液晶/LED面板的資本投資減少
- 政府資助的智慧城市資訊亭開發
- 面向西班牙-葡萄牙市場的基於節目的戶外數位廣告交換平台。
- 適用於亞馬遜和安地斯地區物流的離網環境電子紙指示牌。
- 市場限制因素
- 較高的初始系統和整合成本
- 複雜的多供應商技術棧
- 各州地方政府許可證的規定各不相同
- 降低電力消耗,緩解農村地區電網不穩定問題。
- 產業供應鏈分析
- 監理情勢
- 技術展望
- 波特五力分析
- 供應商議價能力
- 買方的議價能力
- 新參與企業的威脅
- 替代品的威脅
- 競爭公司之間的競爭關係
- 對影響市場的宏觀經濟因素進行評估
第5章 市場規模與成長預測
- 按組件
- 硬體
- 軟體
- 服務
- 顯示技術
- LCD/LED
- OLED
- 投影螢幕
- 電子紙
- 其他顯示技術
- 按安裝位置
- 室內的
- 戶外的
- 按最終用戶行業分類
- 零售
- 交通/運輸
- 飯店及休閒
- 公司/銀行
- 政府與公共空間
- 教育和醫療保健
- 其他終端用戶產業
- 國家
- 巴西
- 阿根廷
- 秘魯
- 智利
- 南美洲其他地區
第6章 競爭情勢
- 市場集中度
- 策略趨勢
- 市佔率分析
- 公司簡介
- LG Electronics Inc.
- Samsung Electronics Co., Ltd.
- Panasonic Holdings Corporation
- Sony Group Corporation
- Sharp Corporation
- NEC Display Solutions, Ltd.
- Mitsubishi Electric Corporation
- Barco NV
- Broadsign International, LLC
- Scala, Inc.
- STRATACACHE, Inc.
- Planar Systems, Inc.
- Daktronics, Inc.
- Omnivex Corporation
- E Ink Holdings Inc.
- AU Optronics Corp.
- Leyard Optoelectronic Co., Ltd.
- Clear Channel Outdoor Holdings, Inc.
- Christie Digital Systems USA, Inc.
第7章 市場機會與未來展望
The South America digital signage market size was valued at USD 1.21 billion in 2025 and estimated to grow from USD 1.29 billion in 2026 to reach USD 1.77 billion by 2031, at a CAGR of 6.53% during the forecast period (2026-2031).
A confluence of retail-media adoption, programmatic digital-out-of-home (DOOH) trading, and smart-city investments is expanding the addressable base of networked screens across malls, transit hubs, and public plazas. Hardware remained the largest cost center in 2025, yet operators are pivoting toward managed services that monetize audiences through data-driven content rotation. Falling panel prices, especially for large-format LED, are lowering entry barriers for mid-tier municipalities, while e-paper modules open off-grid opportunities in the Amazon Basin and Andean highlands. Regulatory uncertainty persists, but rising broadband penetration and 5G rollout underpin the region's capacity for real-time bidding and cloud-based content management.
South America Digital Signage Market Trends and Insights
Retail Modernization and Omnichannel Investment Up-Trend
Retail chains are embedding connected screens into aisle ends, checkout lanes, and pharmacy counters to synchronize in-store promotions with mobile apps and e-commerce storefronts. Brazil's retail-media revenue grew 42.3% in 2024, and 81% of surveyed brands plan to boost spending in 2026 as screens shift from brand awareness assets to performance marketing endpoints that track conversions. Loyalty data allows grocers to serve real-time offers, while QR codes accelerate mobile redemption, a tactic that lifted Mercado Libre's Black Friday sales by 80% year over year. Argentina's grocery operators pursue similar models to offset store-expansion costs, and Chilean retailers now prioritize high-brightness indoor displays that circumvent a light-pollution ordinance mandating overnight shutdown of outdoor screens.
DOOH Adoption Surge among FMCG and Telecom Advertisers
Fast-moving consumer goods and telecom brands are reallocating budgets from static billboards to programmatic DOOH that supports audience measurement and flexible daypart buying. JCDecaux and VIOOH switched on programmatic access to Sao Paulo street furniture in August 2024, demonstrating uplift in both brand recall and website traffic for pilot advertiser InfinitePay. A VIOOH survey notes 87% of incremental DOOH spend in Brazil now migrates from online channels rather than legacy out-of-home formats. Telcos promoting 5G bundles leverage transit-hub screens to engage commuters at wait times, while new advertiser categories such as betting platforms add depth to demand. Coverage gaps outside tier-one cities remain a challenge, yet rising 4G and 5G penetration promises wider inventory activation.
High Upfront System and Integration Costs
End-to-end video-wall implementations can exceed USD 250,000 once displays, media players, software licenses, and installation labor are tallied, a barrier for small retailers and cost-constrained municipalities. Argentina's currency volatility inflates imported hardware prices, encouraging buyers to delay upgrades or settle for low-spec models that do not support programmatic trading. Revenue-sharing arrangements that defer payment against future ad proceeds exist but remain uncommon outside Brazil.
Other drivers and restraints analyzed in the detailed report include:
- Declining Capex of Large-Format LCD and LED Panels
- Government-Funded Smart-City Kiosk Roll-Outs
- Municipal Permitting Variability across Provinces
For complete list of drivers and restraints, kindly check the Table Of Contents.
Segment Analysis
Hardware retained 57.37% of the South America digital signage market share in 2025 as retailers and transit authorities invested in panels, mounts, and cabling. The services category is projected to deliver a 6.84% CAGR, reflecting demand for content scheduling, uptime monitoring, and programmatic ad sales that convert fixed sponsorships into impression-based revenue.
The services boom signals a shift from capital expenditure to recurring operating expenditure models. Integrators bundle creative production, data analytics, and compliance reporting so retailers spanning 200 stores across Brazil, Argentina, and Chile can outsource technical complexity. Cloud platforms that embed artificial intelligence for predictive maintenance and dynamic creative optimization carry subscription fees, moving vendors toward annuity revenue streams.
LCD and LED panels captured 61.28% of the South America digital signage market size in 2025, prized for brightness and a broad range of dimensions suited to indoor retail and outdoor transit assets. E-paper, although niche, will accelerate at 7.44% as solar-powered modules enable always-readable signage in Amazonian river ports and Andean logistics corridors.
E Ink's Spectra 6 achieves full-color refresh rates suitable for electronic shelf labels and bus-stop schedules, while Samsung's 13-inch bio-resin e-paper display aligns with municipal sustainability mandates. OLED and micro-LED remain high-cost options reserved for luxury retail and flagship corporate lobbies, whereas legacy projection systems decline as direct-view LED prices fall.
The South America Digital Signage Market Report is Segmented by Component (Hardware, Software, and Services), Display Technology (LCD/LED, OLED, Projection and Screens, E-Paper, and More), Installed Location (Indoor, and Outdoor), and End-User Industry (Retail, Transportation and Transit, Hospitality and Leisure, Corporate and Banking, Healthcare, and More) and Country. The Market Forecasts are Provided in Terms of Value (USD).
List of Companies Covered in this Report:
- LG Electronics Inc.
- Samsung Electronics Co., Ltd.
- Panasonic Holdings Corporation
- Sony Group Corporation
- Sharp Corporation
- NEC Display Solutions, Ltd.
- Mitsubishi Electric Corporation
- Barco NV
- Broadsign International, LLC
- Scala, Inc.
- STRATACACHE, Inc.
- Planar Systems, Inc.
- Daktronics, Inc.
- Omnivex Corporation
- E Ink Holdings Inc.
- AU Optronics Corp.
- Leyard Optoelectronic Co., Ltd.
- Clear Channel Outdoor Holdings, Inc.
- Christie Digital Systems USA, Inc.
Additional Benefits:
- The market estimate (ME) sheet in Excel format
- 3 months of analyst support
TABLE OF CONTENTS
1 INTRODUCTION
- 1.1 Study Assumptions and Market Definition
- 1.2 Scope of the Study
2 RESEARCH METHODOLOGY
3 EXECUTIVE SUMMARY
4 MARKET LANDSCAPE
- 4.1 Market Overview
- 4.2 Market Drivers
- 4.2.1 Retail Modernization and Omnichannel Investment Up-Trend
- 4.2.2 DOOH Adoption Surge among FMCG and Telecom Advertisers
- 4.2.3 Declining Capex of Large-Format LCD/LED Panels
- 4.2.4 Government-Funded Smart-City Kiosk Roll-Outs
- 4.2.5 Programmatic DOOH Exchanges Localized for ES-PT Markets
- 4.2.6 E-Paper Signage for Off-Grid Amazon and Andean Logistics
- 4.3 Market Restraints
- 4.3.1 High Upfront System and Integration Costs
- 4.3.2 Complex Multi-Vendor Technology Stack
- 4.3.3 Municipal Permitting Variability across Provinces
- 4.3.4 Power-Consumption Curbs, Grid Instability in Rural Zones
- 4.4 Industry Value Chain Analysis
- 4.5 Regulatory Landscape
- 4.6 Technological Outlook
- 4.7 Porter's Five Forces Analysis
- 4.7.1 Bargaining Power of Suppliers
- 4.7.2 Bargaining Power of Buyers
- 4.7.3 Threat of New Entrants
- 4.7.4 Threat of Substitutes
- 4.7.5 Intensity of Competitive Rivalry
- 4.8 Impact of Macroeconomic Factors on the Market
5 MARKET SIZE AND GROWTH FORECASTS (VALUE)
- 5.1 By Component
- 5.1.1 Hardware
- 5.1.2 Software
- 5.1.3 Services
- 5.2 By Display Technology
- 5.2.1 LCD / LED
- 5.2.2 OLED
- 5.2.3 Projection and Screens
- 5.2.4 E-Paper
- 5.2.5 Other Display Technologies
- 5.3 By Installation Location
- 5.3.1 Indoor
- 5.3.2 Outdoor
- 5.4 By End-User Industry
- 5.4.1 Retail
- 5.4.2 Transportation and Transit
- 5.4.3 Hospitality and Leisure
- 5.4.4 Corporate and Banking
- 5.4.5 Government and Public Spaces
- 5.4.6 Education and Healthcare
- 5.4.7 Other End-User Industries
- 5.5 By Country
- 5.5.1 Brazil
- 5.5.2 Argentina
- 5.5.3 Peru
- 5.5.4 Chile
- 5.5.5 Rest of South America
6 COMPETITIVE LANDSCAPE
- 6.1 Market Concentration
- 6.2 Strategic Moves
- 6.3 Market Share Analysis
- 6.4 Company Profiles (includes Global level Overview, Market level overview, Core Segments, Financials as available, Strategic Information, Market Rank/Share for key companies, Products and Services, and Recent Developments)
- 6.4.1 LG Electronics Inc.
- 6.4.2 Samsung Electronics Co., Ltd.
- 6.4.3 Panasonic Holdings Corporation
- 6.4.4 Sony Group Corporation
- 6.4.5 Sharp Corporation
- 6.4.6 NEC Display Solutions, Ltd.
- 6.4.7 Mitsubishi Electric Corporation
- 6.4.8 Barco NV
- 6.4.9 Broadsign International, LLC
- 6.4.10 Scala, Inc.
- 6.4.11 STRATACACHE, Inc.
- 6.4.12 Planar Systems, Inc.
- 6.4.13 Daktronics, Inc.
- 6.4.14 Omnivex Corporation
- 6.4.15 E Ink Holdings Inc.
- 6.4.16 AU Optronics Corp.
- 6.4.17 Leyard Optoelectronic Co., Ltd.
- 6.4.18 Clear Channel Outdoor Holdings, Inc.
- 6.4.19 Christie Digital Systems USA, Inc.
7 MARKET OPPORTUNITIES AND FUTURE OUTLOOK
- 7.1 White-Space and Unmet-Need Assessment
 智慧LED室內指示牌市場報告:螢幕大小、最終用戶和地區分類(2026-2034年)
 數位電子看板市場:2026-2032年全球市場預測(按組件、顯示技術、內容類型、解析度、螢幕大小、連接方式、應用、安裝位置和部署模式分類)
 2026-2030年全球商用大尺寸顯示指示牌市場LED指示牌市場:按應用程式、顯示類型、技術、安裝方式、像素間距和最終用戶分類-2026-2032年全球市場預測
 數位相機顯示器市場報告:趨勢、預測和競爭分析(至2035年)櫥窗數位電子看板市場報告:趨勢、預測及競爭分析(至2035年)
 全球數位電子看板市場規模、佔有率、趨勢和成長分析報告(2026-2034)
 數位電子看板市場:按類型、組件、技術、應用、安裝位置、內容類別、尺寸和地區分類
 美國數位電子看板市場規模、佔有率和趨勢分析報告:按類型、組件、技術、螢幕大小、解析度、內容類別、安裝位置、應用程式和細分市場預測(2026-2033 年)數位電子看板市場規模、佔有率和趨勢分析報告:按類型、組件、技術、螢幕大小、解析度、內容類別、安裝位置、應用、地區和細分市場預測(2026-2033 年)