


 |
市場調查報告書
商品編碼
2043972
暗纖:市場佔有率分析、產業趨勢與統計、成長預測(2026-2031)Dark Fiber - Market Share Analysis, Industry Trends & Statistics, Growth Forecasts (2026 - 2031) |
||||||
※ 本網頁內容可能與最新版本有所差異。詳細情況請與我們聯繫。
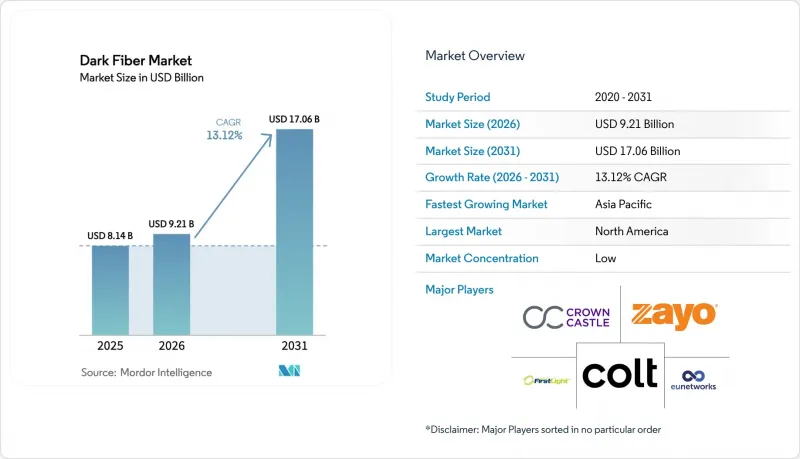
預計到 2026 年,暗纖市場規模將達到 92.1 億美元,高於 2025 年的 81.4 億美元,預計到 2031 年將達到 170.6 億美元。
預計 2026 年至 2031 年的複合年成長率為 13.12%。
在人工智慧 (AI) 工作負載、邊緣運算部署以及高密度 5G回程傳輸頻寬需求激增的推動下,暗纖市場正從租賃輕型服務模式轉向自有基礎設施模式。超大規模資料中心營運商現在更傾向於直接管理光纖線路,這給傳統上按光纖數量計費的營運商帶來了壓力。微型溝槽和架空鋪設等新型部署技術有助於克服都市區土地徵用限制,但同時,特種光纖的稀缺性也日益複雜。地域成長的重點正在轉向亞太地區,該地區各國主導雲端部署和全國性本地寬頻計畫正在加速基礎設施建設。雖然長途網路擴展對於區域間流量仍然至關重要,但隨著內容供應商探索跨洋的各種路徑,海底光纜也正在蓬勃發展。
全球暗纖市場趨勢與洞察
來自雲端和內容提供者的頻寬需求不斷成長
雲端超大規模資料中心業者已經跨越了光纖所有權比租賃更具成本效益的閾值,促使它們收購跨國線路。這導致亞馬遜在2024年新增了15,000英里的線路,微軟也新增了價值23億美元的光纖。內容傳遞網路現在要求在大都會圈實現亞毫秒延遲,從而推動了高密度環形拓撲結構的建設。然而,現有通訊業者難以透過傳統的定價模式實現這些網路的獲利。這種轉變正在將定價權轉移到中立的基礎設施專家手中,並擴大批發供應商的暗纖市場。
5G網路的廣泛應用需要高密度光纖回程傳輸。
每個 5G 基地台需要 10-25 Gbps 的吞吐量,是 4G 的 10 倍。光是 Verizon 一家公司就在其 2024 年的超寬頻部署中新增了 45,000 條光纖連接,投資額達 18 億美元,主要用於暗纖合約。歐盟的《Gigabit基礎設施法案》正在加速成員國類似的基礎建設。隨著線路密度不斷增加,超過了管道的供給能力,微型溝槽和電線杆安裝作為更具成本效益的替代方案正日益受到關注,從而維持了對暗纖的短期需求。
鋪設光纖電纜需要較高的初始資本投入。
目前標準建設成本為每英里線路1.5萬美元至5萬美元,主要原因是2024年設備和人事費用上漲了28%。市政債資金籌措專案停滯不前,40%的專案未能準時完成資金籌措,工期延誤超過18個月。超過七年的投資回收期阻礙了新進業者,並促使產業整合,這可能會縮小暗纖市場獨立供應商的潛在基本客群。
細分市場分析
到2025年,單模光纖將佔總銷售額的71.12%,並繼續成為長距離網路建置的基石。這主要歸功於其性能優勢,例如在數公里距離內訊號損耗極低,這也是單模光纖在暗纖市場保持領先地位的關鍵因素。隨著Terabit特級分波多工(WDM)技術的應用,單模光纖在骨幹網、城域網路和海底光纜專案中繼續發揮著至關重要的作用,滿足營運商在無需進行新的土木工程的情況下擴展容量的需求。隨著企業對繞過擁塞運作中網路的專用路由提出營運商級容錯需求,與單模光纖相關的暗纖市場正在進一步擴張。
雖然多模光纖目前僅限於300公尺以下的傳輸距離,但在資料中心和工廠環境中,其複合年成長率(CAGR)正以13.64%的速度快速成長。在這些環境中,更大的纖芯直徑簡化了安裝並降低了收發器成本。將單模和多模纖芯捆綁在一起的複合光纜如今已成為園區建設的主流,有助於客戶適應未來不斷變化的傳輸距離和頻寬需求。供應商正在推動OM5多模光纖的改進,使其支援短分波多工(SWDM),這有望將應用場景擴展到伺服器陣列連接之外。這種整合方案確保了管道的高效利用,並進一步強化了通訊業者對高纖芯數量的偏好,因為高纖芯數量允許在無需重新挖掘的情況下進行升級。
預計到2025年,長途基礎設施將佔總收入的51.76%,凸顯其在連接超大規模資料中心與國家交通樞紐方面發揮的關鍵作用。高盈利的城際線路每公里收入最高,從而維持了暗纖在該領域的市場佔有率。城域環網將這些容量連接到企業園區,而作為骨幹網,它確保了跨洲雲端服務和內容的不間斷交付。
隨著全球內容提供者共同出資建造新的海底光纜,以分散地緣政治風險並降低跨半球延遲,海底光纜系統預計將以13.73%的複合年成長率高速成長。新一代濕式光纜設計,目前採用24至48對光纖,透過將實體線路轉化為高密度批發庫存,正在擴大與海底光纜走廊相關的暗纖市場。同時,城域網路營運商正利用「一次鑽孔」策略,將陸地登陸點延伸至內陸,並建構結合陸地和海底的混合網狀網路,從而提升OTT和金融科技客戶的網路彈性。
區域分析
到2025年,北美將佔全球支出的39.21%,這主要得益於維吉尼亞、俄亥俄州和德克薩斯州超大規模資料中心叢集的發展,以及地方政府大力推動開放式接取網路建置。隨著營運商用光纖取代傳統銅線以滿足寬頻速度的最低監管要求,北美暗纖市場正在穩步擴張。此外,各州政府的補貼計畫也有助於緩解小規模,都市區擁擠問題也得到緩解。
在歐洲,Gigabit基礎設施法案推動了成長,該法案規定到2027年所有建築物都必須具備光纖接入能力。跨境互聯互通刺激了從法蘭克福到馬賽的新陸路線路以及通往愛爾蘭和葡萄牙的海底光纜的投資。該地區的資料主權法規推動了歐盟內部對多元化路由的需求,從而引發了資料中心營運商、金融機構和雲端服務經銷商之間暗纖市場合約的第二次繁榮。亞太地區以13.97%的複合年成長率位居榜首,這主要得益於中國430億美元的農村光纖補貼和印度87億美元的現代化計畫。東南亞國家正在推動自主雲端項目,包括開發從新加坡經馬來西亞到泰國的陸路走廊。同時,日本和韓國正在升級老舊的都市區管道,以增加光纖電纜的數量,從而適應邊緣運算的普及。在中東和非洲,各國正在製定國家寬頻計劃,優先考慮落地點和廣域走廊,但計畫資金籌措有時落後於政治目標。在南美洲,儘管宏觀經濟波動,巴西和阿根廷在提高光纖密度方面仍處於主導。
其他好處:
- Excel格式的市場預測(ME)表
- 3個月的分析師支持
目錄
第1章:引言
- 研究假設和市場定義
- 調查範圍
第2章:調查方法
第3章執行摘要
第4章 市場狀況
- 市場概覽
- 市場促進因素
- 來自雲端和內容提供者的頻寬需求不斷成長
- 5G 網路的廣泛應用需要高密度光纖回程傳輸。
- 資料中心互連的擴展
- 通訊業者從銅纜基礎設施向光纖基礎設施的過渡
- 地方政府推行的開放式暗纖舉措正在加速其所在地區的建設。
- 海底電纜分支單元數量的快速成長將使陸基暗纖成為可能。
- 市場限制因素
- 鋪設光纖電纜需要較高的初始資本投入。
- 複雜的土地徵用和授權程序
- 主要都會走廊光纖線路飽和度狀況
- 特種光纖和管道材料的供應鏈中斷
- 產業價值鏈分析
- 監理情勢
- 技術展望
- 波特五力分析
- 供應商的議價能力
- 買方的議價能力
- 新進入者的威脅
- 替代品的威脅
- 競爭公司之間的競爭
- 宏觀經濟因素的影響
第5章 市場規模與成長預測
- 依纖維類型
- 單模光纖
- 多模光纖
- 依網路類型
- 長途
- 大都會區
- 潛水艇
- 按最終用戶行業分類
- 電信和網際服務供應商
- 資料中心和雲端服務供應商
- 政府/國防
- 銀行、金融服務、保險
- 衛生保健
- 教育
- 製造業
- 能源與公共產業
- 透過使用
- 資料傳輸和通訊
- 企業網路
- 工業自動化
- 軍事/國防通訊
- 按地區
- 北美洲
- 美國
- 加拿大
- 墨西哥
- 歐洲
- 德國
- 英國
- 法國
- 俄羅斯
- 其他歐洲地區
- 亞太地區
- 中國
- 日本
- 印度
- 韓國
- 澳洲
- 亞太其他地區
- 南美洲
- 巴西
- 阿根廷
- 南美洲其他地區
- 中東和非洲
- 中東
- 沙烏地阿拉伯
- 阿拉伯聯合大公國
- 其他中東國家
- 非洲
- 南非
- 埃及
- 其他非洲地區
- 中東
- 北美洲
第6章 競爭情勢
- 市場集中度
- 策略趨勢
- 市佔率分析
- 公司簡介
- Zayo Group Holdings Inc.
- Crown Castle Fiber LLC
- Colt Technology Services Group Limited
- euNetworks Group Holdings Limited
- FirstLight Fiber Inc.
- GTT Communications Inc.
- Consolidated Communications Holdings Inc.
- Uniti Group Inc.
- FiberLight LLC
- EXA Infrastructure Topco Limited
- Segra Communications LLC
- Neos Networks Limited
- Hudson Fiber Network Inc.
- Arelion AB
- Tampnet AS
- RETN Limited
- Aqua Comms DAC
- Metro Optic Inc.
- Dark Fibre Africa(Pty)Ltd.
- GlobalConnect A/S
第7章 市場機會與未來展望
The dark fiber market size in 2026 is estimated at USD 9.21 billion, growing from 2025 value of USD 8.14 billion with 2031 projections showing USD 17.06 billion, growing at 13.12% CAGR over 2026-2031.
Fueled by the exponential bandwidth demands of artificial intelligence workloads, edge computing rollouts, and dense 5G backhaul, the dark fiber market is transitioning from leased lit services to owned infrastructure models. Hyperscale data center operators now favor direct control over fiber routes, pressuring incumbent telecom carriers that historically monetized capacity by the strand. Emerging deployment techniques, such as micro-trenching and aerial placement, help navigate urban right-of-way constraints, even as specialty fiber shortages add complexity. Geographic growth is pivoting toward the Asia-Pacific region, where sovereign cloud mandates and nationwide rural broadband programs are accelerating build-outs. Long-haul expansions remain essential for inter-regional traffic flows, but submarine routes are gaining momentum as content providers scramble for diverse paths across oceans.
Global Dark Fiber Market Trends and Insights
Growing Bandwidth Demand From Cloud And Content Providers
Cloud hyperscalers crossed the utilization threshold where owning strands is cheaper than leasing, prompting multi-country route acquisitions that added 15,000 route-miles to Amazon and USD 2.3 billion in new fiber to Microsoft in 2024. Content delivery networks now require sub-10 millisecond latency in metropolitan areas, leading to dense ring topologies that incumbent carriers struggle to monetize under legacy pricing models. The shift transfers pricing power to neutral infrastructure specialists and enlarges the addressable dark fiber market for wholesale providers.
Rising Adoption Of 5G Networks Requiring Dense Fiber Backhaul
Each 5G cell site demands 10-25 Gbps throughput, a tenfold jump from 4G. Verizon alone added 45,000 new fiber connections during its 2024 Ultra Wideband rollout, investing USD 1.8 billion primarily in dark fiber contracts. The European Union's Gigabit Infrastructure Act accelerates similar builds across member states. Densification outpaces conduit availability, elevating micro-trenching and pole attachments as cost-efficient alternatives and sustaining the near-term demand for dark fiber.
High Initial Capital Expenditure For Fiber Laying
Typical construction now costs USD 15,000-50,000 per route mile, inflated by a 28% rise in equipment and labor costs in 2024. Bond-funded municipal plans stalled, with 40% of projects missing financing milestones and slip dates extending beyond 18 months. Seven-plus-year returns deter new entrants and incite consolidation trends that may temper the addressable base of independent providers in the dark fiber market.
Other drivers and restraints analyzed in the detailed report include:
- Increasing Data Center Interconnect Deployments
- Telecom Operators' Shift From Copper To Fiber Infrastructure
- Complex Right-Of-Way And Permitting Procedures
For complete list of drivers and restraints, kindly check the Table Of Contents.
Segment Analysis
Single-mode fiber captured 71.12% of 2025 revenue and remains the anchor for long-distance builds, thanks to minimal signal loss over multi-kilometer spans, a performance edge that protects the dark fiber market share leadership of this strand type. Terabit-class wavelength division multiplexing keeps single-mode relevant for backbone, metropolitan, and submarine projects where operators need room to scale capacity without undertaking new civil works. The dark fiber market size tied to single-mode strands expands further as enterprises demand carrier-grade resilience on private routes that bypass congested lit networks.
Multimode fiber, although limited to sub-300-meter reaches, is experiencing an acceleration of 13.64% CAGR in data center and factory environments, where wider cores simplify installation and reduce transceiver costs. Composite cables bundling single-mode and multimode cores now dominate campus builds, allowing customers to future-proof against shifting distance and bandwidth needs. Vendors are pushing OM5 multimode enhancements that support short-wave division multiplexing, a step that could stretch use cases beyond server-row connections. The combined approach secures duct utilization efficiency, reinforcing operator preference for higher core counts that preserve upgrade headroom without repeat trenching.
Long-haul infrastructure accounted for 51.76% of 2025 revenue, underscoring its pivotal role in linking hyperscale data centers and national traffic hubs. Lucrative intercity routes command the highest revenue per strand kilometer and protect the segment's dark fiber market share. Metro rings terminate this capacity into enterprise districts, but it is the backbone span that ensures uninterrupted cloud and content delivery across continents.
Submarine systems are projected to post the fastest 13.73% CAGR as global content providers co-fund new cables that diversify geopolitical exposure and reduce latency between hemispheres. Next-generation wet plant designs now ship with 24 to 48 fiber pairs, converting physical routes into dense wholesale inventories that expand the dark fiber market size associated with subsea corridors. Meanwhile, metro operators exploit "dig-once" policies to extend landings inland, stitching together hybrid terrestrial-subsea meshes that raise resiliency benchmarks for OTT and fintech customers.
The Dark Fiber Market Report is Segmented by Fiber Type (Singlemode Fiber, and Multimode Fiber), Network Type (Long-Haul, Metro, and Submarine), End User Industry (Government and Defense, Banking Financial Services and Insurance, Education, Manufacturing, Energy and Utilities, and More), Application (Enterprise Networking, Industrial Automation, and More), and Geography. The Market Forecasts are Provided in Terms of Value (USD).
Geography Analysis
North America accounted for 39.21% of 2025 spending, driven by hyperscale data center clusters in Virginia, Ohio, and Texas, as well as a wave of municipal open-access builds. The dark fiber market size in North America is growing steadily as operators exchange legacy copper for fiber to meet regulatory minimums on broadband speeds, while state-level subsidy programs help offset the economic challenges faced by smaller carriers in rural areas. Urban congestion challenges are being mitigated as cities streamline multi-agency permitting into one-touch processes, thereby progressively reducing build timelines.
Europe supports growth through the Gigabit Infrastructure Act, which mandates that buildings be fiber-ready by 2027. Cross-border connectivity stimulates investments in new terrestrial corridors, extending from Frankfurt to Marseille, and submarine entries into Ireland and Portugal. The region's data sovereignty rules are driving demand for intra-EU routing diversity, resulting in a second-tier boom in dark fiber market contracting among data center operators, financial firms, and cloud resellers. Asia-Pacific posts the fastest 13.97% CAGR thanks to China's USD 43 billion rural fiber subsidy and India's USD 8.7 billion modernization program. Southeast Asian nations are pursuing sovereign cloud projects, which involve establishing terrestrial corridors from Singapore through Malaysia into Thailand. Meanwhile, Japan and South Korea are upgrading their aging metro ducts with higher fiber counts to meet the proliferation of edge computing. The Middle East and Africa witness national broadband agendas that prioritize landing points and pan-regional corridors, although project finance can lag behind political ambition. South America is led by Brazil and Argentina in spearheading fiber densification, despite macroeconomic volatility.
- Zayo Group Holdings Inc.
- Crown Castle Fiber LLC
- Colt Technology Services Group Limited
- euNetworks Group Holdings Limited
- FirstLight Fiber Inc.
- GTT Communications Inc.
- Consolidated Communications Holdings Inc.
- Uniti Group Inc.
- FiberLight LLC
- EXA Infrastructure Topco Limited
- Segra Communications LLC
- Neos Networks Limited
- Hudson Fiber Network Inc.
- Arelion AB
- Tampnet AS
- RETN Limited
- Aqua Comms DAC
- Metro Optic Inc.
- Dark Fibre Africa (Pty) Ltd.
- GlobalConnect A/S
Additional Benefits:
- The market estimate (ME) sheet in Excel format
- 3 months of analyst support
TABLE OF CONTENTS
1 INTRODUCTION
- 1.1 Study Assumptions and Market Definition
- 1.2 Scope of the Study
2 RESEARCH METHODOLOGY
3 EXECUTIVE SUMMARY
4 MARKET LANDSCAPE
- 4.1 Market Overview
- 4.2 Market Drivers
- 4.2.1 Growing Bandwidth Demand from Cloud and Content Providers
- 4.2.2 Rising Adoption of 5G Networks Requiring Dense Fiber Backhaul
- 4.2.3 Increasing Data Center Interconnect Deployments
- 4.2.4 Telecom Operators' Shift from Copper to Fiber Infrastructure
- 4.2.5 Municipal Open-Access Dark Fiber Initiatives Accelerating Local Builds
- 4.2.6 Surging Subsea Cable Branching Units Enabling Terrestrial Landing Dark Fiber
- 4.3 Market Restraints
- 4.3.1 High Initial Capital Expenditure for Fiber Laying
- 4.3.2 Complex Right-of-Way and Permitting Procedures
- 4.3.3 Fiber Route Saturation in Tier-1 Metro Corridors
- 4.3.4 Supply Chain Disruptions for Specialty Fiber and Duct Materials
- 4.4 Industry Value Chain Analysis
- 4.5 Regulatory Landscape
- 4.6 Technological Outlook
- 4.7 Porter's Five Forces Analysis
- 4.7.1 Bargaining Power of Suppliers
- 4.7.2 Bargaining Power of Buyers
- 4.7.3 Threat of New Entrants
- 4.7.4 Threat of Substitutes
- 4.7.5 Intensity of Competitive Rivalry
- 4.8 Impact of Macroeconomic Factors
5 MARKET SIZE AND GROWTH FORECASTS (VALUE)
- 5.1 By Fiber Type
- 5.1.1 Singlemode Fiber
- 5.1.2 Multimode Fiber
- 5.2 By Network Type
- 5.2.1 Long-Haul
- 5.2.2 Metro
- 5.2.3 Submarine
- 5.3 By End User Industry
- 5.3.1 Telecom and Internet Service Providers
- 5.3.2 Data Centers and Cloud Providers
- 5.3.3 Government and Defense
- 5.3.4 Banking, Financial Services and Insurance
- 5.3.5 Healthcare
- 5.3.6 Education
- 5.3.7 Manufacturing
- 5.3.8 Energy and Utilities
- 5.4 By Application
- 5.4.1 Data Transmission and Telecommunication
- 5.4.2 Enterprise Networking
- 5.4.3 Industrial Automation
- 5.4.4 Military and Defense Communications
- 5.5 By Geography
- 5.5.1 North America
- 5.5.1.1 United States
- 5.5.1.2 Canada
- 5.5.1.3 Mexico
- 5.5.2 Europe
- 5.5.2.1 Germany
- 5.5.2.2 United Kingdom
- 5.5.2.3 France
- 5.5.2.4 Russia
- 5.5.2.5 Rest of Europe
- 5.5.3 Asia-Pacific
- 5.5.3.1 China
- 5.5.3.2 Japan
- 5.5.3.3 India
- 5.5.3.4 South Korea
- 5.5.3.5 Australia
- 5.5.3.6 Rest of Asia-Pacific
- 5.5.4 South America
- 5.5.4.1 Brazil
- 5.5.4.2 Argentina
- 5.5.4.3 Rest of South America
- 5.5.5 Middle East and Africa
- 5.5.5.1 Middle East
- 5.5.5.1.1 Saudi Arabia
- 5.5.5.1.2 United Arab Emirates
- 5.5.5.1.3 Rest of Middle East
- 5.5.5.2 Africa
- 5.5.5.2.1 South Africa
- 5.5.5.2.2 Egypt
- 5.5.5.2.3 Rest of Africa
- 5.5.5.1 Middle East
- 5.5.1 North America
6 COMPETITIVE LANDSCAPE
- 6.1 Market Concentration
- 6.2 Strategic Moves
- 6.3 Market Share Analysis
- 6.4 Company Profiles (includes Global Level Overview, Market Level Overview, Core Segments, Financials as available, Strategic Information, Market Rank/Share for Key Companies, Products and Services, and Recent Developments)
- 6.4.1 Zayo Group Holdings Inc.
- 6.4.2 Crown Castle Fiber LLC
- 6.4.3 Colt Technology Services Group Limited
- 6.4.4 euNetworks Group Holdings Limited
- 6.4.5 FirstLight Fiber Inc.
- 6.4.6 GTT Communications Inc.
- 6.4.7 Consolidated Communications Holdings Inc.
- 6.4.8 Uniti Group Inc.
- 6.4.9 FiberLight LLC
- 6.4.10 EXA Infrastructure Topco Limited
- 6.4.11 Segra Communications LLC
- 6.4.12 Neos Networks Limited
- 6.4.13 Hudson Fiber Network Inc.
- 6.4.14 Arelion AB
- 6.4.15 Tampnet AS
- 6.4.16 RETN Limited
- 6.4.17 Aqua Comms DAC
- 6.4.18 Metro Optic Inc.
- 6.4.19 Dark Fibre Africa (Pty) Ltd.
- 6.4.20 GlobalConnect A/S
7 MARKET OPPORTUNITIES AND FUTURE OUTLOOK
- 7.1 White-Space and Unmet-Need Assessment
 暗纖市場:按光纖類型、網路類型、最終用戶產業和地區分類
 暗纖市場:2026-2032年全球市場預測(依光纖類型、材料、網路類型、部署模式、企業規模及最終用戶產業分類)
 全球暗纖市場規模、佔有率、趨勢和成長分析報告(2026-2034)全球暗光纖市場:市場規模、佔有率、成長率、產業分析、依類型、應用和地區劃分的分析以及未來預測(2026-2034)
 全球暗纖市場,2026-2030年
 暗光纖市場-全球產業規模、佔有率、趨勢、機會及預測(依光纖類型、網路類型、材料、最終用戶、地區及競爭格局分類,2021-2031年預測)
 暗纖市場規模、佔有率及成長分析(依垂直產業、網路、應用及地區分類)-2026-2033年產業預測
 2030 年暗纖市場預測:按類型、網路類型、材料、應用和地區進行全球分析
 全球暗纖市場
 暗光纖市場 - 2024-2034 年全球產業分析、規模、佔有率、成長、趨勢與預測