


 |
市場調查報告書
商品編碼
2043883
東協硫磺市場:市場佔有率分析、產業趨勢與統計、成長預測(2026-2031)ASEAN Sulfur - Market Share Analysis, Industry Trends & Statistics, Growth Forecasts (2026 - 2031) |
||||||
※ 本網頁內容可能與最新版本有所差異。詳細情況請與我們聯繫。
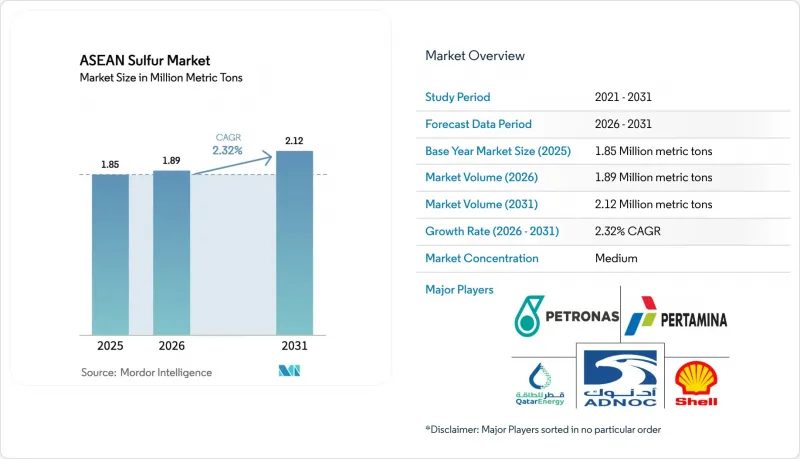
預計東協硫磺市場將從 2025 年的 185 萬噸成長到 2026 年的 189 萬噸,然後從 2026 年到 2031 年以 2.32% 的複合年成長率成長,到 2031 年達到 212 萬噸。
印尼鎳高壓酸浸計畫數量的增加、中東供應路線的限制以及煉廠日益嚴格的脫硫標準,正在改變貿易流向,並凸顯自產酸能力的戰略價值。儘管中東出口商仍然主導海運,但印尼鎳生產商和區域煉廠的垂直整合正在增強國內供應,並降低對進口的依賴。此外,越南磷酸鹽肥料產量的擴大和泰國對硫酸銨的穩定需求,支撐了農業部門的穩定消費。這些因素共同導致東協硫磺市場儘管整體需求成長有限,但仍有結構性供不應求。
東協硫磺市場的趨勢與洞察
東協水稻和油籽作物地區化肥需求復甦
受農作物價格上漲和政府補貼的推動,東南亞農民的化肥用量在2024年增加至550萬噸,政府補貼提高了化肥施用量。磷酸鹽產量的成長與東協硫磺市場直接相關,因為生產一噸磷酸鹽大約需要等量的硫磺。含硫量24%的硫酸銨仍將是水稻和油籽輪作的首選肥料,2024年在泰國的平均價格為每噸11139泰銖。越南的化肥消費量也在成長,湄公河三角洲的稻田佔國內需求的近40%。這種成長模式表明,局部硫磺短缺可能首先出現在新增磷酸鹽產能的地區,如果中東的物流中斷,價格波動可能會進一步加劇。東協硫磺市場對進口的依賴程度仍然很高,預計到2025年初,泰國24%的硫酸銨將來自沙烏地阿拉伯,這使得東協硫磺市場極易受到全球貨運價格波動的影響。
印尼和菲律賓的鎳基高壓酸浸計畫正在加速硫酸的需求。
印尼計劃在2025年將其採用混合氫氧化物沉澱法(MHP)的鎳產能擴大至85萬噸。高壓酸浸(HPAL)製程每生產一噸鎳約需11.8噸硫。因此,硫酸的需求量從2024年的517萬噸激增至2025年的712萬噸,增幅高達40%,對東協硫磺市場造成了顯著影響。目前,硫磺現貨價格已超過每噸5.30美元,約佔高壓酸浸製程營運成本的29%。為了應對這項挑戰,生產商正在安裝現場燃燒器以轉化元素硫,並減少對進口酸的依賴。 2024年,青山集團將其硫酸年產能提高了約500萬噸,而青山集團年產能66萬噸的生產設施運作,併計劃進一步增產100萬噸。這種垂直一體化正在將貿易流向從成品硫酸轉向元素硫,預計到 2025 年,印尼的硫磺進口量將達到 535 萬噸,年增 48%。
途經霍爾木茲海峽和紅海的中東補給路線不穩定
2024年3月霍爾木茲海峽的封鎖切斷了全球近一半的硫磺海運供應,而與衝突相關的附加費又使運費加倍。到2025年12月,印尼硫磺到岸價(CIF)飆升至每噸547美元,漲幅高達193%,嚴重影響了高壓酸熔煉(HPAL)的利潤率。此外,俄羅斯於2025年11月實施的出口禁令切斷了其他供應來源,而中國的價格上限政策則將國內硫磺從出口轉向國內市場。由於印尼約75%的硫磺進口來自海灣國家,每一次供應中斷都會造成價格溢價,影響東協硫磺市場,並刺激對自用燃燒設備計畫的進一步投資。
細分市場分析
預計到2025年,標準級硫磺將佔總產量的84.27%,並繼續保持其作為化肥、基礎化學品和鎳高壓酸浸製程關鍵原料的地位。受新加坡製藥業產量成長和馬來西亞電池材料初步測試的推動,高純度硫磺預計將以3.41%的複合年成長率成長至2031年。採用先進的克勞斯法或濕式酸浸製程的供應商,可透過有效利用廢氣,在不擴大原生礦開採產能的情況下提高盈利。
2024年,越南和泰國的橡膠產業在輪胎硫化方面消耗了約25萬噸不溶性硫磺。儘管原物料價格上漲了13%,但由於性能限制,過氧化物和輻射等替代硫化方法仍處於小眾市場。亞太地區佔全球不溶性硫磺消費量的55%,即使在經濟放緩時期也能確保穩定的需求。雖然高純度硫磺無法完全取代標準硫磺,但印尼按需燃燒硫磺的需求增加可能會導致橡膠加工商對標準硫磺的區域性供應短缺,從而可能支撐硫磺價格。
《東協硫磺市場報告》依純度(標準級:99.5%以上,高純度:99.9%以上)、終端用途產業(化肥、化工、金屬製造、橡膠加工及其他終端用途產業)及地區(馬來西亞、印尼、泰國、新加坡、菲律賓、越南及其他東南亞國協)進行細分。市場預測以噸為單位。
其他好處:
- Excel格式的市場預測(ME)表
- 3個月的分析師支持
目錄
第1章:引言
- 研究假設和市場定義
- 調查範圍
第2章:調查方法
第3章執行摘要
第4章 市場狀況
- 市場概覽
- 市場促進因素
- 東協稻米和油籽產區化肥需求復甦
- 印尼和菲律賓的鎳基高壓酸浸計畫正在加速硫酸的需求。
- 煉油廠更嚴格的脫硫標準正在促進當地社區的硫回收利用。
- 擴大越南和泰國的磷肥生產能力
- 低成本電網電池用硫基正極材料的研究與開發正在興起。
- 市場限制因素
- 經由霍爾木茲海峽和紅海通往中東的補給路線不穩定。
- 擴大無硫酸鹽磷酸鐵鋰電池化學技術的應用
- 東南亞國協對港口粉塵排放的嚴格規定增加了貨物處理成本。
- 價值鏈分析
- 波特五力模型
- 供應商的議價能力
- 消費者議價能力
- 新進入者的威脅
- 替代品的威脅
- 競爭程度
第5章 市場規模與成長預測
- 純度
- 標準等級(99.5%或更高)
- 高純度(99.9%或更高,用於藥品和電池)
- 按最終用戶行業分類
- 肥料
- 化學加工
- 金屬製造
- 橡膠加工
- 其他終端用戶產業
- 按地區
- 馬來西亞
- 印尼
- 泰國
- 新加坡
- 菲律賓
- 越南
- 其他東南亞國協
第6章 競爭情勢
- 市場集中度
- 策略趨勢
- 市佔率(%)/排名分析
- 公司簡介
- Abu Dhabi National Oil Company(ADNOC)
- China Petroleum & Chemical Corporation(SINOPEC)
- Enersul Ltd
- HJ Baker & Bro., LLC
- Indian Oil Corporation Ltd.
- Petroliam Nasional Berhad(PETRONAS)
- PETROVIETNAM CHEMICAL AND SERVICES CORPORATION(PVDMC)
- PT Candi Ngrimbi
- PT Pertamina(Persero)
- Qatar Petroleum for the Sale of Petroleum Products Company Limited
- QatarEnergy
- Saudi Aramco
- Shell plc
- Suncor Energy Inc.
- Yara International
第7章 市場機會與未來展望
The ASEAN Sulfur Market size is expected to grow from 1.85 Million metric tons in 2025 to 1.89 Million metric tons in 2026 and is forecast to reach 2.12 Million metric tons by 2031 at 2.32% CAGR over 2026-2031.
Indonesia's increase in nickel high-pressure acid leach projects, constrained Middle-East supply routes, and stricter refinery desulfurization standards are altering trade flows and emphasizing the strategic value of captive acid capacity. While Middle-East exporters continue to lead in seaborne deliveries, vertical integration by Indonesian nickel producers and regional refiners is reducing dependence on imports by strengthening domestic supply. Additionally, Vietnam's phosphate fertilizer expansions and Thailand's stable ammonium-sulfate demand are supporting consistent agricultural consumption. These factors collectively maintain the ASEAN sulfur market in a structural deficit, despite limited overall demand growth.
ASEAN Sulfur Market Trends and Insights
Fertilizer Demand Rebound Across ASEAN Rice and Oil-Seed Belts
Southeast Asian growers increased fertilizer usage to 5.5 million tons in 2024, driven by higher crop prices and government subsidies that boosted application rates. The production of one ton of phosphoric acid requires nearly the same weight of sulfur, directly linking increased phosphate output to the ASEAN sulfur market. Ammonium sulfate, which contains 24% sulfur, averaged THB 11,139 per ton in Thailand during 2024 and remained a preferred fertilizer for rice and oil-seed rotations. Vietnam's fertilizer consumption is growing, with the Mekong Delta's rice paddies accounting for nearly 40% of national demand. This growth pattern suggests localized sulfur shortages may emerge first in areas with new phosphate production capacity, exacerbating price volatility during disruptions in Middle Eastern logistics. Import dependency remains significant, with 24% of Thailand's ammonium sulfate sourced from Saudi Arabia in early 2025, leaving the ASEAN sulfur market vulnerable to global freight fluctuations.
Nickel-HPAL Projects in Indonesia and the Philippines Intensifying Sulfuric-Acid Pull
Indonesia increased mixed-hydroxide-precipitate (MHP) capacity to 850,000 tons of nickel in 2025, with each ton requiring approximately 11.8 tons of sulfur for HPAL (high-pressure acid leaching) processes. As a result, sulfuric acid demand surged from 5.17 million tons in 2024 to 7.12 million tons in 2025, marking a 40% increase that significantly impacted the ASEAN sulfur market. Sulfur now accounts for nearly 29% of HPAL operating costs when spot prices exceed USD 530 per ton. Producers have responded by installing on-site burners to convert elemental sulfur, reducing reliance on imported acid. In 2024, Tsingshan added approximately 5 million tons per year of new acid capacity, while QMB commissioned 660,000 tons per year, with an additional 1 million tons per year planned. This vertical integration is shifting trade flows from finished sulfuric acid to elemental sulfur, driving a 48% year-on-year increase in Indonesian sulfur imports to 5.35 million tons in 2025.
Volatile Middle-East Supply Routes Via Strait of Hormuz and Red Sea
The March 2024 closure of the Strait of Hormuz disrupted nearly half of global seaborne sulfur supply and caused freight costs to double due to conflict-related surcharges. By December 2025, Indonesia's CIF sulfur price had surged to USD 547 per ton, representing a 193% increase that significantly compressed HPAL margins. Furthermore, Russia's export ban in November 2025 removed an alternative supply source, while China's price-cap policy redirected domestic sulfur away from exports. With approximately 75% of Indonesian sulfur imports originating from the Gulf, each supply disruption adds price premiums, impacting the ASEAN sulfur market and encouraging further investment in captive-burner projects.
Other drivers and restraints analyzed in the detailed report include:
- Stricter Refinery Desulfurization Standards Boosting Regional Sulfur Recovery
- Expansion of Phosphate-Fertilizer Capacities in Vietnam and Thailand
- Growing Adoption of Sulfate-Free LiFePO4 Battery Chemistries
For complete list of drivers and restraints, kindly check the Table Of Contents.
Segment Analysis
Standard Grade sulfur accounted for 84.27% of the projected 2025 volume, maintaining its position as the primary feedstock for fertilizers, base chemicals, and nickel HPAL leach circuits. High-Purity sulfur is anticipated to grow at a CAGR of 3.41% through 2031, driven by increased pharmaceutical production in Singapore and initial battery-material trials in Malaysia. Suppliers utilizing advanced Claus or wet-acid plants can enhance off-gas streams, improving realizations without expanding primary mining capacity.
In 2024, rubber industries in Vietnam and Thailand consumed approximately 250,000 tons of insoluble sulfur for tire vulcanization. Despite a 13% increase in feedstock prices, alternative curing methods like peroxide and radiation remain niche due to performance limitations. The Asia-Pacific region accounts for 55% of global insoluble sulfur consumption, ensuring stable demand even during economic slowdowns. While High-Purity sulfur cannot replace Standard Grade in these applications, increased captive burning in Indonesia may divert Standard Grade sulfur away from rubber processors, potentially tightening regional supply and supporting prices.
The ASEAN Sulfur Market Report is Segmented by Purity (Standard Grade >=99. 5% and High-Purity >=99. 9%), End-User Industry (Fertilizer, Chemical Processing, Metal Manufacturing, Rubber Processing, and Other End-User Industries), and Geography (Malaysia, Indonesia, Thailand, Singapore, Philippines, Vietnam, and Rest of ASEAN Countries). The Market Forecasts are Provided in Terms of Volume (Metric Tons).
List of Companies Covered in this Report:
- Abu Dhabi National Oil Company (ADNOC)
- China Petroleum & Chemical Corporation (SINOPEC)
- Enersul Ltd
- H.J. Baker & Bro., LLC
- Indian Oil Corporation Ltd.
- Petroliam Nasional Berhad (PETRONAS)
- PETROVIETNAM CHEMICAL AND SERVICES CORPORATION (PVDMC)
- PT Candi Ngrimbi
- PT Pertamina (Persero)
- Qatar Petroleum for the Sale of Petroleum Products Company Limited
- QatarEnergy
- Saudi Aramco
- Shell plc
- Suncor Energy Inc.
- Yara International
Additional Benefits:
- The market estimate (ME) sheet in Excel format
- 3 months of analyst support
TABLE OF CONTENTS
1 Introduction
- 1.1 Study Assumptions and Market Definition
- 1.2 Scope of the Study
2 Research Methodology
3 Executive Summary
4 Market Landscape
- 4.1 Market Overview
- 4.2 Market Drivers
- 4.2.1 Fertilizer demand rebound across ASEAN rice and oil-seed belts
- 4.2.2 Nickel-HPAL projects in Indonesia and Philippines intensifying sulfuric-acid pull
- 4.2.3 Stricter refinery desulfurization standards boosting regional sulfur recovery
- 4.2.4 Expansion of phosphate-fertilizer production capacities in Vietnam and Thailand
- 4.2.5 Rise of sulfur-based cathode RandD for low-cost grid batteries
- 4.3 Market Restraints
- 4.3.1 Volatile Middle-East supply routes via Strait of Hormuz and Red Sea
- 4.3.2 Growing adoption of sulfate-free LiFePO4 battery chemistries
- 4.3.3 Tightening ASEAN port dust-emission limits raising handling costs
- 4.4 Value Chain Analysis
- 4.5 Porter's Five Forces
- 4.5.1 Bargaining Power of Suppliers
- 4.5.2 Bargaining Power of Consumers
- 4.5.3 Threat of New Entrants
- 4.5.4 Threat of Substitutes
- 4.5.5 Degree of Competition
5 Market Size and Growth Forecasts (Volume)
- 5.1 By Purity
- 5.1.1 Standard Grade (>= 99.5%)
- 5.1.2 High-Purity (>= 99.9%, pharma/battery)
- 5.2 By End-user Industry
- 5.2.1 Fertilizer
- 5.2.2 Chemical Processing
- 5.2.3 Metal Manufacturing
- 5.2.4 Rubber Processing
- 5.2.5 Other End-user Industries
- 5.3 By Geography
- 5.3.1 Malaysia
- 5.3.2 Indonesia
- 5.3.3 Thailand
- 5.3.4 Singapore
- 5.3.5 Philippines
- 5.3.6 Vietnam
- 5.3.7 Rest of ASEAN Countries
6 Competitive Landscape
- 6.1 Market Concentration
- 6.2 Strategic Moves
- 6.3 Market Share (%)/Ranking Analysis
- 6.4 Company Profiles (includes Global level Overview, Market level overview, Core Segments, Financials as available, Strategic Information, Products and Services, and Recent Developments)
- 6.4.1 Abu Dhabi National Oil Company (ADNOC)
- 6.4.2 China Petroleum & Chemical Corporation (SINOPEC)
- 6.4.3 Enersul Ltd
- 6.4.4 H.J. Baker & Bro., LLC
- 6.4.5 Indian Oil Corporation Ltd.
- 6.4.6 Petroliam Nasional Berhad (PETRONAS)
- 6.4.7 PETROVIETNAM CHEMICAL AND SERVICES CORPORATION (PVDMC)
- 6.4.8 PT Candi Ngrimbi
- 6.4.9 PT Pertamina (Persero)
- 6.4.10 Qatar Petroleum for the Sale of Petroleum Products Company Limited
- 6.4.11 QatarEnergy
- 6.4.12 Saudi Aramco
- 6.4.13 Shell plc
- 6.4.14 Suncor Energy Inc.
- 6.4.15 Yara International
7 Market Opportunities and Future Outlook
- 7.1 White-space and Unmet-Need Assessment
 硫化染料市場規模、佔有率和成長分析:按類型、形態、應用、纖維類型、加工方法、最終用戶和地區分類-2026-2033年產業預測
 硫磺市場規模、佔有率和成長分析:依產品類型、形態、應用、最終用途產業、原料、通路和地區分類-2026-2033年產業預測
 硫磺市場規模、佔有率和成長分析:按形態、原料、應用、終端用戶產業和地區分類-2026-2033年產業預測
 硫磺膨潤土市場規模、佔有率和成長分析:依產品類型、最終用途、最終用途產業和地區分類-2026-2033年產業預測
 硫磺全球市場
 硫磺市場:依形態、等級、應用和銷售管道分類-2026-2032年全球市場預測
 亞硫醯氯市場機會、成長要素、產業趨勢分析及2026-2035年預測膨潤土硫磺市場:依等級、形態、通路和最終用途分類-2026-2032年全球市場預測硫磺粉市場:2026-2032年全球市場預測(依口味、配方、包裝及通路分類)
 硫磺市場規模、佔有率、成長及全球產業分析:按類型、應用和地區分類,並預測至2026-2034年