


 |
市場調查報告書
商品編碼
2035165
永續性:市場佔有率分析、行業趨勢和統計數據、成長預測(2026-2031 年)Sustainability - Market Share Analysis, Industry Trends & Statistics, Growth Forecasts (2026 - 2031) |
||||||
※ 本網頁內容可能與最新版本有所差異。詳細情況請與我們聯繫。
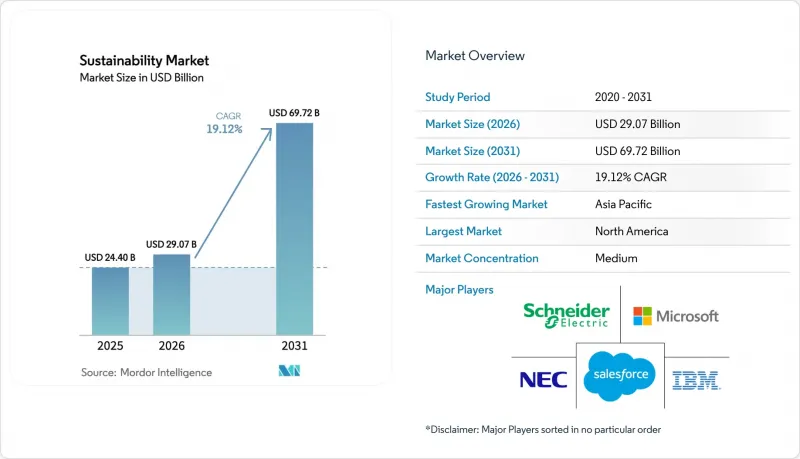
預計到 2026 年,永續發展市場價值將達到 290.7 億美元,高於 2025 年的 244 億美元,預計到 2031 年將達到 697.2 億美元。
預計從 2026 年到 2031 年,其複合年成長率將達到 19.12%。
監管協調的加強,特別是歐盟的《永續發展報告指令》和美國的《氣候變遷揭露條例》,正將環境報告從一項自願活動轉變為一項合規義務。因此,對自動化數據管理平台的需求激增,而企業淨零排放目標、永續發展掛鉤融資以及展現出顯著成本節約潛力的即時分析進一步推動了這一趨勢。隨著企業將預測性洞察置於被動資料收集之上,整合物聯網感測器和人工智慧的供應商迅速獲得了競爭優勢。然而,新興市場缺乏標準化和熟練人員短缺阻礙了短期內技術的普及,尤其是在那些難以承擔實施成本的中小型企業中。
全球永續發展市場趨勢與洞察
ESG報告義務正在加速解決方案的採用。
目前,歐洲已有超過5萬家公司需要遵守廣泛的資訊揭露要求,同時,美國聯邦政府承包商也需根據相關法規提供氣候資料。歐盟指令強制要求進行數位標記,這使得自動化資料收集工具的需求日益迫切,這些工具能夠捕獲結構化的環境資料並將其匯入品質保證工作流程。在北美,各州新增的措施增加了特定管轄區的指標,迫使跨國公司遷移到能夠協調不同法規的平台。違規罰款通常高於平台許可費,因此採購決策中對價格的敏感度相對較低。儘管面臨預算審查,採用XBRL標記和預先配置範本的供應商的銷售週期卻有所縮短。
淨零排放承諾推動北美對碳核算的需求
超過1500家公司已發布科學碳目標,投資者現在要求提供詳細的範圍3排放數據。金融機構正面臨「碳核算夥伴關係金融」(PCAF)標準的進一步審查,該標準要求提供其整個貸款組合中與貸款相關的排放基準。特定類別排放因子的複雜性正在推動人工智慧引擎的應用,這些引擎可以審查供應商發票並將其與數千個活動代碼進行匹配。這一趨勢正在整個供應鏈中蔓延,中小型供應商必須上傳檢驗的排放數據,否則將面臨失去交易資格的風險。
標準碎片化導致資料互通性問題。
全球性企業通常同時運行多個框架,例如 GRI、SASB 和 TCFD,每個框架都有其自身的一套指標、單位和截止日期。傳統平台很少支援統一的應用程式介面 (API),迫使企業運行多個獨立系統或依賴簡陋的電子表格作為橋樑。整合專案會增加整體擁有成本並延遲投資回報,尤其是在供應商之間缺乏通用資料分類系統的情況下。儘管區域標準化機構已承諾整合標準,但圖完全統一的時間表仍不明朗。
細分市場分析
到2025年,解決方案將佔永續發展市場收入的68.12%,這主要得益於構成資料收集基礎的感測器陣列、雲端平台和邊緣處理閘道。業務收益的成長速度更快,複合年成長率達18.34%,因為企業需要根據不同的監管、營運和產業特定情況客製化部署方案。從2026年到2031年,採購部門將擴大將諮詢服務和平台許可捆綁在一起,以加快運作進度。系統整合商將設計分類體系,將設施層級的排放對應到相應的司法管轄區揭露要求,從而確保下游審計合規性。分析顧問將透過解讀異常情況並將其轉化為有助於投資決策的洞察,幫助客戶將焦點從單純的合規性轉移到績效最佳化。雖然大型企業佔據了大部分支出,但簡化的SaaS服務的出現降低了初始投資的門檻,從而帶動了中型企業需求的成長。那些擁有深厚監管專業知識並提供模組化服務目錄的供應商正在提高合約續約率和經常性收入比例。隨著服務利潤率超過硬體利潤率,多家平台提供商正將重心轉向託管服務契約,以加強客戶關係並確保多年現金流。這一趨勢表明,永續發展市場正步入成熟階段,差異化的關鍵不在於基礎資料收集,而在於部署後的價值交付。
物聯網 (IoT) 佔據了永續發展市場 40.21% 的佔有率,其提供的低功耗設備能夠從工廠、辦公室和物流車輛等場所即時傳輸溫度、顆粒物和溫室氣體數據。然而,隨著人工智慧 (AI) 和分析技術預計到 2031 年將實現 20.08% 的複合年成長率 (CAGR),經營團隊的討論重點正從數據可用性轉向可操作的前瞻性。邊緣 AI 模組能夠壓縮和預處理感測器資料流,從而緩解頻寬限制,並實現工業工廠內亞秒級的異常檢測。雲端超大規模資料中心業者能夠提供彈性,以應對季節性擴展和收購,而無需進行本地硬體更新。區塊鏈節點能夠提供供應鏈的來源證明和不可篡改的帳本,從而防止「綠色清洗」行為。數位雙胞胎能夠模擬政策選擇,例如根據室內空氣品質閾值調整暖通空調 (HVAC) 的設定點,使設施管理人員能夠在實施前量化各種方案的利弊。技術的融合使得套件提供者能夠在單一訂閱中整合 AI 庫、資料湖連接器和低程式碼編配工具。專注於特定行業資料模型(例如水泥窯、低溫運輸倉庫或污水處理)的新創公司正從那些更傾向於使用預訓練演算法而非通用框架的運營商那裡獲得合約。在整個預測期內,隨著企業不僅關注模型的輸出結果,也關注其環境足跡,演算法的可解釋性和低碳編碼技術將變得越來越重要。
區域分析
預計到2025年,北美將佔全球收入的35.02%,再次鞏固其作為永續發展市場最大區域貢獻者的地位。針對投資顧問和政府承包商的聯邦資訊揭露法規,已將合規義務擴展至先前將永續發展視為邊緣問題的行業。加州和紐約州的州立法正在加速這一趨勢,迫使跨州公司將報告整合到一個統一的平台上。該地區已擁有廣泛的雲端基礎設施,並且是許多主要軟體供應商的所在地,從而縮短了實施前置作業時間。諸如採用可再生能源供電的超大規模資料中心業者資料中心等策略性舉措,凸顯了美國科技生態系統如何加速政策與創新之間的良性循環。專注於甲烷捕獲分析和電網級儲能的創業投資資金新創公司,進一步豐富了區域解決方案的多樣性。
預計到2031年,亞太地區的複合年成長率將達到21.05%,成為永續發展市場成長最快的地區。中國、印度和日本的國家產業政策正在將污染控制和提升競爭力目標結合,鼓勵工廠在其生產線中採用物聯網和人工智慧技術。新加坡的綠色金融激勵措施和越南的可再生能源目標表明,金融措施和監管藍圖正在相互融合,以促進企業採用這些技術。該地區製造業的高度集中意味著,即使是微小的效率提升也能轉化為顯著的絕對排放減少,從而提高投資的經濟可行性。然而,進展並不均衡,東南亞的小規模工廠仍面臨技術工人短缺的問題,促使區域發展機構提供培訓津貼和眾籌信貸。
歐洲仍然是永續發展市場的重要支柱。這主要得益於《歐洲綠色交易》和《企業永續發展報告指令》,這兩項指令都將永續發展理念制度化,融入企業策略中。歐盟2024年綜合環境、社會和治理(ESG)法規旨在將重疊的資訊揭露要求減少25%,從而推動對能夠整合來自傳統和新型框架的資料集的軟體的需求。歐洲企業正在嘗試基於區塊鏈的消費品可追溯性技術,將供應鏈審計轉變為行銷差異化因素。公共產業正在擴大智慧電網試點項目,以吸收日益成長的分散式可再生能源,這體現了一種將環境目標與能源安全目標相結合的系統性方法。隨著監管政策的日益明朗,市場參與企業預計將迎來第二波投資熱潮,重點關注循環經濟分析和範圍3運輸模組。
其他好處:
- Excel格式的市場預測(ME)表
- 3個月的分析師支持
目錄
第1章:引言
- 研究假設和市場定義
- 調查範圍
第2章:調查方法
第3章執行摘要
第4章 市場狀況
- 市場概覽
- 市場促進因素
- 強制性ESG報告法規(歐盟CSRD、美國證券交易委員會SEC)加速了解決方案的採用。
- 淨零排放承諾推動北美對碳核算的需求
- 促進亞太地區製造業永續發展相關金融的發展。
- 人工智慧主導的重工業資源效率提升進展(日本、德國)
- 區塊鏈技術驅動的道德溯源正在推動零售和時尚產業的發展。
- 巴西自然補償計畫的激增,催生了對資料管理的需求。
- 市場限制因素
- 標準化碎片化導致的資料互通性問題
- 東南亞中小企業技術工人短缺
- 南美洲工業IoT總擁有成本高
- 美國「綠色清洗」訴訟風險
- 價值/供應鏈分析
- 監理展望
- 技術展望
- 產業吸引力—五力分析
- 新進入者的威脅
- 買方的議價能力
- 供應商的議價能力
- 替代品的威脅
- 競爭公司之間的競爭
- 地緣政治影響評估
第5章 市場規模及成長預測(價值,十億美元)
- 按組件
- 解決方案
- 服務
- 透過技術
- 物聯網 (IoT)
- 人工智慧分析
- 數位雙胞胎
- 雲端運算
- 區塊鏈
- 透過使用
- 綠建築
- 碳足跡管理
- 空氣和水污染監測
- 天氣監測及預報
- 火災偵測
- 作物監測
- 土壤和森林監測
- 按最終用戶行業分類
- 製造業
- 能源與公共產業
- 運輸/物流
- 消費品和零售
- 醫療保健和生命科學
- BFSI
- 資訊通訊技術/通訊
- 其他
- 按組織規模
- 大公司
- 小型企業
- 部署模式
- 雲
- 現場
- 按地區
- 北美洲
- 美國
- 加拿大
- 墨西哥
- 南美洲
- 巴西
- 阿根廷
- 秘魯
- 南美洲其他地區
- 歐洲
- 英國
- 德國
- 法國
- 義大利
- 西班牙
- 比荷盧經濟聯盟(比利時、荷蘭、盧森堡)
- 北歐國家(丹麥、芬蘭、冰島、挪威、瑞典)
- 其他歐洲地區
- 亞太地區
- 中國
- 印度
- 日本
- 澳洲
- 韓國
- 東協(印尼、泰國、菲律賓、馬來西亞、越南)
- 亞太其他地區
- 中東和非洲
- 沙烏地阿拉伯
- 阿拉伯聯合大公國
- 卡達
- 科威特
- 土耳其
- 埃及
- 南非
- 奈及利亞
- 其他中東和非洲地區
- 北美洲
第6章 競爭情勢
- 市場集中度
- 策略趨勢
- 市佔率分析
- 公司簡介
- Schneider Electric
- Microsoft
- IBM
- NEC Corporation
- SAP SE
- Salesforce
- Wolters Kluwer(Enablon)
- Sphera Solutions
- Johnson Controls
- Brambles
- SGS SA
- Morningstar Sustainalytics
- Telefonica
- Deloitte
- EY
- Sanofi
- NRI*
第7章 市場機會與未來展望
Sustainability market size in 2026 is estimated at USD 29.07 billion, growing from 2025 value of USD 24.40 billion with 2031 projections showing USD 69.72 billion, growing at 19.12% CAGR over 2026-2031.
Rising regulatory alignment, notably the European Union's Corporate Sustainability Reporting Directive and climate-disclosure rules in the United States, is converting environmental reporting from a discretionary activity into a compliance obligation. The resulting surge in demand for automated data-management platforms is reinforced by corporate net-zero targets, sustainability-linked financing, and real-time analytics that demonstrate clear cost-saving potential. Suppliers that integrate IoT sensors with artificial intelligence are capturing early advantage because enterprises now prioritize predictive insights over passive data collection. Meanwhile, a fragmented standards landscape and scarcity of specialist talent in emerging economies temper near-term uptake, especially among smaller businesses that struggle with implementation costs.
Global Sustainability Market Trends and Insights
Mandatory ESG-reporting Regulations Accelerating Solution Uptake
Extensive disclosure mandates now cover more than 50,000 European companies, and parallel rules require climate data from US federal contractors. Digital tagging obligations under the EU directive have created urgent demand for automated collection tools that ingest structured environmental data and feed assurance workflows. In North America, new state-level measures add jurisdiction-specific metrics, pushing multinational firms toward platforms that reconcile overlapping rulesets. Penalties for non-compliance often exceed platform licence fees, making procurement decisions relatively price-insensitive. Suppliers that embed XBRL tagging and pre-configured templates are seeing sales cycles shorten despite budget scrutiny.
Net-zero Commitments Driving Carbon Accounting Demand in North America
More than 1,500 corporations have public science-based targets, and investors now request granular Scope 3 emissions data. Financial institutions face additional scrutiny under the Partnership for Carbon Accounting Financials standard, which requires financed-emissions baselines across lending books. Complexity around category-based emission factors is propelling the adoption of AI engines that can sift supplier invoices and map them against thousands of activity codes. The trend is cascading down supply chains, forcing smaller vendors to upload verified emissions data or risk disqualification.
Fragmented Standards Causing Data-interoperability Issues
Global organizations often juggle GRI, SASB, and TCFD frameworks, each with discrete metrics, units, and cutoff dates. Legacy platforms rarely support harmonized application programming interfaces, forcing firms to run separate instances or rely on brittle spreadsheet bridges. Integration projects inflate the total cost of ownership and postpone the return on investment, especially when suppliers lack shared data taxonomies. Regional standard-setting bodies promise convergence, yet timelines for full alignment remain uncertain.
Other drivers and restraints analyzed in the detailed report include:
- Sustainability-linked Financing Pushing Adoption in APAC Manufacturing
- AI-led Resource-efficiency Gains in Heavy Industries
- Skilled-talent Shortage in Southeast-Asian SMEs
For complete list of drivers and restraints, kindly check the Table Of Contents.
Segment Analysis
Solutions generated 68.12% of sustainability market revenue in 2025, underpinned by sensor arrays, cloud platforms, and edge-processing gateways that anchor data acquisition. Services revenue is climbing faster at an 18.34% CAGR because organizations must tailor deployments to divergent regulatory, operational, and industry contexts. During 2026-2031, procurement teams increasingly bundle advisory engagements with platform licences to accelerate go-live schedules. Systems integrators design taxonomies that map facility-level emissions to jurisdiction-specific disclosures, ensuring downstream audit readiness. Analytics consultants interpret anomalies and translate them into investment-grade insights, moving client focus from pure compliance toward performance optimization. Large enterprises dominate spending, yet mid-market demand is rising as simplified SaaS offerings shrink upfront capital hurdles. Vendors that cultivate deep regulatory expertise and offer modular service catalogs are improving renewal rates and recurring revenue mix. As service margins eclipse hardware margins, several platform providers now emphasize managed-service contracts, locking in multi-year cash flows while strengthening customer intimacy. The pattern signals a maturing sustainability market where differentiation lies in post-deployment value delivery rather than basic data capture.
IoT underpins 40.21% of the sustainability market, supplying low-power devices that stream temperature, particulate, and greenhouse-gas data from factories, offices, and logistics fleets. Yet AI and analytics are projected to deliver a 20.08% CAGR to 2031, shifting boardroom conversations from data availability to actionable foresight. Edge-AI modules compress and preprocess sensor streams, easing bandwidth constraints and enabling sub-second anomaly detection inside industrial plants. Cloud hyperscalers add elasticity that supports seasonal scaling or acquisitions without on-premise hardware refreshes. Blockchain nodes certify provenance in supply chains, providing immutable ledgers that deter greenwashing claims. Digital twins simulate policy choices, such as adjusting HVAC setpoints against indoor-air-quality thresholds, allowing facilities managers to quantify trade-offs before implementation. Technology convergence prompts suite providers to embed AI libraries, data-lake connectors, and low-code orchestration tools inside single subscriptions. Start-ups focusing on sector-specific data models, cement kilns, cold-chain warehousing, or wastewater treatment, win contracts from operators that prefer pre-trained algorithms over generic frameworks. Over the forecast horizon, algorithm explainability and carbon-aware coding techniques will gain prominence as enterprises scrutinize model footprints alongside model outputs.
The Sustainability Market is Segmented by Component (Solutions and Services), by Technology (Internet of Things, and Others), by Application (Green Building, and Others), by End-User Industry (Manufacturing, and Others), by Organization Size (Large Enterprises, and Others), and by Geography (North America, South America, Europe, Asia-Pacific, and Middle East and Africa). The Market Forecasts are Provided in Terms of Value (USD).
Geography Analysis
North America generated 35.02% of 2025 revenue, reaffirming its position as the largest regional contributor to the sustainability market. Federal disclosure rules that cover investment advisers and government contractors have extended compliance obligations into sectors that previously treated sustainability as peripheral. State mandates in California and New York reinforce momentum, compelling multi-state corporations to consolidate reporting under unified platforms. The region already owns extensive cloud infrastructure and hosts leading software vendors, shortening deployment lead times. Strategic initiatives, such as hyperscaler data centers powered by renewable energy, highlight how domestic technology ecosystems accelerate positive feedback between policy and innovation. Venture-funded start-ups focusing on methane-capture analytics and grid-scale storage further enrich local solution diversity.
Asia-Pacific is forecast to record a 21.05% CAGR to 2031, making it the fastest-growing region within the sustainability market. National industrial policies in China, India, and Japan blend pollution control with competitiveness goals, driving factories to instrument production lines with IoT and AI. Singapore's green-finance incentives and Vietnam's renewable-energy targets illustrate how fiscal measures and regulatory roadmaps converge to stimulate enterprise adoption. The region's manufacturing concentration means even marginal efficiency gains translate into large absolute emissions reductions, reinforcing investment economics. Yet progress is uneven because small factories in Southeast Asia still face skills shortages, prompting regional development agencies to offer subsidized training and cloud credits.
Europe remains a critical pillar in the sustainability market, , propelled by the European Green Deal and the Corporate Sustainability Reporting Directive, both of which institutionalize sustainability across corporate strategy. The EU's 2024 Omnibus ESG Regulation seeks to cut overlapping disclosure requirements by 25%, catalyzing demand for software that can harmonize datasets across legacy and new frameworks. European enterprises experiment with blockchain traceability for consumer goods, transforming supply-chain audits into marketing differentiators. Utility firms expand smart-grid pilots to absorb growing volumes of distributed renewables, exemplifying systemic approaches that combine environmental targets with energy-security objectives. As regulatory clarity improves, market participants anticipate a second investment wave focused on circular-economy analytics and scope-3 transportation modules.
- Schneider Electric
- Microsoft
- IBM
- NEC Corporation
- SAP SE
- Salesforce
- Wolters Kluwer (Enablon)
- Sphera Solutions
- Johnson Controls
- Brambles
- SGS SA
- Morningstar Sustainalytics
- Telefonica
- Deloitte
- EY
- Sanofi
- NRI*
Additional Benefits:
- The market estimate (ME) sheet in Excel format
- 3 months of analyst support
TABLE OF CONTENTS
1 Introduction
- 1.1 Study Assumptions & Market Definition
- 1.2 Scope of the Study
2 Research Methodology
3 Executive Summary
4 Market Landscape
- 4.1 Market Overview
- 4.2 Market Drivers
- 4.2.1 Mandatory ESG-Reporting Regulations (EU CSRD, SEC) Accelerating Solution Uptake
- 4.2.2 Net-Zero Commitments Driving Carbon Accounting Demand in North America
- 4.2.3 Sustainability-Linked Financing Pushing Adoption in APAC Manufacturing
- 4.2.4 AI-Led Resource-Efficiency Gains in Heavy Industries (JP, DE)
- 4.2.5 Blockchain-Enabled Ethical Traceability Boosting Retail & Fashion
- 4.2.6 Nature-Based Offset Surge in Brazil Creating Data-Management Needs
- 4.3 Market Restraints
- 4.3.1 Fragmented Standards Causing Data-Interoperability Issues
- 4.3.2 Skilled-Talent Shortage in SE-Asia SMEs
- 4.3.3 High TCO of Industrial IoT in South America
- 4.3.4 Greenwashing Litigation Risk in the US
- 4.4 Value / Supply-Chain Analysis
- 4.5 Regulatory Outlook
- 4.6 Technological Outlook
- 4.7 Industry Attractiveness - Porter's Five Forces
- 4.7.1 Threat of New Entrants
- 4.7.2 Bargaining Power of Buyers
- 4.7.3 Bargaining Power of Suppliers
- 4.7.4 Threat of Substitutes
- 4.7.5 Competitive Rivalry
- 4.8 Geopolitics Impact Assessment
5 Market Size & Growth Forecasts (Value, USD Bn)
- 5.1 By Component
- 5.1.1 Solutions
- 5.1.2 Services
- 5.2 By Technology
- 5.2.1 Internet of Things (IoT)
- 5.2.2 AI & Analytics
- 5.2.3 Digital Twin
- 5.2.4 Cloud Computing
- 5.2.5 Blockchain
- 5.3 By Application
- 5.3.1 Green Building
- 5.3.2 Carbon Footprint Management
- 5.3.3 Air & Water Pollution Monitoring
- 5.3.4 Weather Monitoring & Forecasting
- 5.3.5 Fire Detection
- 5.3.6 Crop Monitoring
- 5.3.7 Soil & Forest Monitoring
- 5.4 By End-User Industry
- 5.4.1 Manufacturing
- 5.4.2 Energy & Utilities
- 5.4.3 Transport & Logistics
- 5.4.4 Consumer Goods & Retail
- 5.4.5 Healthcare & Life Sciences
- 5.4.6 BFSI
- 5.4.7 ICT & Telecom
- 5.4.8 Others
- 5.5 By Organization Size
- 5.5.1 Large Enterprises
- 5.5.2 Small & Mid-Sized Enterprises
- 5.6 By Deployment Mode
- 5.6.1 Cloud
- 5.6.2 On-Premise
- 5.7 By Geography
- 5.7.1 North America
- 5.7.1.1 United States
- 5.7.1.2 Canada
- 5.7.1.3 Mexico
- 5.7.2 South America
- 5.7.2.1 Brazil
- 5.7.2.2 Argentina
- 5.7.2.3 Peru
- 5.7.2.4 Rest of South America
- 5.7.3 Europe
- 5.7.3.1 United Kingdom
- 5.7.3.2 Germany
- 5.7.3.3 France
- 5.7.3.4 Italy
- 5.7.3.5 Spain
- 5.7.3.6 BENELUX (Belgium, Netherlands, and Luxembourg)
- 5.7.3.7 NORDICS (Denmark, Finland, Iceland, Norway, and Sweden)
- 5.7.3.8 Rest of Europe
- 5.7.4 Asia-Pacific
- 5.7.4.1 China
- 5.7.4.2 India
- 5.7.4.3 Japan
- 5.7.4.4 Australia
- 5.7.4.5 South Korea
- 5.7.4.6 ASEAN (Indonesia, Thailand, Philippines, Malaysia, Vietnam)
- 5.7.4.7 Rest of Asia-Pacific
- 5.7.5 Middle East and Africa
- 5.7.5.1 Saudi Arabia
- 5.7.5.2 United Arab Emirates
- 5.7.5.3 Qatar
- 5.7.5.4 Kuwait
- 5.7.5.5 Turkey
- 5.7.5.6 Egypt
- 5.7.5.7 South Africa
- 5.7.5.8 Nigeria
- 5.7.5.9 Rest of Middle East and Africa
- 5.7.1 North America
6 Competitive Landscape
- 6.1 Market Concentration
- 6.2 Strategic Moves
- 6.3 Market Share Analysis
- 6.4 Company Profiles (includes Global-level Overview, Market-level Overview, Core Segments, Financials, Strategic Info, Market Rank/Share, Products & Services, Recent Developments)
- 6.4.1 Schneider Electric
- 6.4.2 Microsoft
- 6.4.3 IBM
- 6.4.4 NEC Corporation
- 6.4.5 SAP SE
- 6.4.6 Salesforce
- 6.4.7 Wolters Kluwer (Enablon)
- 6.4.8 Sphera Solutions
- 6.4.9 Johnson Controls
- 6.4.10 Brambles
- 6.4.11 SGS SA
- 6.4.12 Morningstar Sustainalytics
- 6.4.13 Telefonica
- 6.4.14 Deloitte
- 6.4.15 EY
- 6.4.16 Sanofi
- 6.4.17 NRI*
7 Market Opportunities & Future Outlook
- 7.1 White-Space & Unmet-Need Assessment
 2026年全球永續諮詢市場報告
 水力發電的連結:資料中心如何重塑美國水資源格局
 全球水燃料市場規模、佔有率、趨勢和成長分析報告(2026-2034年)
 2025-2029年全球水燃料市場
 2032年食品廢棄物減量技術市場預測:按食品類型、技術、應用、最終用戶和地區分類的全球分析
 菌絲體基建築材料市場規模、佔有率和趨勢分析報告:按產品、應用、地區和細分市場預測(2025-2033 年)全球水能技術市場:未來預測(至2032年)-按技術、應用、最終用戶和地區分類的分析全球通訊永續發展市場:預測至 2032 年—按組件、部署方式、網路類型、技術、應用、最終用戶和地區進行分析
 2025-2029年全球人工智慧在ESG和永續發展領域的市場前景
 永續發展諮詢市場:2025-2030 年全球預測(按提供的服務、永續發展重點領域、組織規模、最終用途產業和交付模式)