


 |
市場調查報告書
商品編碼
2035106
電池能源儲存系統(BESS):市場佔有率分析、產業趨勢與統計、成長預測(2026-2031)Battery Energy Storage System (BESS) - Market Share Analysis, Industry Trends & Statistics, Growth Forecasts (2026 - 2031) |
||||||
※ 本網頁內容可能與最新版本有所差異。詳細情況請與我們聯繫。
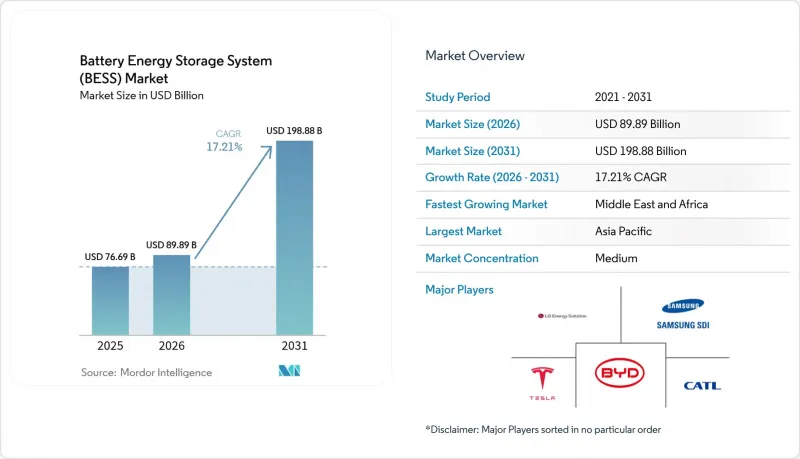
預計電池能源儲存系統(BESS)市場規模將從 2025 年的 766.9 億美元成長到 2026 年的 898.9 億美元,然後從 2026 年到 2031 年以 17.21% 的複合年成長率成長,到 2031 年達到 198.8 億美元。
鋰離子電池成本的快速下降、採購要求的日益嚴格以及電網現代化投入的不斷增加,正將大型儲能系統從小眾的可靠性解決方案轉變為主流基礎設施。諸如美國《通膨控制法案》和歐盟《淨零排放產業法案》等政策正在推動數吉瓦級儲能計畫的發展,而對併網逆變器的需求也拓展了能源套利以外的收入來源。同時,澳洲和智利太陽能購電協議(PPA)的價格與儲能電池相當,顯示能夠提供四小時儲能的電池可以在晚間用電高峰期以具有競爭力的價格提供穩定的電力供應。資料中心不斷成長的電力需求以及受政治因素驅動的供應鏈回流,進一步推動了該行業的發展勢頭。
全球電池能源儲存系統(BESS)市場趨勢與洞察
美國、中國和歐盟的公用事業規模採購義務。
強制採購正在改變開發格局。加州長期儲能系統競標目標為2吉瓦,中國電力建設集團的競標目標為16吉瓦時,韓國則中標了540兆瓦/3240兆瓦時的項目。這為開發商提供了清晰的盈利前景和資金籌措可能性。在歐洲,《淨零排放產業法案》鼓勵國內採購,而在中國,近期改革取消了嚴格的配額限制,讓市場基本面驅動經濟可行性。這些項目降低了資金籌措成本,並將專案引導至能夠滿足電網服務效能保證的合格整合商。
併網逆變器的引入釋放了共享空間的價值。
從併網型架構向併網型架構的轉變,將使電池能夠提供複合慣性和電壓支持,這些服務傳統上由電網營運商從同步發電中獲取。 Transgrid 的研究表明,併網型架構的需求量高達 4.8 吉瓦,而 Fluence 在澳洲的 300 兆瓦專案也凸顯了其商業性可行性。歐洲輸電業者 TenneT 預計到 2030 年儲能容量將達到 5.2 至 12.7 吉瓦,這進一步強調了其廣泛的適用性。來自慣性相關產品的額外收入以及電網連接條件的改善將提升專案的經濟效益,並促進太陽能發電和儲能相結合的混合開發模式。
鋰和石墨處理的瓶頸
中國處理了全球90%的石墨,而印尼的鎳出口禁令正推動國內精煉業發展,造成市場集中度過高的風險。隨著吉瓦級競標的激增,原料短缺正威脅電池生產。像Group14這樣的新創公司正在試行富矽負極材料,但商業化生產仍需數年時間。回收利用專案可以緩解原生材料的需求,但物流方面的挑戰限制了其對需要高純度原料的公用事業規模專案的即時影響。
細分市場分析
到2025年,鋰離子電池仍將佔據電池能源儲存系統)市場88.05%的佔有率。然而,磷酸鋰鐵(LFP)在成本和熱穩定性方面的優勢正推動其以18.62%的複合年成長率成長,比亞迪在2024年部署的40GWh容量便是最好的例證。儘管NMC電池在能量密度至關重要的領域仍然發揮著重要作用,但釩液流電池和鈉離子電池技術在長時運作和高循環利用方面正吸引著小眾市場的注意。隨著規模擴大,每度電成本的降低,採用鋰離子電池的電池能源儲存系統(BESS)市場規模預計將會擴大。化學成分的多樣化降低了供應鏈風險,並透過資產特定的對沖結構拓展了企劃案融資的可能性。
不同地區的部署策略各不相同。中國企業正在提供超低成本的磷酸鋰電池機架式電池,歐洲電力公司正在試驗鈉離子電池以檢驗其耐寒性能,而美國電網營運商正在測試用於8小時供電的鋅溴液流電池。這些並行舉措表明,人們越來越傾向於針對特定運作週期最佳化化學成分選擇,而不是依賴「一刀切」的模式。
至2025年,併網系統將佔總部署量的77.35%。這得歸功於標準化的併網規範和強勁的電力銷售收入機會。同時,受農村電氣化和工業韌性需求的推動,離網領域正以18.04%的複合年成長率快速擴張。巴基斯坦預計到2030年將進口8.75吉瓦時的電力,顯示市場對繞過脆弱的國家基礎設施的微電網的需求正在增加。
可在併網模式和離網模式之間切換的混合配置代表了一種新興的細分市場,它不僅能提供備用電源,還能降低需求費用。這些靈活的資產正透過虛擬電廠(VPP)的聚合進入批發市場,而這一趨勢目前正受到美國幾家獨立電網營運商(ISO)費率調整的影響。
《電池能源儲存系統(BESS) 市場報告》按電池類型(鋰離子電池、磷酸鋰鐵、其他電池)、連接方式(併網、離網)、組件(電池組架、電力轉換系統、其他組件)、能量容量(小於 100 MWh、其他容量)、最終用戶應用(公用事業、住宅、其他地區)和地區(北美、歐洲、太亞地區)和其他地區(北美地區)。
區域分析
亞太地區預計2025年將維持49.85%的市場佔有率,這主要得益於中國每年新增裝置容量翻倍7,000萬千瓦。印度SECI公司成功得標1吉瓦/2吉瓦時競標,標誌著該地區市場進入轉捩點;日本在1.67吉瓦容量市場中成功中標,凸顯了儲能在保障電力供應方面的重要作用。韓國推進了540兆瓦項目的競標,而LG能源解決方案公司透過向歐洲和日本出口多吉瓦時儲能系統,展現了該地區強大的製造能力。
中東和非洲是成長最快的地區,年複合成長率達19.07%。大規模訂單基本負載可再生的太陽能發電廠與一套19吉瓦時的儲能系統整合在一起。
北美和歐洲的電池能源儲存系統市場持續保持極高的絕對普及率。儘管美國已宣布投資1,000億美元,但總裝置容量達2,600吉瓦的專案併網等待時間可能長達四年。歐洲的「淨零排放產業法案」旨在促進供應鏈的地產地銷,但已宣布的超級工廠項目中超過一半面臨資金籌措延遲。英國的容量市場、義大利的車輛部署要求以及加拿大的生產補貼等區域政策差異,造就了多種多樣的收入模式,經驗豐富的開發商正透過套利來應對這些模式帶來的挑戰。
其他好處:
- Excel格式的市場預測(ME)表
- 3個月的分析師支持
目錄
第1章:引言
- 市場分析與定義的前提條件
- 分析範圍
第2章 分析方法
第3章執行摘要
第4章 市場狀況
- 市場概覽
- 近期趨勢與創新
- 市場促進因素
- 美國、中國和歐盟的公用事業規模採購義務正在加速吉瓦級訂單的出現。
- 併網逆變器的要求使得透過共址部署創造價值成為可能。
- 澳洲和智利太陽能+儲能購電協議價格持平
- 歐盟和美國的電池供應鏈法規正在推動國內製造業的發展。
- 資料中心負載增加和人工智慧的發展推動了北美地區對 4 小時儲存的需求。
- 在亞洲,電動車電池的二次利用降低了資本投資。
- 市場限制因素
- 印尼和非洲的鋰石墨加工瓶頸
- 由於更嚴格的消防安全標準(UL-9540A、NFPA-855)導致工廠設備成本增加
- 美國獨立系統營運商 (ISO) 的電網連接排隊時間過長,導致 FTM 專案無法及時產生收入。
- 高利率環境對商家獲利帶來壓力。
- 供應鏈分析
- 監理與政策展望
- 技術展望
- 波特五力模型
- 供應商議價能力
- 買方的議價能力
- 新參與企業的威脅
- 替代品的威脅
- 競爭公司之間的競爭關係
第5章 市場規模與成長預測
- 依電池類型
- 鋰離子
- 磷酸鋰鐵(LFP)
- 鎳錳鈷(NMC)
- 鉛酸電池
- 其他(液流電池(釩液流電池、鋅溴液流電池)、鈉基電池(NaS液流電池、Na離子液流電池))
- 透過連接方式
- 併網(與電力公司的連接)
- 離網(微電網、混合電網)
- 按組件
- 電池組支架
- 電源轉換系統(PCS)
- 能源管理軟體(EMS)
- 工廠相關設備及服務
- 按能量容量
- 小於100兆瓦時
- 101~500 MWh
- 500兆瓦時或以上
- 透過最終用戶應用程式
- 家用
- 商業和工業用途
- 公用事業
- 按地區
- 北美洲
- 美國
- 加拿大
- 墨西哥
- 歐洲
- 英國
- 德國
- 法國
- 西班牙
- 北歐國家
- 俄羅斯
- 其他歐洲國家
- 亞太地區
- 中國
- 印度
- 日本
- 韓國
- 馬來西亞
- 泰國
- 印尼
- 越南
- 澳洲
- 亞太其他地區
- 南美洲
- 巴西
- 阿根廷
- 哥倫比亞
- 南美洲其他地區
- 中東和非洲
- 阿拉伯聯合大公國
- 沙烏地阿拉伯
- 南非
- 埃及
- 其他中東和非洲地區
- 北美洲
第6章 競爭情勢
- 市場集中度
- 策略性舉措(併購、合作、購電協議)
- 市場佔有率分析(主要公司的市場排名和佔有率)
- 公司簡介
- BYD Company Limited
- Contemporary Amperex Technology Co. Ltd.(CATL)
- LG Energy Solution Ltd.
- Panasonic Holdings Corp.
- Tesla Inc.
- Samsung SDI Co. Ltd.
- Fluence Energy Inc.
- ABB Ltd.
- Siemens Energy AG
- GE Vernova
- Hitachi Energy Ltd.
- Mitsubishi Power
- Sungrow Power Supply Co.
- Eaton Corporation plc
- Toshiba Corp.
- EVE Energy Co.
- VARTA AG
- Saft SAS(TotalEnergies)
- CellCube Energy Storage Systems Inc.
- Enphase Energy Inc.
第7章 市場機會與未來展望
The Battery Energy Storage System market size is expected to grow from USD 76.69 billion in 2025 to USD 89.89 billion in 2026 and is forecast to reach USD 198.88 billion by 2031 at 17.21% CAGR over 2026-2031.
Rapid cost declines in lithium-ion cells, supportive procurement mandates, and rising grid-modernization spending are turning large-scale storage from a niche reliability tool into mainstream infrastructure. Policy tailwinds such as the Inflation Reduction Act in the United States and the Net-Zero Industry Act in the European Union have anchored multi-gigawatt project pipelines, while grid-forming inverter requirements are expanding revenue streams beyond energy arbitrage. Simultaneously, price parity for solar-plus-storage power purchase agreements (PPAs) in Australia and Chile proves that four-hour batteries can offer firm, evening-peak supply at competitive rates. Growing data-center electricity demand and politically driven supply-chain reshoring further reinforce the sector's momentum.
Global Battery Energy Storage System (BESS) Market Trends and Insights
Utility-scale procurement mandates in the United States, China, and the European Union
Mandated procurements are reshaping the development landscape. California's long-duration solicitation targets 2 GW, Power China tender seeks 16 GWh, and South Korea awarded 540 MW/3,240 MWh, giving developers visibility on revenue and bankability. In Europe, the Net-Zero Industry Act incentivizes domestic content, while recent Chinese reforms removed rigid allocation rules, letting market fundamentals guide economics. Such programs lower financing costs and channel volume to qualified integrators who meet grid-service performance guarantees.
Grid-forming inverter adoption unlocking co-location value
Moving from grid-following to grid-forming architectures lets batteries deliver synthetic inertia and voltage support, services that grid operators historically procured from synchronous generation. Transgrid's study showing 4.8 GW of grid-forming needs and Fluence's 300 MW Australian project highlight commercial viability. European operator TenneT foresees 5.2-12.7 GW storage by 2030, underscoring broad applicability. Added revenue from inertia products and strengthened interconnection terms improve project economics and favor hybrid solar-storage development.
Lithium and graphite processing bottlenecks
China processes 90% of global graphite, and Indonesia's nickel export bans push domestic refining, introducing concentration risk. Material shortages threaten cell production just as multi-gigawatt auctions surge. Start-ups such as Group14 are piloting silicon-rich anodes, but commercial volumes remain years away. Recycling programs can ease primary demand, yet logistic hurdles limit immediate impact for utility-scale projects that require high-purity inputs.
Other drivers and restraints analyzed in the detailed report include:
- PV-plus-storage PPA price parity in Australia and Chile
- EU and US supply-chain acts catalyzing domestic manufacturing
- Fire-safety code tightening under UL-9540A and NFPA-855
For complete list of drivers and restraints, kindly check the Table Of Contents.
Segment Analysis
Lithium-ion maintained 88.05% battery energy storage system market share in 2025. Yet LFP's cost and thermal-stability advantages drive its 18.62% CAGR, exemplified by BYD's 40 GWh 2024 installations. NMC chemistries remain relevant where energy density matters, while vanadium flow and sodium-ion technologies attract niche interest for long-duration or high-cycle use. Lithium-ion variants' battery energy storage system market size is projected to widen as scaling lowers per-kilowatt-hour costs. Diversification across chemistries reduces supply-chain risk and opens project financing to asset-specific hedging structures.
Implementation tactics vary by region. Chinese players offer ultra-low-priced LFP racks, European utilities test sodium-ion for cold-weather resilience, and U.S. grid operators pilot zinc-bromine flow batteries for eight-hour services. These parallel pathways illustrate how chemistry choice is increasingly optimized for duty cycle rather than a one-size-fits-all paradigm.
On-grid systems captured 77.35% of 2025 deployments, supported by standardized interconnection and robust merchant revenue opportunities. The off-grid segment, however, is accelerating at 18.04% CAGR owing to rural electrification and industrial resilience requirements. Pakistan's import projection of 8.75 GWh by 2030 typifies emerging-market demand for microgrids that bypass weak national infrastructure.
Hybrid configurations that switch between grid and islanded mode are a rising subset, offering customers demand-charge reduction plus backup power. These flexible assets partake in wholesale markets through virtual-power-plant aggregation, a trend now codified in several U.S. independent system operators' tariff updates.
The Battery Energy Storage System (BESS) Market Report is Segmented Into Battery Type (Lithium-Ion, Lithium Iron Phosphate, and Others), Connection Type (On-Grid and Off-Grid), Components (Battery Pack and Racks, Power Conversion System, and Others), Energy Capacity Range (Below 100 MWh, and Others), End-User Application (Utility, Residential, and Others), and Geography (North America, Europe, Asia-Pacific, and Others).
Geography Analysis
Asia-Pacific retained a 49.85% share in 2025, powered by China's 70 million kW installed base that doubled yearly. India reached an inflection point with SECI's 1 GW/2 GWh auction, and Japan's 1.67 GW capacity-market awards validated storage's role in capacity adequacy. South Korea advanced a 540 MW tender, and LG Energy Solution exported multi-GWh systems to Europe and Japan, underscoring the region's manufacturing clout.
The Middle East and Africa are the fastest-growing regions at 19.07% CAGR. Saudi Arabia's 7.8 GW partnership with Sungrow and Egypt's 200 MWh AfDB-financed project illustrate large-scale commitments. South Africa's 1 GW awards highlight how storage addresses chronic grid instability. Moreover, the United Arab Emirates integrates 19 GWh with a 5.2 GW solar plant, pioneering baseload renewables in desert climates.
North America and Europe continue to post high absolute volumes in the battery energy storage system market. The United States hosts USD 100 billion in announced investments but suffers four-year interconnection queues for 2,600 GW of projects. Europe's Net-Zero Industry Act seeks to localize supply chains, yet over half of announced gigafactories face financing delays. Regional policy diversity-capacity markets in the United Kingdom, fleet mandates in Italy, and production credits in Canada-produces a mosaic of revenue models that sophisticated developers arbitrage.
- BYD Company Limited
- Contemporary Amperex Technology Co. Ltd. (CATL)
- LG Energy Solution Ltd.
- Panasonic Holdings Corp.
- Tesla Inc.
- Samsung SDI Co. Ltd.
- Fluence Energy Inc.
- ABB Ltd.
- Siemens Energy AG
- GE Vernova
- Hitachi Energy Ltd.
- Mitsubishi Power
- Sungrow Power Supply Co.
- Eaton Corporation plc
- Toshiba Corp.
- EVE Energy Co.
- VARTA AG
- Saft SAS (TotalEnergies)
- CellCube Energy Storage Systems Inc.
- Enphase Energy Inc.
Additional Benefits:
- The market estimate (ME) sheet in Excel format
- 3 months of analyst support
TABLE OF CONTENTS
1 Introduction
- 1.1 Study Assumptions & Methodology Scope
- 1.2 Market Definition
2 Research Methodology
3 Executive Summary
4 Market Landscape
- 4.1 Market Overview
- 4.2 Recent Trends & Innovations
- 4.3 Market Drivers
- 4.3.1 Utility-Scale Procurement Mandates in U.S., China & EU Accelerating Gigawatt-Scale Orders
- 4.3.2 Grid-Forming Inverter Requirements Unlocking Co-Location Value Stacks
- 4.3.3 PV-Plus-Storage PPA Price Parity in Australia & Chile
- 4.3.4 EU & U.S. Battery Supply-Chain Acts Creating Domestic Manufacturing Pull-Through
- 4.3.5 Data-Center & AI Load Growth Driving 4-Hr Storage Demand in North America
- 4.3.6 Second-Life EV Battery Availability Reducing CapEx in Asia
- 4.4 Market Restraints
- 4.4.1 Lithium & Graphite Processing Bottlenecks in Indonesia and Africa
- 4.4.2 Fire-Safety Code Tightening (UL-9540A, NFPA-855) Inflating Balance-of-Plant Costs
- 4.4.3 Long Interconnection Queues in U.S. ISOs Delaying FTM Project Revenues
- 4.4.4 High Interest-Rate Environment Compressing Merchant Revenue Stacks
- 4.5 Supply-Chain Analysis
- 4.6 Regulatory and Policy Outlook
- 4.7 Technological Outlook
- 4.8 Porter's Five Forces
- 4.8.1 Bargaining Power of Suppliers
- 4.8.2 Bargaining Power of Buyers
- 4.8.3 Threat of New Entrants
- 4.8.4 Threat of Substitutes
- 4.8.5 Intensity of Competitive Rivalry
5 Market Size & Growth Forecasts
- 5.1 By Battery Type
- 5.1.1 Lithium-ion
- 5.1.2 Lithium Iron Phosphate (LFP)
- 5.1.3 Nickel-Manganese-Cobalt (NMC)
- 5.1.4 Lead-acid
- 5.1.5 Others [Flow Batteries (Vanadium, Zinc-Br), Sodium-based (NaS, Na-ion)]
- 5.2 By Connection Type
- 5.2.1 On-Grid (Utility Interconnected)
- 5.2.2 Off-Grid (Micro-Grid, Hybrid)
- 5.3 By Component
- 5.3.1 Battery Pack and Racks
- 5.3.2 Power Conversion System (PCS)
- 5.3.3 Energy Management Software (EMS)
- 5.3.4 Balance-of-Plant and Services
- 5.4 By Energy Capacity Range
- 5.4.1 Below 100 MWh
- 5.4.2 101 to 500 MWh
- 5.4.3 Above 500 MWh
- 5.5 By End-user Application
- 5.5.1 Residential
- 5.5.2 Commercial and Industrial
- 5.5.3 Utility
- 5.6 By Geography
- 5.6.1 North America
- 5.6.1.1 United States
- 5.6.1.2 Canada
- 5.6.1.3 Mexico
- 5.6.2 Europe
- 5.6.2.1 United Kingdom
- 5.6.2.2 Germany
- 5.6.2.3 France
- 5.6.2.4 Spain
- 5.6.2.5 Nordic Countries
- 5.6.2.6 Russia
- 5.6.2.7 Rest of Europe
- 5.6.3 Asia-Pacific
- 5.6.3.1 China
- 5.6.3.2 India
- 5.6.3.3 Japan
- 5.6.3.4 South Korea
- 5.6.3.5 Malaysia
- 5.6.3.6 Thailand
- 5.6.3.7 Indonesia
- 5.6.3.8 Vietnam
- 5.6.3.9 Australia
- 5.6.3.10 Rest of Asia-Pacific
- 5.6.4 South America
- 5.6.4.1 Brazil
- 5.6.4.2 Argentina
- 5.6.4.3 Colombia
- 5.6.4.4 Rest of South America
- 5.6.5 Middle East and Africa
- 5.6.5.1 United Arab Emirates
- 5.6.5.2 Saudi Arabia
- 5.6.5.3 South Africa
- 5.6.5.4 Egypt
- 5.6.5.5 Rest of Middle East and Africa
- 5.6.1 North America
6 Competitive Landscape
- 6.1 Market Concentration
- 6.2 Strategic Moves (M&A, Partnerships, PPAs)
- 6.3 Market Share Analysis (Market Rank/Share for key companies)
- 6.4 Company Profiles (includes Global level Overview, Market level overview, Core Segments, Financials as available, Strategic Information, Products & Services, and Recent Developments)
- 6.4.1 BYD Company Limited
- 6.4.2 Contemporary Amperex Technology Co. Ltd. (CATL)
- 6.4.3 LG Energy Solution Ltd.
- 6.4.4 Panasonic Holdings Corp.
- 6.4.5 Tesla Inc.
- 6.4.6 Samsung SDI Co. Ltd.
- 6.4.7 Fluence Energy Inc.
- 6.4.8 ABB Ltd.
- 6.4.9 Siemens Energy AG
- 6.4.10 GE Vernova
- 6.4.11 Hitachi Energy Ltd.
- 6.4.12 Mitsubishi Power
- 6.4.13 Sungrow Power Supply Co.
- 6.4.14 Eaton Corporation plc
- 6.4.15 Toshiba Corp.
- 6.4.16 EVE Energy Co.
- 6.4.17 VARTA AG
- 6.4.18 Saft SAS (TotalEnergies)
- 6.4.19 CellCube Energy Storage Systems Inc.
- 6.4.20 Enphase Energy Inc.
7 Market Opportunities & Future Outlook
- 7.1 White-space & Unmet-Need Assessment
 電池能源儲存系統市場預測至2034年—按電池技術、輸出容量、應用、最終用戶和地區分類的全球分析
 電池能源儲存系統市場:按組件、電池類型、能量容量、連接方式、部署方式和應用分類-2026年至2032年全球市場預測
 2026年全球電錶前電池市場報告2026年全球電池租賃即服務市場報告
 全球電池能源儲存系統市場:按電池類型、應用、所有權/部署模式、連接方式、國家和地區分類-產業分析、市場規模、佔有率及預測(2025-2032年)
 全球電池能源儲存系統市場規模、佔有率、趨勢和成長分析報告(2026-2034年)2026年全球電池能源儲存系統市場報告
 北美電池能源儲存系統(BESS)-市場佔有率分析、產業趨勢與統計、成長預測(2026-2031)
 電池儲能系統市場-全球產業規模、佔有率、趨勢、機會及預測(依電池類型、連接類型、能源容量、應用、區域及競爭格局分類,2021-2031年預測)
 電池能源儲存系統市場規模、佔有率和趨勢分析報告:按電池類型、應用領域、地區和細分市場預測(2026-2033 年)