


 |
市場調查報告書
商品編碼
1910897
北美電池能源儲存系統(BESS)-市場佔有率分析、產業趨勢與統計、成長預測(2026-2031)North America Battery Energy Storage System (BESS) - Market Share Analysis, Industry Trends & Statistics, Growth Forecasts (2026 - 2031) |
||||||
※ 本網頁內容可能與最新版本有所差異。詳細情況請與我們聯繫。
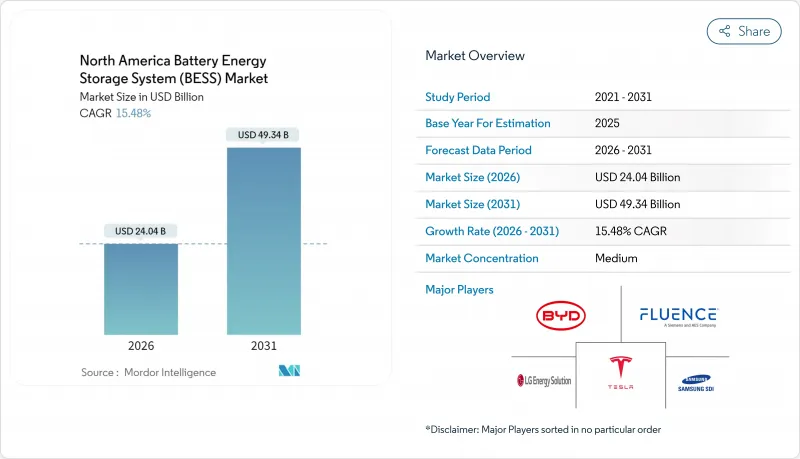
2025年北美電池能源儲存系統系統市值為208.2億美元,預計到2031年將達到493.4億美元,高於2026年的240.4億美元。
預測期(2026-2031 年)的複合年成長率預計為 15.48%。
聯邦稅額扣抵、國內電池製造以及由可再生能源併網、資料中心擴張和電網堵塞推動的電網級需求激增,共同支撐了這一成長。 《通膨控制法案》擴大了獨立儲能專案30%的投資稅額扣抵後,公共產業的採購活動加速,提高了計劃的內部報酬率,並刺激了商業市場的發展。同時,密西根州、喬治亞和亞利桑那州的超級工廠已將磷酸鋰鐵電池(LFP)的在地採購成本降低了20-30%,縮小了與燃氣調峰設備的成本差距,並縮短了前置作業時間。開發人員目前正致力於開發能夠連續運作數小時的資產,即使在批發電力價格波動的情況下,也能透過頻率調節、容量支付和能源套利獲得收益。隨著特斯拉、Fluence和LG能源解決方案等垂直整合型領導企業與純粹的整合商和自主開發計劃的公共產業競爭,競爭日益激烈。同時,釩液流電池和鐵空氣電池等長期儲能技術正在挑戰鋰離子電池在 8-12 小時和季節性運作週期中的現有地位。
北美電池能源儲存系統(BESS)市場趨勢與洞察
各州可再生能源強制性規定的快速擴展
加州SB100法案的目標是到2045年實現100%清潔電力,該法案規定採購11.5吉瓦的儲能容量。公用事業公司在2024年中期就超額完成了這一目標,確保了未來幾年開發案的穩定成長。紐約州強制要求到2030年達到6吉瓦的儲能容量,並提供獎勵以彌補市場收入缺口。同時,由於電力短缺期間電價上漲以及燃煤發電的逐步淘汰,儲能的經濟效益顯著提升,ERCOT在2024年達到了5吉瓦的併網申請量。明確的採購目標降低了資本風險,吸引了機構投資者,並透過使計劃設計與IEEE 2030.2互通性標準保持一致,提高了計劃的整體效率。強制性規定還提供了長期的市場可見性,使製造商能夠實現供應鏈本地化,並使貸款機構能夠建立反向槓桿債務。隨著越來越多的州從僅關注可再生的目標轉向明確包含儲能的清潔能源標準,對公用事業規模系統的基礎設施需求將顯著成長。
北美超級工廠降低磷酸鐵鋰電池成本
包括寧德時代(CATL)和LG能源解決方案公司在內的供應商已開始運作符合先進製造稅額扣抵政策的美國磷酸鐵鋰電池生產線,每千瓦時電池可享受35美元的稅收抵免,每千瓦時組件可享受10美元的稅收抵免。在地化生產可將公用事業規模儲能系統(BESS)的交付成本降低高達30%,並將採購前置作業時間從12-14個月縮短至6-8個月。此外,本地化生產還能幫助開發商規避針對中國進口商品徵收的25% 301條款關稅的影響。與公用事業公司簽訂的多年銷售協議可確保採購量並降低關稅風險,從而穩定企劃案融資融資的資本支出(CAPEX)預測。在地採購基地也有助於實現組件標準化和國產化率獎勵,進一步提高財務回報。
前期資本投入高,且原物料價格波動較大
儲能系統(BESS)的安裝成本仍然是聯合循環燃氣渦輪機(CCGT)容量價格的2.5-3倍,這限制了其在沒有碳定價系統的地區的普及。碳酸鋰價格從2024年初的每噸8萬美元暴跌至年底的每噸1.2萬美元,凸顯了採購的波動性,這使得固定價格的EPC合約更加複雜。鈷和鎳的供應地域集中,使NMC化學品面臨地緣政治風險。中國在2024年啟動的232條款關稅規避調查可能導致額外15-25%的關稅,進一步加劇了成本預測的不確定性。缺乏長期銷售協議的私人開發商難以將成本衝擊轉嫁給消費者,導致最終投資決策被推遲,尤其是在ERCOT和CAISO等收入波動較大的地區。
細分市場分析
到2025年,鋰離子電池技術在儲能電池市場仍將佔據91.10%的佔有率,這主要得益於成熟的磷酸鋰電池供應鏈和不斷下降的電芯價格。液流電池的市佔率為5.35%,正以30.43%的年成長率成長,主要得益於電力公司對8-12小時放電時間且不易發生熱失控的儲能設備的需求。德克薩斯州一個100兆瓦時的鋅電池先導計畫實現了1萬次循環,且性能劣化極小,凸顯了鋅電池與磷酸鐵鋰電池相比在耐久性方面的顯著優勢。由於太平洋西北地區電力公司在季節性電力供應提案方面優先考慮非鋰電池技術,液流電池儲能系統的市場規模預計將會擴大。儘管鈉離子電池在住宅儲能領域的測試已展現出在寒冷氣候下的潛力,但由於磷酸鐵鋰電池成本的快速下降,鉛酸電池在電力應用領域的市場佔有率仍在持續下降。
液流電池的普及應用表明,人們越來越認知到循環壽命經濟性以及功率和能量的獨立擴展性。奧勒岡州一個21兆瓦時的釩液流電池計劃與風力發電相結合,可提供多天的可靠供給能力,避免了四小時鋰電池設計所需的300%超額容量。鈉離子電池的原料成本更低,因此在對成本敏感的住宅市場,尤其是在加州NEM 3.0收費系統下,更具吸引力。隨著電力公司將採購規範轉向更長的續航時間,鋰電池在四小時供電以外的優勢可能會減弱。
2025年,併網系統佔總裝機量的88.20%,這得益於聯邦能源監理委員會(FERC)第841號命令以及企業積極參與批發電力市場。然而,由於礦山、軍事基地和偏遠離島對高成本柴油燃料替代品的需求,離網和微電網解決方案正以28.10%的複合年成長率快速成長。加拿大一個礦場微電網(50兆瓦時)減少了70%的柴油消耗,每年節省800萬美元,並減少了2.5萬噸二氧化碳排放。美國國防部在2024年為獨立基地撥款1.5億美元。阿拉斯加的一個村莊正在將可再生能源與儲能結合,以降低柴油成本0.40-0.60美元/千瓦時。混合微電網在加州和德克薩斯州越來越受歡迎,這種微電網既能保持與電網的連接,又能在野火和颶風期間獨立運作。
離網經濟模式著重降低燃料和輸電成本,儘管每千瓦時(kWh)的初始投資較高,但投資回報週期短。加勒比海一家度假村利用一套10兆瓦時(MWh)的系統,光用六年就收回了成本,節省了200萬美元的柴油燃料費用。混合模式提高了系統的韌性,同時實現了需量反應的貨幣化。更新後的IEEE 1547-2018標準要求從併網運行到獨立運行的無縫過渡,簡化了連接流程,並鼓勵工商業用戶採用此模式。
北美電池能源儲存系統(BESS) 市場報告按電池類型(例如鋰離子電池)、連接類型(併網/離網)、組件(例如電池組/支架、能源管理軟體)、能量容量範圍(例如 10-100 MWh、500 MWh+)、最終用戶應用(電力公司、商業/工業、住宅)和地區(美國、加拿大、墨西哥)和地區進行細分。
其他福利:
- Excel格式的市場預測(ME)表
- 3個月的分析師支持
目錄
第1章 引言
- 研究假設和市場定義
- 調查範圍
第2章調查方法
第3章執行摘要
第4章 市場情勢
- 市場概覽
- 市場促進因素
- 各州可再生能源強制性規定激增
- 北美超級工廠磷酸鐵鋰電池成本下降
- 獨立式儲能設施的稅額扣抵
- 資料中心建置規模不斷擴大,電力需求量龐大
- 自由市場中利潤結構的創新
- 人工智慧最佳化的儲能系統資產管理
- 市場限制
- 與抽水蓄能和LDES的競爭
- 高昂的初始資本投資成本和原物料價格波動
- 位置地方消防安全選址措施
- 關稅和貿易問題帶來的成本衝擊
- 供應鏈分析
- 監管環境
- 技術展望
- 波特五力模型
- 新進入者的威脅
- 供應商的議價能力
- 買方的議價能力
- 替代品的威脅
- 競爭對手之間的競爭
- 投資分析
第5章 市場規模與成長預測
- 依電池類型
- 鋰離子電池(磷酸鋰鐵(LFP)、鎳錳鈷鋰(NMC)、鈦酸鋰(LTO))
- 鉛酸電池
- 液流電池(釩氧化還原電池,鋅溴電池)
- 鈉離子
- 其他電池技術(鎳鎘電池、混合型超級電容)
- 按連線類型
- 併網(連接到電力公司)
- 離網(微電網、混合電網)
- 按組件
- 電池組支架
- 電源轉換系統(PCS)
- 能源管理軟體(EMS)
- 工廠相關設備及服務
- 按能量容量範圍
- 小於10兆瓦時
- 10~100 MWh
- 100~500 MWh
- 超過500兆瓦時
- 透過最終用戶使用
- 對於電力公司
- 商業和工業
- 住宅
- 按地區
- 美國
- 加拿大
- 墨西哥
第6章 競爭情勢
- 市場集中度
- 策略性舉措(併購、聯盟、購電協議)
- 市場佔有率分析(主要企業的市場排名和佔有率)
- 公司簡介
- Tesla Inc.
- Fluence Energy Inc.
- LG Energy Solution Ltd.
- Samsung SDI Co. Ltd.
- BYD Company Ltd.
- Panasonic Holdings Corp.
- Saft(TotalEnergies)
- Contemporary Amperex Technology Ltd.
- AES Corporation
- GE Vernova
- ABB Ltd.
- Siemens Energy
- Schneider Electric SE
- Eos Energy Enterprises
- NEC Energy Solutions
- Enel North America
- NextEra Energy Resources
- Sunverge Energy
- Powin LLC
- Wartsila Corporation
第7章 市場機會與未來展望
The North America Battery Energy Storage System Market was valued at USD 20.82 billion in 2025 and estimated to grow from USD 24.04 billion in 2026 to reach USD 49.34 billion by 2031, at a CAGR of 15.48% during the forecast period (2026-2031).
Federal tax credits, domestic cell manufacturing, and fast-rising grid-scale demand from renewable energy integration, data center build-outs, and transmission congestion underpin this growth. Utility procurement accelerated after the Inflation Reduction Act extended the 30% investment tax credit to stand-alone storage, improving project internal rates of return and unlocking merchant-market development. Meanwhile, Michigan, Georgia, and Arizona gigafactories are reducing the landed costs of lithium-iron-phosphate (LFP) by 20%-30%, thereby narrowing the cost gap with gas peakers and shortening lead times. Developers now pursue multi-hour assets that stack revenues from frequency regulation, capacity payments, and energy arbitrage even as wholesale spreads remain volatile. Competitive intensity is rising as vertically integrated leaders, such as Tesla, Fluence, and LG Energy Solution, vie with pure-play integrators and utilities that self-develop projects. Meanwhile, long-duration alternatives, including vanadium flow and iron-air batteries, challenge lithium-ion incumbency for 8-to-12-hour and seasonal duty cycles.
North America Battery Energy Storage System (BESS) Market Trends and Insights
Surging State-Level Renewable Mandates
California's SB 100 targets 100% clean electricity by 2045 and sets an 11.5 GW storage procurement that utilities exceeded by mid-2024, ensuring a robust multi-year development queue. New York mandates 6 GW by 2030 with incentives that bridge merchant-revenue gaps, while ERCOT registered 5 GW of 2024 interconnection requests as scarcity pricing and coal retirements drove storage economics. Clear procurement targets de-risk capital, attract institutional investors, and align project designs with IEEE 2030.2 interoperability standards, thereby enhancing overall project efficiency. Mandates also signal long-term market visibility, enabling manufacturers to localize supply chains and lenders to structure back-levered debt. As more states shift from renewables-only targets to clean-energy standards that explicitly include storage, the baseline demand for utility-scale systems expands significantly.
Falling LFP Battery Costs from NA Gigafactories
CATL, LG Energy Solution, and other suppliers have commissioned U.S. LFP cell lines subsidized by an advanced-manufacturing credit worth USD 35 per kWh for cells and USD 10 per kWh for modules. Domestic production compresses delivered utility-scale BESS costs by up to 30%, shrinks procurement lead times from 12-14 months to 6-8 months, and shields developers from 25% Section 301 tariffs on Chinese imports. Multi-year offtake deals with utilities lock in volume, while tariff-risk reduction stabilizes CAPEX assumptions for project finance. The localized supply base is also catalyzing component standardization and higher domestic content bonuses, which further improve financial returns.
High Up-Front CAPEX & Raw-Material Swings
Installed BESS costs remain 2.5-3X the capacity price of combined-cycle gas turbines, limiting uptake where carbon pricing is absent. Lithium carbonate prices plummeted from USD 80,000/t in early 2024 to USD 12,000/t by year-end, highlighting procurement volatility that complicates fixed-price EPC contracts. Cobalt and nickel supply is geographically concentrated, exposing NMC chemistries to geopolitical risk. A 2024 Section 232 probe into Chinese tariff circumvention threatens additional 15%-25% duties, further muddying cost forecasts. Merchant developers lacking long-term offtake struggle to pass through cost shocks, slowing final investment decisions, especially in ERCOT and CAISO, where revenue spreads fluctuate.
Other drivers and restraints analyzed in the detailed report include:
- IRA Stand-Alone Storage Tax Credit
- Grid-Hungry Data-Center Build-Out
- Local Fire-Safety Siting Moratoria
For complete list of drivers and restraints, kindly check the Table Of Contents.
Segment Analysis
Lithium-ion technologies maintained a 91.10% share of the battery energy storage system market in 2025, driven by mature LFP supply chains and declining cell prices. Flow batteries, although with a 5.35% share, are growing at a 30.43% annual rate as utilities seek 8- to 12-hour discharge assets that are immune to thermal runaway. A 100 MWh zinc-battery pilot in Texas achieved 10,000 cycles with minimal fade, highlighting the longevity gap compared to LFP. The battery energy storage system market size for flow technologies is poised to benefit from Pacific Northwest utility RFPs that favor non-lithium chemistries for seasonal firming. Sodium-ion trials for residential storage show promise in cold climates, while lead-acid continues to lose ground in utility applications due to the rapid decline in LFP costs.
Flow battery adoption indicates a growing recognition of cycle-life economics and the independent scaling of power versus energy. A 21 MWh vanadium project in Oregon, coupled with wind, provides multi-day firm capacity, avoiding the 300% oversizing required by four-hour lithium designs. Sodium-ion's lower raw-material exposure positions it for cost-sensitive residential markets, especially under California's NEM 3.0 tariffs. Shifting utility procurement specs toward long-duration performance will progressively erode lithium's dominance beyond the 4-hour niche.
On-grid systems captured 88.20% of 2025 deployments, supported by FERC Order 841 and robust participation in the wholesale market. However, off-grid and microgrid solutions are expanding at a 28.10% CAGR as mines, military bases, and islands displace expensive diesel. A 50 MWh Canadian mine microgrid reduced diesel use by 70%, saving USD 8 million annually and eliminating 25,000 t CO2. The U.S. Department of Defense earmarked USD 150 million in 2024 for islandable bases, while Alaska villages blend renewables and storage to reduce diesel costs by USD 0.40-0.60 kWh. Hybrid microgrids that retain grid ties but can island during wildfires or hurricanes are proliferating in California and Texas.
Off-grid economics center on avoided fuel and transmission costs, enabling rapid paybacks despite higher per-kWh CAPEX. A Caribbean resort's 10 MWh system eliminated a USD 2 million diesel bill with a six-year payback. Hybrid models also monetize demand-response payments while enhancing resilience. The updated IEEE 1547-2018 standards mandate seamless grid-to-island transitions, simplifying interconnection and fostering broader adoption among commercial and industrial (C&I) users.
The North America Battery Energy Storage System (BESS) Market Report is Segmented by Battery Type (Lithium-Ion, and More), Connection Type (On-Grid and Off-Grid), Component (Battery Pack and Racks, Energy Management Software, and More), Energy Capacity Range (10 To 100 MWh, Above 500 MWh, and More), End-User Application (Utility, Commercial and Industrial, and Residential), and Geography (United States, Canada, and Mexico).
List of Companies Covered in this Report:
- Tesla Inc.
- Fluence Energy Inc.
- LG Energy Solution Ltd.
- Samsung SDI Co. Ltd.
- BYD Company Ltd.
- Panasonic Holdings Corp.
- Saft (TotalEnergies)
- Contemporary Amperex Technology Ltd.
- AES Corporation
- GE Vernova
- ABB Ltd.
- Siemens Energy
- Schneider Electric SE
- Eos Energy Enterprises
- NEC Energy Solutions
- Enel North America
- NextEra Energy Resources
- Sunverge Energy
- Powin LLC
- Wartsila Corporation
Additional Benefits:
- The market estimate (ME) sheet in Excel format
- 3 months of analyst support
TABLE OF CONTENTS
1 Introduction
- 1.1 Study Assumptions & Market Definition
- 1.2 Scope of the Study
2 Research Methodology
3 Executive Summary
4 Market Landscape
- 4.1 Market Overview
- 4.2 Market Drivers
- 4.2.1 Surging state-level renewable mandates
- 4.2.2 Falling LFP battery costs from NA gigafactories
- 4.2.3 IRA stand-alone storage tax credit
- 4.2.4 Grid-hungry data-centre build-out
- 4.2.5 Merchant-market revenue-stack innovation
- 4.2.6 AI-optimised BESS asset management
- 4.3 Market Restraints
- 4.3.1 Pumped-hydro & LDES competition
- 4.3.2 High up-front CAPEX & raw-material swings
- 4.3.3 Local fire-safety siting moratoria
- 4.3.4 Tariff / trade-case cost shocks
- 4.4 Supply-Chain Analysis
- 4.5 Regulatory Landscape
- 4.6 Technological Outlook
- 4.7 Porter's Five Forces
- 4.7.1 Threat of New Entrants
- 4.7.2 Bargaining Power of Suppliers
- 4.7.3 Bargaining Power of Buyers
- 4.7.4 Threat of Substitutes
- 4.7.5 Competitive Rivalry
- 4.8 Investment Analysis
5 Market Size & Growth Forecasts
- 5.1 By Battery Type
- 5.1.1 Lithium-ion (Lithium Iron Phosphate (LFP), Nickel-Manganese-Cobalt (NMC), Lithium Titanate (LTO))
- 5.1.2 Lead-acid
- 5.1.3 Flow Battery (Vanadium Redox, Zinc-Bromine)
- 5.1.4 Sodium-ion
- 5.1.5 Other Battery Technologies (NiCd, Hybrid Super-capacitors)
- 5.2 By Connection Type
- 5.2.1 On-Grid (Utility Interconnected)
- 5.2.2 Off-Grid (Micro-Grid, Hybrid)
- 5.3 By Component
- 5.3.1 Battery Pack and Racks
- 5.3.2 Power Conversion System (PCS)
- 5.3.3 Energy Management Software (EMS)
- 5.3.4 Balance-of-Plant and Services
- 5.4 By Energy Capacity Range
- 5.4.1 Below 10 MWh
- 5.4.2 10 to 100 MWh
- 5.4.3 100 to 500 MWh
- 5.4.4 Above 500 MWh
- 5.5 By End-user Application
- 5.5.1 Utility
- 5.5.2 Commercial and Industrial
- 5.5.3 Residential
- 5.6 By Geography
- 5.6.1 United States
- 5.6.2 Canada
- 5.6.3 Mexico
6 Competitive Landscape
- 6.1 Market Concentration
- 6.2 Strategic Moves (M&A, Partnerships, PPAs)
- 6.3 Market Share Analysis (Market Rank/Share for key companies)
- 6.4 Company Profiles (includes Global level Overview, Market level overview, Core Segments, Financials as available, Strategic Information, Products & Services, and Recent Developments)
- 6.4.1 Tesla Inc.
- 6.4.2 Fluence Energy Inc.
- 6.4.3 LG Energy Solution Ltd.
- 6.4.4 Samsung SDI Co. Ltd.
- 6.4.5 BYD Company Ltd.
- 6.4.6 Panasonic Holdings Corp.
- 6.4.7 Saft (TotalEnergies)
- 6.4.8 Contemporary Amperex Technology Ltd.
- 6.4.9 AES Corporation
- 6.4.10 GE Vernova
- 6.4.11 ABB Ltd.
- 6.4.12 Siemens Energy
- 6.4.13 Schneider Electric SE
- 6.4.14 Eos Energy Enterprises
- 6.4.15 NEC Energy Solutions
- 6.4.16 Enel North America
- 6.4.17 NextEra Energy Resources
- 6.4.18 Sunverge Energy
- 6.4.19 Powin LLC
- 6.4.20 Wartsila Corporation
7 Market Opportunities & Future Outlook
- 7.1 White-space & Unmet-Need Assessment
 電池能源儲存系統市場預測至2034年—按電池技術、輸出容量、應用、最終用戶和地區分類的全球分析
 電池能源儲存系統(BESS):市場佔有率分析、產業趨勢與統計及成長預測(2026-2031)
 電池能源儲存系統市場:按組件、電池類型、能量容量、連接方式、部署方式和應用分類-2026年至2032年全球市場預測
 2026年全球電錶前電池市場報告2026年全球電池租賃即服務市場報告
 全球電池能源儲存系統市場:按電池類型、應用、所有權/部署模式、連接方式、國家和地區分類-產業分析、市場規模、佔有率及預測(2025-2032年)
 全球電池能源儲存系統市場規模、佔有率、趨勢和成長分析報告(2026-2034年)2026年全球電池能源儲存系統市場報告
 電池儲能系統市場-全球產業規模、佔有率、趨勢、機會及預測(依電池類型、連接類型、能源容量、應用、區域及競爭格局分類,2021-2031年預測)
 電池能源儲存系統市場規模、佔有率和趨勢分析報告:按電池類型、應用領域、地區和細分市場預測(2026-2033 年)