


 |
市場調查報告書
商品編碼
2035067
工業氣體:市場佔有率分析、產業趨勢與統計、成長預測(2026-2031)Industrial Gas - Market Share Analysis, Industry Trends & Statistics, Growth Forecasts (2026 - 2031) |
||||||
※ 本網頁內容可能與最新版本有所差異。詳細情況請與我們聯繫。
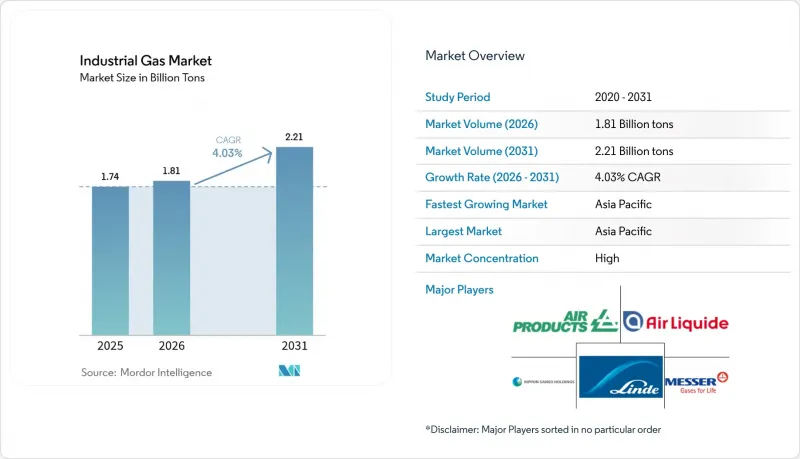
預計工業氣體市場將從 2025 年的 17.4 億噸成長到 2026 年的 18.1 億噸,然後從 2026 年到 2031 年以 4.03% 的複合年成長率成長,到 2031 年達到 22.1 億噸。
鋼鐵、半導體和化學製造商的強勁需求支撐著這一成長,而綠色氫氣、高純度氧氣和食品級二氧化碳等產品的創新則領先了價值創造而非數量擴張。生產商正在加強現場供應模式以降低物流風險,大規模能源用戶則簽訂了長達數十年的供應合約以鎖定電力成本。隨著半導體製造的地域多角化,對高純度氮氣和氬氣的需求正轉向美國和歐洲,但亞洲在總供應量方面仍保持主導地位。同時,氦氣回收項目、碳捕集作業和小型空氣分離裝置正在吸引現有企業和基礎設施投資者的新資本。
全球工業氣體市場趨勢與洞察
新興國家的快速工業化
亞洲製造業的強勁擴張,尤其是在中國和印度,正在推動對氧氣和氮氣等通用氣體的基本負載需求。光是印度西部就集中了鋼鐵廠、石化產業叢集和化肥聯合企業,這些企業共同支撐著當地的空氣分離能力。地方政府正在推行「印度製造」激勵政策,鼓勵投資於使用高純度氮氣和氬氣的電子組裝、太陽能電池生產和電動車供應鏈。同時,從地鐵到新煉油廠等基礎設施項目也不斷擴展,形成適合小批量和微量散裝貨物配送的分散式需求中心。美國能源資訊署(EIA)預測,到2050年,亞洲的天然氣消費量將成長兩倍,其中80%預計將用於工業用途。這顯示製程氣體的需求規模龐大。
綠色氫能的推廣正在推動現場電解合約的成長。
脫碳目標正在加速低碳氫化合物的普及應用,促使化學、鋼鐵和重型運輸企業簽訂長期供應合約。空氣產品公司與ACWA Power和NEOM合作,正在沙烏地阿拉伯開發一座價值85億美元的可再生能源驅動電解工廠,預計每年可供應65萬噸綠色氨原料。類似的項目也在歐盟、澳洲和美國建設中,總合年產量超過110萬噸。這些項目正在推動對氮氣(用於惰性)和氧氣(副產品)等相關氣體的需求,並強化現場發電作為減少卡車運輸排放氣體和功率損耗的最佳供應模式。
在北美擴大氦氣供應和安全平台
全球氦氣供需緊張持續影響核磁共振造影系統的運作、半導體製造以及航太領域的惰性流程。位於德克薩斯州的策略性氦氣倉儲設施Cliffside Helium Systems目前仍處於管理機構的控制之下,但仍維持對關鍵用戶的最低供應量。 Quantum Technology Corp.在加拿大西部新建的氦氣精煉廠已投入運作——這是40年來的首家——確保了小規模但至關重要的區域供應冗餘。然而,氦氣價格在2024年下半年飆升,給採購預算帶來壓力,並刺激了終端用戶對回收、精煉和回收再生用設備的投資。這種價格波動導致新建晶圓廠在資本投資規劃方面更加謹慎,並在短期內抑制了整體消費成長。
細分市場分析
預計到2025年,氧氣仍將佔據工業氣體市場31.65%的主導佔有率,並將繼續超過整體需求成長,這主要得益於鋼鐵製造商向直接還原鐵(DRI)爐的轉型以及醫院擴大高流量人工呼吸器的使用。 2024年,林德集團和液化空氣集團運作了20多套專用於醫用氧氣的真空變壓式吸附裝置,反映了疫情後的基準需求。同時,名古屋大學的研究表明,吸附和溶解膜能夠以更低的能耗分離氧氣和氬氣,這表明未來在超高純度應用領域,此類膜有望降低成本。
氮氣需求主要來自半導體惰性、雷射切割以及高階食品生產線的調氣包裝。該領域受益於多種供應形式的均衡組合,包括用於金屬加工廠的鋼瓶、用於電子無塵室的液態氮以及冷庫中心的現場氮氣產生器。由於乙醇工廠原料供應中斷,二氧化碳供應在2024年下降。然而,啤酒廠的內部回收避免了飲料製造商面臨嚴重的供不應求。
《工業氣體市場報告》依產品類型(氮氣、氧氣、二氧化碳等)、供應形式(包裝/鋼瓶、散裝液體等)、終端用戶產業(化學加工和精煉、電子和半導體等)以及地區(亞太地區、北美地區、歐洲地區、南美地區、中東和非洲地區)進行細分。市場預測以噸為單位。
區域分析
到2025年,亞洲將在石化、鋼鐵和電子產業的帶動下,佔據工業氣體市場42.55%的主導地位。中國一體化的鋼鐵產能和印度強勁的基礎設施投資,使得去年新增空分裝置(ASU)數量超過600套/天。各區域政府都在積極推進碳捕集試點計畫和綠色氫氣出口走廊,以使工業氣體分配與淨零排放藍圖保持一致。在競爭激烈的市場環境下,全球領導者和當地企業正透過合資企業實現生產在地化,同時維持世界級的工程標準。
北美地區擁有成熟的管道網路,為墨西哥灣沿岸的煉油廠供氣,以及覆蓋中西部和東北部的靈活的液化氣(LGL)通用運輸網路,因此在市場上佔據了相當大的交易量。 2012年至2022年間,美國煉油廠的氫氣採購量增加了29%,顯示其氫氣來源正逐步從內部重整設施轉向外部採購。為控制通膨,清潔能源計畫正在蓬勃發展,推動低碳氨、永續航空燃料和二氧化碳封存計畫的發展,而這些計畫都需要專用工業氣體。加拿大正在崛起成為一個重要的氦氣樞紐,為長期以來由美國土地管理局(BLM)儲氣系統主導的市場增添了新的保障。
歐洲仍然是增值中心,專注於發展綠色氫能走廊和食品級碳捕獲技術。像液化空氣集團和林德集團這樣的公司正在將可再生能源購買協議與質子交換膜電解相結合,以支持航運和長途貨運的脫碳。更嚴格的氟化氣體法規和甲烷排放標準正迫使冷凍設備製造商轉向天然冷媒,進一步豐富了該地區的冷媒組合。
其他好處:
- Excel格式的市場預測(ME)表
- 3個月的分析師支持
目錄
第1章:引言
- 研究假設和市場定義
- 調查範圍
第2章:調查方法
第3章執行摘要
第4章 市場狀況
- 市場概覽
- 市場促進因素
- 新興國家的快速工業化
- 歐盟和澳洲對綠色氫能的推動,促進了現場電解合約的成長。
- 美國及中東及北非(MENA)地區低碳直接還原鐵鋼廠的氧吸收情形
- 歐盟在啤酒廠和汽水廠開展的二氧化碳捕集與再利用項目
- 北美氦氣供應和安全平台的擴展
- 市場限制因素
- 大量資本投資和高營運成本
- 嚴格的安全和環境法規
- 原物料和能源價格波動
- 價值鏈分析
- 監理展望
- 波特五力模型
- 供應商的議價能力
- 買方的議價能力
- 新進入者的威脅
- 替代品的威脅
- 競爭公司之間的競爭
第5章 市場規模與成長預測
- 依產品類型
- 氮
- 氧
- 二氧化碳
- 氫
- 氦
- 氬氣
- 氨
- 甲烷
- 丙烷
- 丁烷
- 其他產品類型
- 按供應方式
- 包裝/汽缸
- 散裝液體公司
- 現場(隧道)生成
- 按最終用戶行業分類
- 化學處理與提純
- 電子和半導體
- 食品/飲料加工
- 石油和天然氣
- 金屬生產和加工
- 醫療和製藥
- 汽車和交通運輸
- 能源和發電
- 其他產業(航太、水處理和用水和污水處理)
- 按地區
- 亞太地區
- 中國
- 印度
- 日本
- 韓國
- ASEAN
- 澳洲
- 紐西蘭
- 亞太其他地區
- 北美洲
- 美國
- 加拿大
- 墨西哥
- 歐洲
- 德國
- 英國
- 法國
- 義大利
- 北歐國家
- 其他歐洲地區
- 南美洲
- 巴西
- 阿根廷
- 南美洲其他地區
- 中東和非洲
- 沙烏地阿拉伯
- 阿拉伯聯合大公國
- 土耳其
- 南非
- 奈及利亞
- 其他中東和非洲地區
- 亞太地區
第6章 競爭情勢
- 市場集中度
- 策略趨勢
- 市佔率分析
- 公司簡介
- Air Liquide
- Air Products and Chemicals Inc.
- Air Water Inc.
- Asia Technical Gas Co Pte Ltd.
- BASF SE
- Bhuruka Gases Ltd.
- Ellenbarrie Industrial Gases Limited
- Gasco
- Goyal MG gases pvt.ltd
- Gruppo SIAD
- Gulf Cryo
- Iwatani Corporation
- Linde plc
- Messer SE & Co. KGaA
- Nippon Sanso Holdings Corporation
- Oxair
- PT Samator Indo Gas Tbk
- Resonac Holdings Corporation
- Sapio Group
- SOL Group
- Southern Industrial Gas Sdn Bhd
- Yingde Gas Shanghai
第7章 市場機會與未來展望
The Industrial Gas Market size is expected to grow from 1.74 billion tons in 2025 to 1.81 billion tons in 2026 and is forecast to reach 2.21 billion tons by 2031 at 4.03% CAGR over 2026-2031.
Healthy demand from steel, semiconductor, and chemical producers underpins this growth, while product innovation around green-hydrogen, high-purity oxygen, and food-grade carbon dioxide keeps value creation ahead of volume expansion. Producers are reinforcing on-site supply models to reduce logistics exposure, and large energy users are signing multi-decade supply contracts that lock in power costs. Regionalization of semiconductor fabrication is shifting high-purity nitrogen and argon flows toward the United States and Europe, even as Asia retains overall volume leadership. At the same time, helium recovery projects, carbon capture ventures, and small-footprint air-separation units are attracting fresh capital from both incumbents and infrastructure investors.
Global Industrial Gas Market Trends and Insights
Rapid Industrialization in Emerging Economies
Robust manufacturing expansion across Asia, especially in China and India, is lifting base-load demand for volume gases such as oxygen and nitrogen. Western India alone houses a large concentration of steel mills, petrochemical clusters, and fertilizer complexes that collectively anchor localized air-separation capacity. Regional authorities are pressing ahead with Make-in-India incentives, encouraging investment in electronics assembly, solar-cell production, and electric-vehicle supply chains that use high-purity nitrogen and argon. Parallel infrastructure projects-from metro rail to greenfield refineries-are extending distributed demand pockets that favor packaged and microbulk deliveries. The U.S. Energy Information Administration projects Asian natural-gas consumption will triple by 2050, with 80% channelled into industry, a proxy for the scale of process-gas requirements.
Green-Hydrogen Push Driving On-Site Electrolysis Contracts
Decarbonization targets are accelerating the adoption of low-carbon hydrogen, prompting chemical, steel, and heavy-transport operators to lock in long-term supply agreements. In partnership with ACWA Power and NEOM, Air Products is developing a USD 8.5 billion renewable-powered electrolysis plant in Saudi Arabia that will supply 650,000 t/y of green ammonia feedstock. Similar contracts across the European Union, Australia, and the United States are under construction, collectively exceeding 1.1 million t/y of planned output. These projects boost demand for associated gases such as nitrogen (for inerting) and oxygen (as a by-product), and they reinforce on-site generation as the preferred delivery model, reducing trucking emissions and power losses.
Helium Supply-Security Platforms Expanding in North America
Tight global helium balances continue to disrupt MRI equipment uptime, semiconductor fabrication, and aerospace inerting. The Cliffside Helium System in Texas, a strategic storage complex, remains under receivership yet sustains a minimum allocation for critical users. Quantum Technology Corp. started Western Canada's first new helium refinery in four decades, adding small but important regional redundancy. Nonetheless, helium prices rose sharply in late 2024, pressuring procurement budgets and encouraging end-users to invest in recovery, purification, and recycling skids. This volatility underpins cautious CAPEX planning for greenfield fabs and acts as a near-term drag on overall consumption growth.
Other drivers and restraints analyzed in the detailed report include:
- Oxygen Uptake from Low-Carbon DRI Steel Plants
- CO2 Capture & Re-Use Projects in EU Breweries & Soda Plants
- High Capital Investment and Operational Costs
For complete list of drivers and restraints, kindly check the Table Of Contents.
Segment Analysis
Oxygen retained a commanding 31.65% share of the industrial gases market size in 2025 and continues to outpace overall volume growth as steelmakers migrate to DRI furnaces and hospitals expand high-flow ventilator capacity. During 2024, Linde and Air Liquide commissioned more than 20 vacuum pressure swing adsorption units dedicated to medical oxygen, reflecting post-pandemic baseline demand. In parallel, research at Nagoya University demonstrated an adsorptive-dissolution membrane capable of separating oxygen from argon at lower energy intensity, pointing toward future cost savings in ultra-high-purity applications.
Nitrogen is driven by semiconductor inerting, laser-cutting, and modified-atmosphere packaging for premium food lines. The segment benefits from a balanced mix of delivery modes: packaged cylinders for metal-fabrication shops, merchant liquid for electronics clean rooms, and on-site generators at cold-storage hubs. Carbon dioxide volume slipped in 2024 because of feedstock disruptions at ethanol plants; however, in-house capture at breweries cushioned beverage producers against outright shortages.
The Industrial Gases Market Report is Segmented by Product Type (Nitrogen, Oxygen, Carbon Dioxide, and More), Mode of Supply (Packaged/Cylinder, Merchant Bulk Liquid, and More), End-User Industry (Chemical Processing and Refining, Electronics and Semiconductor, and More), and Geography (Asia-Pacific, North America, Europe, South America, and Middle East and Africa). The Market Forecasts are Provided in Terms of Volume (tons).
Geography Analysis
Asia accounted for a dominant 42.55% share of the industrial gases market size in 2025, driven by strong petrochemical, ferrous metallurgy, and electronics clusters. China's integrated steel capacity and India's robust infrastructure spending jointly supported more than 600 t/d of new ASU capacity additions last year. Regional governments are promoting carbon capture pilots and green-hydrogen export corridors, aligning industrial gas flows with net-zero roadmaps. The competitive terrain features joint ventures between global majors and domestic firms that localize production while retaining world-scale engineering standards.
North America, characterized by mature pipelines supplying Gulf Coast refineries and adaptable merchant-liquid networks serving the Midwest and Northeast, demonstrates significant volume in the market. Purchases of hydrogen by U.S. refiners rose 29% between 2012 and 2022, illustrating a gradual shift from captive reformers to outsourced supply. Ongoing inflation-reduction incentives for clean-energy projects are catalyzing low-carbon ammonia, sustainable aviation fuel, and CO2 sequestration ventures, each requiring dedicated industrial gas inputs. Canada is emerging as a niche helium hub, adding redundancy to a market long dominated by the U.S. Bureau of Land Management's storage system.
Europe remains a value-added epicenter, focusing on green-hydrogen corridors and food-grade carbon capture. Air Liquide, Linde, and others are synchronizing renewable power purchase agreements with proton-exchange membrane electrolyzers to support maritime shipping and long-haul trucking decarbonization. Stricter F-gas regulation and methane thresholds are nudging refrigeration OEMs toward natural refrigerants, further diversifying gas portfolios in the region.
- Air Liquide
- Air Products and Chemicals Inc.
- Air Water Inc.
- Asia Technical Gas Co Pte Ltd.
- BASF SE
- Bhuruka Gases Ltd.
- Ellenbarrie Industrial Gases Limited
- Gasco
- Goyal MG gases pvt.ltd
- Gruppo SIAD
- Gulf Cryo
- Iwatani Corporation
- Linde plc
- Messer SE & Co. KGaA
- Nippon Sanso Holdings Corporation
- Oxair
- PT Samator Indo Gas Tbk
- Resonac Holdings Corporation
- Sapio Group
- SOL Group
- Southern Industrial Gas Sdn Bhd
- Yingde Gas Shanghai
Additional Benefits:
- The market estimate (ME) sheet in Excel format
- 3 months of analyst support
TABLE OF CONTENTS
1 Introduction
- 1.1 Study Assumptions and Market Definition
- 1.2 Scope of the Study
2 Research Methodology
3 Executive Summary
4 Market Landscape
- 4.1 Market Overview
- 4.2 Market Drivers
- 4.2.1 Rapid Industrialization in Emerging Economies
- 4.2.2 Green-Hydrogen Push Driving On-Site Electrolysis Contracts in EU and Australia
- 4.2.3 Oxygen Uptake from Low-Carbon DRI Steel Plants in US and MENA
- 4.2.4 CO2 Capture and Re-Use Projects in EU Breweries and Soda Plants
- 4.2.5 Helium Supply-Security Platforms Expanding in North America
- 4.3 Market Restraints
- 4.3.1 High Capital Investment and Operational Costs
- 4.3.2 Stringent Safety and Environmental Regulations
- 4.3.3 Volatility in Raw Material and Energy Prices
- 4.4 Value Chain Analysis
- 4.5 Regulatory Outlook
- 4.6 Porter's Five Forces
- 4.6.1 Bargaining Power of Suppliers
- 4.6.2 Bargaining Power of Buyers
- 4.6.3 Threat of New Entrants
- 4.6.4 Threat of Substitutes
- 4.6.5 Competitive Rivalry
5 Market Size and Growth Forecasts (Volume)
- 5.1 By Product Type
- 5.1.1 Nitrogen
- 5.1.2 Oxygen
- 5.1.3 Carbon Dioxide
- 5.1.4 Hydrogen
- 5.1.5 Helium
- 5.1.6 Argon
- 5.1.7 Ammonia
- 5.1.8 Methane
- 5.1.9 Propane
- 5.1.10 Butane
- 5.1.11 Other Product Types
- 5.2 By Mode of Supply
- 5.2.1 Packaged/Cylinder
- 5.2.2 Merchant Bulk Liquid
- 5.2.3 On-Site (Tonnage) Generation
- 5.3 By End-user Industry
- 5.3.1 Chemical Processing and Refining
- 5.3.2 Electronics and Semiconductor
- 5.3.3 Food and Beverage Processing
- 5.3.4 Oil and Gas
- 5.3.5 Metal Production and Fabrication
- 5.3.6 Medical and Pharmaceutical
- 5.3.7 Automotive and Transportation
- 5.3.8 Energy and Power Generation
- 5.3.9 Other Industries (Aerospce and water and waste Water Treatment)
- 5.4 By Geography
- 5.4.1 Asia-Pacific
- 5.4.1.1 China
- 5.4.1.2 India
- 5.4.1.3 Japan
- 5.4.1.4 South Korea
- 5.4.1.5 ASEAN
- 5.4.1.6 Australia
- 5.4.1.7 New Zealand
- 5.4.1.8 Rest of Asia-Pacific
- 5.4.2 North America
- 5.4.2.1 United States
- 5.4.2.2 Canada
- 5.4.2.3 Mexico
- 5.4.3 Europe
- 5.4.3.1 Germany
- 5.4.3.2 United Kingdom
- 5.4.3.3 France
- 5.4.3.4 Italy
- 5.4.3.5 Nordics
- 5.4.3.6 Rest of Europe
- 5.4.4 South America
- 5.4.4.1 Brazil
- 5.4.4.2 Argentina
- 5.4.4.3 Rest of South America
- 5.4.5 Middle East and Africa
- 5.4.5.1 Saudi Arabia
- 5.4.5.2 United Arab Emirates
- 5.4.5.3 Turkey
- 5.4.5.4 South Africa
- 5.4.5.5 Nigeria
- 5.4.5.6 Rest of Middle East and Africa
- 5.4.1 Asia-Pacific
6 Competitive Landscape
- 6.1 Market Concentration
- 6.2 Strategic Moves
- 6.3 Market Share Analysis
- 6.4 Company Profiles (includes Global level Overview, Market level overview, Core Segments, Financials as available, Strategic Information, Market Rank/Share for key companies, Products and Services, and Recent Developments)
- 6.4.1 Air Liquide
- 6.4.2 Air Products and Chemicals Inc.
- 6.4.3 Air Water Inc.
- 6.4.4 Asia Technical Gas Co Pte Ltd.
- 6.4.5 BASF SE
- 6.4.6 Bhuruka Gases Ltd.
- 6.4.7 Ellenbarrie Industrial Gases Limited
- 6.4.8 Gasco
- 6.4.9 Goyal MG gases pvt.ltd
- 6.4.10 Gruppo SIAD
- 6.4.11 Gulf Cryo
- 6.4.12 Iwatani Corporation
- 6.4.13 Linde plc
- 6.4.14 Messer SE & Co. KGaA
- 6.4.15 Nippon Sanso Holdings Corporation
- 6.4.16 Oxair
- 6.4.17 PT Samator Indo Gas Tbk
- 6.4.18 Resonac Holdings Corporation
- 6.4.19 Sapio Group
- 6.4.20 SOL Group
- 6.4.21 Southern Industrial Gas Sdn Bhd
- 6.4.22 Yingde Gas Shanghai
7 Market Opportunities and Future Outlook
- 7.1 Growing Demand for Low-Carbon Gases in the Coming Years
- 7.2 White-space and Unmet-Need Assessment
 工業氣體市場預測至2034年-按氣體類型、分銷方式、應用、最終用戶和地區分類的全球分析
 塑膠和橡膠產業工業氣體市場:2026-2032年全球市場預測(按氣體類型、應用、供應形式、包裝、純度等級和分銷管道分類)工業氣體市場:按類型、相態、供應形式、應用和最終用戶分類-2026-2032年全球市場預測
 工業氣體市場:依類型、供應類型、終端用戶產業和地區劃分 - 全球預測至 2036 年
 工業氣體市場分析及預測(至2035年):類型、產品類型、應用、技術、最終用戶、形式、製程、服務、設備、解決方案
 工業氣體市場規模、佔有率、趨勢及預測(按類型、應用、供應類型及地區分類),2026-2034年
 2026年全球工業氣體玻璃產業市場報告工業氣體-金屬及金屬加工全球市場報告(2026年)2026年全球工業氣體市場報告全球塑膠和橡膠產業工業氣體市場報告(2026 年)