


 |
市場調查報告書
商品編碼
2035010
ESG軟體:市場佔有率分析、產業趨勢與統計、成長預測(2026-2031年)ESG Software - Market Share Analysis, Industry Trends & Statistics, Growth Forecasts (2026 - 2031) |
||||||
※ 本網頁內容可能與最新版本有所差異。詳細情況請與我們聯繫。
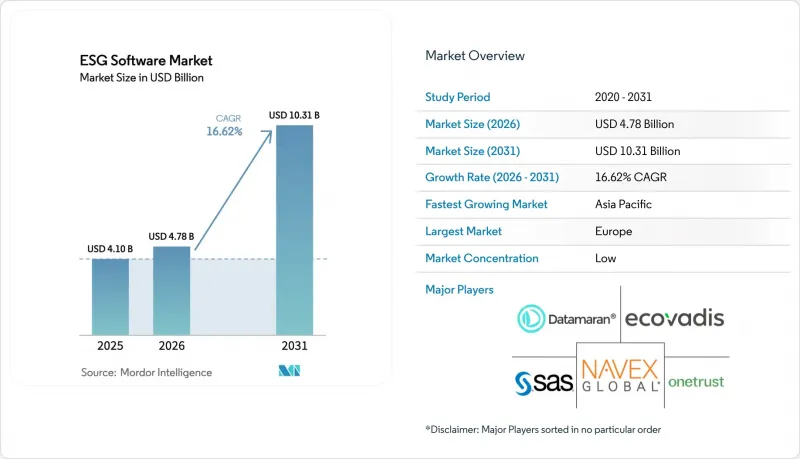
ESG軟體市場預計到2026年價值47.8億美元,高於2025年的41億美元,預計到2031年將達到103.1億美元。
預計從 2026 年到 2031 年,其複合年成長率將達到 16.62%。
這一快速成長的驅動力來自監管要求的整合、投資者監督的加強以及簡化數據匯總和報告的技術進步。歐盟《企業永續發展報告指令》(CSRD) 和美國證券交易委員會 (SEC) 的氣候變遷法規現已要求數千家公司揭露標準化的環境、社會和管治(ESG) 指標,從而加速了全球對專用平台的需求。人工智慧 (AI) 和區塊鏈創新透過自動化數據品質檢查和確保防篡改的審計追蹤,進一步刺激了 ESG 軟體市場的發展。雲端原生技術的應用降低了中小企業 (SME) 的進入門檻,而對供應鏈透明度的日益成長的期望則使製造業、零售業和能源等行業的支出保持在高位。
全球ESG軟體市場趨勢與洞察
推動制定標準化的ESG揭露法規
全球政策制定者正在協調永續發展法規,要求企業遵守歐洲的《公司永續發展指令》(CSRD)、美國證券交易委員會(SEC)的《氣候指令》以及加州和亞太地區的類似法規。僅CSRD一項就將報告義務擴大到超過5萬家公司,並要求進行雙重重要性評估,而許多舊有系統無法處理此類評估。同時,SEC法規要求大規模早期申報公司從2025會計年度開始揭露範圍1和範圍2的排放,這增加了對能夠應對多種框架的合規引擎的需求(sec.gov)。提供預先映射的揭露範本和可審計證據庫的供應商正成為首選合作夥伴,尤其是在應對重疊框架的全球跨國公司中。
投資者和相關人員要求提高透明度的壓力
機構投資人正將資金籌措管道與詳細的ESG(環境、社會和治理)績效數據掛鉤。一項歐洲零售銀行業調查發現,24%的客戶因ESG績效不佳而打算更換銀行。像Digital Realty這樣的公司已經追蹤了66%的可再生能源消耗,並使用專用軟體評估其60%供應商的ESG風險,這表明即時儀表板對相關人員的信心有著顯著的影響。隨著綠色債券發行量的穩定成長,自動化投資者報告模組和與金融系統的API級整合已成為財務長必不可少的功能。
在以舊有系統。
擁有專有控制系統的製造企業在實施ESG資料饋送方面面臨巨大的成本。儘管製造商預計會增加員工人數並部署人工智慧以滿足CSRD和SEC的要求,但早期先導計畫顯示,過時的資料架構導致預算超支。醫院需要將病患管理系統與排放計算工具整合,以符合歐盟的分類標準,這進一步擴大了IT計畫的範圍(envoria.com)。公共產業在升級資料中心時也面臨類似的成本,因為89%的技術領導者現在在採購中優先考慮永續性指標。漫長的整合週期和客製化連接器正在延緩部署,並拉低整體複合年成長率。
細分市場分析
儘管解決方案在2025年佔據了大部分收入,但預計到2031年,整合、諮詢和彙報等服務合約將以18.06%的複合年成長率成長。實施專案通常會將碳核算、產品管理和審計模組與核心ESG平台結合,從而推動對多年諮詢合約的需求。擁有標準化交付框架的供應商可以縮短引進週期,對維修企業資源規劃(ERP)套件的製造商極具吸引力。同時,隨著企業擴大將複雜的供應商資料導入工作外包給專業機構,面向整合服務的ESG軟體市場預計將穩定成長。管理服務仍然是一個新興的細分市場,但隨著企業在日益成長的管治義務下轉向「合規即服務」以控制成本,預計其需求將會增加。
另一個影響是整合活動的活性化。平台提供者正擴大收購高度專業化的顧問公司,以便將軟體授權和實施能力打包提供。客戶優先考慮單一提供者的責任制,這迫使供應商擴展其在法規、行業基準和保證標準方面的專業知識。在預測期內,隨著全面轉型夥伴關係成為標準,ESG軟體市場中產品和專業服務之間的界線可能會變得模糊。
儘管多租戶雲端仍然是主流部署模式,但政府採購政策和資料居住要求正在推動對混合架構日益成長的需求。在能源公共產業和公共企業(它們必須在本地保留敏感數據,同時利用雲端分析進行情境規劃)的推動下,混合部署中的ESG軟體市場預計將以最高的複合年成長率成長。為了平衡資料主權和可擴展性,各組織正在採用容器化微服務來編配跨私有資料中心和主權雲端區域的工作負載。供應商則透過添加基於策略的資料路由、加密和零信任框架來回應此需求。
訂閱模式與企業社會責任報告(CSRD)的分階段實施計畫相契合,使雲端技術持續保持優勢。軟體升級可在不造成客戶停機的情況下整合新的揭露模板,這對於正在完善歐洲永續發展報告標準(ESRS)的歐洲企業至關重要。在攝取大量資料(例如來自監測範圍1排放的物聯網感測器的資料)時,彈性雲儲存可以避免資本投資。儘管ESG軟體市場佔有率預計仍將集中在雲端領先手中,但擁有多層混合藍圖的公司正在快速成長的監管產業中擴大市場佔有率。
ESG軟體市場報告以「交付方式(解決方案、服務)」、「部署方式(雲端、本地部署)」、「企業規模(中小企業、大型企業)」、「最終用戶產業(銀行、金融服務和保險、IT與電信、製造業、零售與電子商務、醫療保健、政府、其他最終用戶業)」和「地區」對產業進行細分。市場預測以美元計價。
區域分析
憑藉統一的政策框架和強大的投資者行動主義,歐洲繼續保持主導地位。將於2024年1月生效的《企業永續性報告指令》(CSRD)引發了一波平台更新與擴展浪潮。總部位於法國、德國和北歐國家的跨國公司正在擴展其整合套件,以反映雙重實質結果。因此,歐洲相關的ESG軟體市場規模呈現穩定且成熟的成長態勢。
亞太地區展現出最快的成長動能。中國已強制要求300多家上市公司在2026年前提交永續發展報告,並鼓勵國內外供應商採用標準化工具。新加坡計劃在2025年前強制所有上市公司揭露氣候變遷資訊。在日本,人工智慧驅動的ESG評分工具的引入也在穩步推進,例如HEROZ和NZAM於2025年聯合發布的公告。世界各國政府也在製定綠色金融分類標準,透過要求跨國投資者使用通用數據定義來促進區域一致性。
北美正在穩步推進。美國證券交易委員會(SEC)的監管法規鼓勵上市公司實現範圍1和範圍2碳排放追蹤的自動化,而加州的氣候課責方案等州級措施則將資訊揭露範圍擴大到供應商。蓬勃發展的創投生態系統正在為專注於人工智慧的ESG新創公司提供資金,而像Xcel Energy這樣的公共產業正在試點碳監測軟體,以履行其淨零排放承諾。
儘管中東和非洲仍屬發展中地區,但它們已表現出濃厚的興趣,尤其是主權財富基金和尋求多元化及低碳戰略的國有石油公司。先導計畫主要集中在波灣合作理事會(GCC)成員國,因為滿足全球資本市場的期望至關重要。
其他好處:
- Excel格式的市場預測(ME)表
- 3個月的分析師支持
目錄
第1章:引言
- 研究假設和市場定義
- 調查範圍
第2章:調查方法
第3章執行摘要
第4章 市場狀況
- 市場概覽
- 市場促進因素
- 監管機構正在推動ESG資訊揭露的標準化。
- 投資者和相關人員要求提高透明度的壓力
- 透過集中管理ESG數據來提高營運效率
- 擴大中小企業對雲端原生ESG平台的採用。
- 透過人工智慧驅動的預測分析實現主動風險管理。
- 利用代幣化和區塊鏈技術來保障不可竄改的ESG資料來源。
- 市場限制因素
- 在擁有眾多舊有系統。
- 全球供應鏈中的數據品質和碎片化問題
- 缺乏內部ESG專業知識與轉型管理能力
- 標準的演變會引發一系列重組方案。
- 監理情勢
- 技術展望
- 波特五力模型
- 供應商的議價能力
- 買方的議價能力
- 新進入者的威脅
- 替代品的威脅
- 競爭公司之間的競爭
- 投資分析
- 宏觀經濟影響評估
第5章 市場規模與成長預測
- 報價
- 解決方案
- 永續發展報告與揭露平台
- 碳會計軟體
- 供應鏈ESG管理
- 風險與合規管理
- 審計和保證工具
- 服務
- 實施與整合
- 諮詢和顧問服務
- 培訓和支持
- 託管服務
- 解決方案
- 不同的發展
- 雲(SaaS)
- 現場
- 混合
- 按組織規模
- 大型公司(1000 名或以上員工)
- 中型企業(250-999人)
- 小規模企業(員工人數少於250人)
- 功能性別
- 資料收集和匯總
- 重要性評估
- 分析與基準測試
- 報告和揭露的自動化
- 情境分析與預測
- 相關人員與參與
- 按最終用戶行業分類
- BFSI
- 資訊科技和通訊
- 製造業
- 車
- 化學與材料
- 重工業和工程
- 零售與電子商務
- 醫療保健和生命科學
- 能源與公共產業
- 政府和公共部門
- 其他(教育、飯店等)
- 按地區
- 北美洲
- 美國
- 加拿大
- 墨西哥
- 南美洲
- 巴西
- 阿根廷
- 南美洲其他地區
- 歐洲
- 英國
- 德國
- 法國
- 義大利
- 西班牙
- 荷蘭
- 俄羅斯
- 其他歐洲地區
- 亞太地區
- 中國
- 日本
- 印度
- 韓國
- 澳洲和紐西蘭
- ASEAN-5
- 亞太其他地區
- 中東和非洲
- 以色列
- 沙烏地阿拉伯
- 阿拉伯聯合大公國
- 土耳其
- 其他中東國家
- 非洲
- 南非
- 奈及利亞
- 肯亞
- 其他非洲地區
- 北美洲
第6章 競爭情勢
- 市場集中度
- 策略趨勢
- 市佔率分析
- 公司簡介
- Datamaran
- EcoVadis
- NAVEX
- SAS Institute
- OneTrust
- Coolset
- TruValue Labs(FactSet)
- Diligent
- Workiva
- Persefoni
- Sphera Solutions
- Enablon(Wolters Kluwer)
- Intelex
- Cority
- Plan A
- Greenstone
- IBM Envizi
- Salesforce(Net Zero Cloud)
- FigBytes
- ESG Book
- Novisto
- IsoMetrix
- Benchmark ESG(Gensuite)
第7章 市場機會與未來展望
The ESG software market size in 2026 is estimated at USD 4.78 billion, growing from 2025 value of USD 4.1 billion with 2031 projections showing USD 10.31 billion, growing at 16.62% CAGR over 2026-2031.
Rapid growth springs from converging regulatory mandates, mounting investor scrutiny, and technology advances that simplify data aggregation and reporting. Europe's Corporate Sustainability Reporting Directive (CSRD) and the United States Securities and Exchange Commission (SEC) climate rules now obligate thousands of firms to disclose standardized environmental, social, and governance (ESG) metrics, accelerating global demand for purpose-built platforms. Artificial intelligence (AI) and blockchain innovations further elevate the ESG software market by automating data quality checks and ensuring immutable audit trails. Cloud-native deployment lowers the entry barrier for small and medium enterprises (SMEs), while rising expectations for supply-chain transparency keep spending high across manufacturing, retail, and energy verticals.
Global ESG Software Market Trends and Insights
Regulatory Push for Standardized ESG Disclosures
Global policymakers have synchronized sustainability rules, forcing firms to align with CSRD in Europe, SEC climate directives in the United States, and similar statutes in California and Asia-Pacific. The CSRD alone expands mandatory reporting to more than 50,000 companies, requiring double materiality assessments that many legacy systems cannot support. Parallel SEC rules oblige large accelerated filers to disclose Scope 1 and Scope 2 emissions starting with fiscal year 2025, intensifying demand for multi-framework compliance engines sec.gov. Vendors that embed pre-mapped disclosure templates and audit-ready evidence repositories have become preferred partners, especially among global multinationals navigating overlapping frameworks.
Investor & Stakeholder Pressure for Transparency
Institutional investors link access to capital with granular ESG performance data. European retail banking research indicates 24% of customers would switch banks over poor ESG credentials. Corporations such as Digital Realty already track 66% renewable energy consumption and evaluate 60% of their suppliers for ESG risks using dedicated software, signaling how real-time dashboards influence stakeholder confidence. Green bond volumes continue to climb, so automated investor reporting modules and API-level integrations with treasury systems have become must-have features for CFOs.
High Implementation & Integration Costs for Legacy-Heavy Industries
Industrial enterprises with proprietary control systems face steep expenses retrofitting ESG data feeds. Manufacturers expect to add staff and adopt AI to meet CSRD and SEC requirements, yet early pilots expose budget overruns tied to outdated data architectures. Hospitals must connect patient management systems with emissions calculators to comply with EU taxonomy, further inflating IT project scopes envoria.com. Utilities upgrading data centers confront similar costs because 89% of technology leaders now prioritize sustainability metrics in procurement. Long integration timelines and custom connectors slow adoption, dampening overall CAGR.
Other drivers and restraints analyzed in the detailed report include:
- Operational Efficiency Gains via Centralized ESG Data
- Rising Adoption of Cloud-Native ESG Platforms Among SMEs
- Data Quality & Fragmentation Across Global Supply Chains
For complete list of drivers and restraints, kindly check the Table Of Contents.
Segment Analysis
Solutions generated the majority of revenue in 2025, yet service engagements such as integration, advisory, and managed reporting are expanding at 18.06% CAGR through 2031. Implementation projects often pair core ESG platforms with carbon accounting, product stewardship, and audit modules, spurring demand for multi-year consulting contracts. Vendors with standardized delivery frameworks shorten deployment cycles, appealing to manufacturers retrofitting enterprise resource planning suites. Meanwhile, the ESG software market size for integration services is projected to climb steadily as firms outsource complex supplier data onboarding to domain specialists. Managed services remain an emerging niche, but rising governance obligations suggest an uptick as organizations pivot to "compliance-as-a-service" to control costs.
Second-order impacts include heightened consolidation activity: platform providers increasingly acquire boutique consultancies to bundle software licenses with delivery capacity. Clients value single-provider accountability, pushing vendors to broaden domain knowledge across regulations, industry benchmarks, and assurance standards. Over the forecast period, the ESG software market will likely blur the line between product and professional service as holistic transformation partnerships become standard.
Although multitenant cloud remains the primary deployment model, government procurement policies and data-residency requirements lift demand for hybrid architecture. The ESG software market size for hybrid deployments is set to record the fastest CAGR, driven by energy utilities and public firms that must retain sensitive data on-premise while leveraging cloud analytics for scenario planning. Organizations balancing sovereignty with scalability adopt containerized micro-services that orchestrate workloads across private data centers and sovereign cloud zones. Software vendors have responded by adding policy-based data routing, encryption, and zero-trust frameworks.
Cloud supremacy continues because subscription models align with CSRD phase-in schedules. Software upgrades integrate new disclosure templates without customer downtime, critical when Europe refines European Sustainability Reporting Standards. For high-volume data ingest-such as IoT sensors monitoring Scope 1 emissions-elastic cloud storage avoids capital outlay. ESG software market share will remain concentrated around cloud first movers; however, firms with multilayer hybrid roadmaps are capturing fast-growth, regulation-sensitive verticals.
ESG Software Market Report Segments the Industry Into Offerings (Solution, Services), by Deployment (Cloud, On-Premise), by Enterprise (SMEs, Large Enterprises), by End-User Vertical (BFSI, IT and Telecom, Manufacturing, Retail and E-Commerce, Healthcare, Government, Other End-User Verticals), and by Geography. The Market Forecasts are Provided in Terms of Value (USD).
Geography Analysis
Europe retains leadership owing to unified policy frameworks and strong investor activism. The CSRD, effective from January 2024, triggered a wave of platform renewals and expansions. Multinational corporations headquartered in France, Germany, and the Nordics scale up integrated suites that map double materiality outcomes. The ESG software market size attached to Europe thus shows stable yet mature expansion.
Asia-Pacific exhibits the steepest growth trajectory. China mandates sustainability reports for more than 300 listed entities by 2026, prompting local and foreign suppliers to adopt standardized toolsets. Singapore will require climate disclosures from all listed companies in 2025, and Japan promotes AI-driven ESG scoring agents, as demonstrated by HEROZ and NZAM's joint launch in 2025. Governments also establish green-finance taxonomies, so cross-border investors insist on common data definitions, driving regional convergence.
North America advances at a steady clip. SEC rules spur public companies to automate Scope 1 and Scope 2 tracking, while state-level initiatives-such as California's Climate Accountability Package-extend disclosure to suppliers. A thriving venture ecosystem funds AI-first ESG startups, and utilities like Xcel Energy pilot carbon-monitoring software to meet net-zero commitments.
The Middle East and Africa remain nascent but display early interest, especially among sovereign wealth funds and national oil companies pursuing diversification and low-carbon strategies. Pilot projects concentrate in Gulf Cooperation Council nations where compliance with global capital-market expectations becomes essential.
- Datamaran
- EcoVadis
- NAVEX
- SAS Institute
- OneTrust
- Coolset
- TruValue Labs (FactSet)
- Diligent
- Workiva
- Persefoni
- Sphera Solutions
- Enablon (Wolters Kluwer)
- Intelex
- Cority
- Plan A
- Greenstone
- IBM Envizi
- Salesforce (Net Zero Cloud)
- FigBytes
- ESG Book
- Novisto
- IsoMetrix
- Benchmark ESG (Gensuite)
Additional Benefits:
- The market estimate (ME) sheet in Excel format
- 3 months of analyst support
TABLE OF CONTENTS
1 INTRODUCTION
- 1.1 Study Assumptions and Market Definition
- 1.2 Scope of the Study
2 RESEARCH METHODOLOGY
3 EXECUTIVE SUMMARY
4 MARKET LANDSCAPE
- 4.1 Market Overview
- 4.2 Market Drivers
- 4.2.1 Regulatory push for standardized ESG disclosures
- 4.2.2 Investor and stakeholder pressure for transparency
- 4.2.3 Operational efficiency gains via centralized ESG data
- 4.2.4 Rising adoption of cloud-native ESG platforms among SMEs
- 4.2.5 AI-powered predictive analytics enabling proactive risk management
- 4.2.6 Tokenization and blockchain for immutable ESG data provenance
- 4.3 Market Restraints
- 4.3.1 High implementation and integration costs for legacy-heavy industries
- 4.3.2 Data quality and fragmentation across global supply chains
- 4.3.3 Shortage of in-house ESG expertise and change-management capability
- 4.3.4 Evolving standards causing solution re-architecture cycles
- 4.4 Regulatory Landscape
- 4.5 Technological Outlook
- 4.6 Porter's Five Forces
- 4.6.1 Bargaining Power of Suppliers
- 4.6.2 Bargaining Power of Buyers
- 4.6.3 Threat of New Entrants
- 4.6.4 Threat of Substitutes
- 4.6.5 Competitive Rivalry
- 4.7 Investment Analysis
- 4.8 Macroeconomic Impact Assessment
5 MARKET SIZE AND GROWTH FORECASTS (VALUE, USD)
- 5.1 By Offering
- 5.1.1 Solutions
- 5.1.1.1 Sustainability Reporting and Disclosure Platforms
- 5.1.1.2 Carbon Accounting Software
- 5.1.1.3 Supply-Chain ESG Management
- 5.1.1.4 Risk and Compliance Management
- 5.1.1.5 Audit and Assurance Tools
- 5.1.2 Services
- 5.1.2.1 Implementation and Integration
- 5.1.2.2 Consulting and Advisory
- 5.1.2.3 Training and Support
- 5.1.2.4 Managed Services
- 5.1.1 Solutions
- 5.2 By Deployment
- 5.2.1 Cloud (SaaS)
- 5.2.2 On-Premise
- 5.2.3 Hybrid
- 5.3 By Organization Size
- 5.3.1 Large Enterprises (more than 1,000 employees)
- 5.3.2 Mid-Sized Enterprises (250 to 999)
- 5.3.3 Small Enterprises (less than 250)
- 5.4 By Functionality
- 5.4.1 Data Collection and Aggregation
- 5.4.2 Materiality Assessment
- 5.4.3 Analytics and Benchmarking
- 5.4.4 Reporting and Disclosure Automation
- 5.4.5 Scenario Analysis and Forecasting
- 5.4.6 Stakeholder Engagement
- 5.5 By End-User Industry
- 5.5.1 BFSI
- 5.5.2 IT and Telecom
- 5.5.3 Manufacturing
- 5.5.3.1 Automotive
- 5.5.3.2 Chemicals and Materials
- 5.5.3.3 Heavy Industry and Engineering
- 5.5.4 Retail and E-commerce
- 5.5.5 Healthcare and Life Sciences
- 5.5.6 Energy and Utilities
- 5.5.7 Government and Public Sector
- 5.5.8 Others (Education, Hospitality, etc.)
- 5.6 By Geography
- 5.6.1 North America
- 5.6.1.1 United States
- 5.6.1.2 Canada
- 5.6.1.3 Mexico
- 5.6.2 South America
- 5.6.2.1 Brazil
- 5.6.2.2 Argentina
- 5.6.2.3 Rest of South America
- 5.6.3 Europe
- 5.6.3.1 United Kingdom
- 5.6.3.2 Germany
- 5.6.3.3 France
- 5.6.3.4 Italy
- 5.6.3.5 Spain
- 5.6.3.6 Netherlands
- 5.6.3.7 Russia
- 5.6.3.8 Rest of Europe
- 5.6.4 Asia-Pacific
- 5.6.4.1 China
- 5.6.4.2 Japan
- 5.6.4.3 India
- 5.6.4.4 South Korea
- 5.6.4.5 Australia and New Zealand
- 5.6.4.6 ASEAN-5
- 5.6.4.7 Rest of Asia-Pacific
- 5.6.5 Middle East and Africa
- 5.6.5.1 Israel
- 5.6.5.2 Saudi Arabia
- 5.6.5.3 United Arab Emirates
- 5.6.5.4 Turkey
- 5.6.5.5 Rest of Middle East
- 5.6.6 Africa
- 5.6.6.1 South Africa
- 5.6.6.2 Nigeria
- 5.6.6.3 Kenya
- 5.6.6.4 Rest of Africa
- 5.6.1 North America
6 COMPETITIVE LANDSCAPE
- 6.1 Market Concentration
- 6.2 Strategic Moves
- 6.3 Market Share Analysis
- 6.4 Company Profiles (includes Global level Overview, Market level overview, Core Segments, Financials as available, Strategic Information, Market Rank/Share for key companies, Products and Services, and Recent Developments)
- 6.4.1 Datamaran
- 6.4.2 EcoVadis
- 6.4.3 NAVEX
- 6.4.4 SAS Institute
- 6.4.5 OneTrust
- 6.4.6 Coolset
- 6.4.7 TruValue Labs (FactSet)
- 6.4.8 Diligent
- 6.4.9 Workiva
- 6.4.10 Persefoni
- 6.4.11 Sphera Solutions
- 6.4.12 Enablon (Wolters Kluwer)
- 6.4.13 Intelex
- 6.4.14 Cority
- 6.4.15 Plan A
- 6.4.16 Greenstone
- 6.4.17 IBM Envizi
- 6.4.18 Salesforce (Net Zero Cloud)
- 6.4.19 FigBytes
- 6.4.20 ESG Book
- 6.4.21 Novisto
- 6.4.22 IsoMetrix
- 6.4.23 Benchmark ESG (Gensuite)
7 MARKET OPPORTUNITIES AND FUTURE OUTLOOK
- 7.1 White-space and Unmet-Need Assessment
 人工智慧驅動的投資分析市場:預測(至2034年)-按策略、資料來源、功能、資產、最終使用者和地區分類的全球分析綠色金融科技和ESG金融平台市場預測至2034年-全球分析(按組件、部署模式、技術、產品類型、應用、最終用戶和地區分類)
 2026年全球環境、社會與管治(ESG)關聯保險市場報告2026年全球太空法與管治市場報告
 ESG風險管理市場分析及預測(至2035年):依類型、產品類型、服務、技術、組件、應用、部署類型、最終用戶及解決方案分類
 ESG投資市場規模、佔有率、成長及全球產業分析:按類型、應用和地區分類,並預測至2026-2034年
 ESG評估服務:市場佔有率分析、產業趨勢與統計、成長預測(2026-2031年)
 ESG軟體市場規模、佔有率和趨勢分析報告:按部署模式、類型、組織規模、最終用途、地區和細分市場預測,2026-2033年
 ESG認證市場規模、佔有率和成長分析(按認證類型、產業垂直領域、最終用戶、服務類型、環境影響和地區分類)-2026-2033年產業預測全球ESG投資平台市場:預測至2032年-按組件、ESG標準、部署方式、最終用戶和地區分類的分析