


 |
市場調查報告書
商品編碼
1940898
永續發展諮詢服務:市場佔有率分析、產業趨勢與統計、成長預測(2026-2031)Sustainability Consulting Services - Market Share Analysis, Industry Trends & Statistics, Growth Forecasts (2026 - 2031) |
||||||
※ 本網頁內容可能與最新版本有所差異。詳細情況請與我們聯繫。
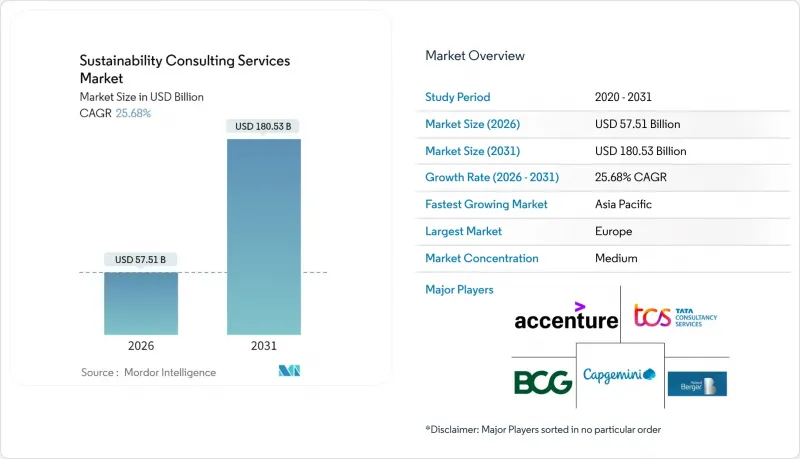
2025年永續發展諮詢服務市值為457.5億美元,預計到2031年將達到1,805.3億美元,而2026年為575.1億美元。
預測期(2026-2031 年)的複合年成長率預計為 25.68%。
日益嚴格的監管要求、企業淨零排放承諾的激增以及數位碳數據平台的普及,正將環境、社會和管治(ESG) 管理提升為董事會層面的優先事項。僅歐盟的《企業永續發展報告指令》就已強制要求超過 5 萬家公司披露相關資訊,從而推動了對專業指導的需求激增。同時,投資人正加速將資本重新配置到氣候友善資產,企業也尋求對其脫碳計畫的外部檢驗。科技的日益普及正在重塑服務交付模式,人工智慧驅動的碳核算引擎實現了資料收集的自動化,使諮詢顧問能夠專注於更高價值的諮詢服務。儘管競爭激烈,但市場仍然高度分散,這為全球巨頭和利基專家在生物多樣性、循環經濟和基於自然的解決方案等新興領域搶佔市場佔有率提供了機會。
全球永續發展諮詢服務市場趨勢與洞察
企業淨零排放目標推動諮詢支出成長
大型企業目前將淨零排放目標視為硬性期限,而不僅僅是目標。董事會必須將基於科學的目標轉化為可操作的藍圖,涵蓋供應鏈規劃、技術選擇和相關人員。範圍3的排放通常超過總排放的70%,這增加了複雜性,也增加了對第三方指導的需求。全球2000家最大的企業中,只有16%預計在2050年前實現淨零排放,凸顯了巨大的實施差距,需要外部顧問來彌補。隨著監管日益嚴格和調查方法不斷發展,持續監測、目標調整和保障要求成為多年諮詢計畫的基礎。
擴大ESG和永續發展資訊揭露法規
歐盟《企業永續性報告指令》(CSRD)引入了雙重重要性分析、結構化數位標籤和第三方鑑證,這給在歐洲開展業務的公司帶來了巨大的學習挑戰。 2024年至2026年的分階段實施計畫將持續推高報告企業的諮詢需求。總部位於歐盟以外的跨國公司,如果其在歐盟地區擁有顯著的銷售額,也將被納入該指令的適用範圍,從而將合規計劃擴展到全球層面。資料收集的深度需求迫使企業升級其報告流程、IT系統和內部控制,顧問公司也因此在這些領域提供評估、設計和變革管理服務。
嚴重的勞動力短缺推高了計費成本。
對兼具氣候科學、監管洞察和策略諮詢能力的專業人才的需求遠遠超過供給。生物多樣性評估、循環產品設計和人工智慧驅動的排放分析等專業尤其供不應求。儘管企業正在提高薪資、從競爭對手那裡挖人並投資技能提升項目,但人才儲備仍然有限。不斷上漲的每日津貼標準疏遠了一些中端市場客戶,減少了計劃數量,並自然而然地抑制了永續發展諮詢服務市場的發展。技術賦能的交付模式正在彌補部分缺口,但複雜的案例仍需要人類的專業知識。
細分市場分析
至2025年,氣候變遷諮詢將佔永續發展諮詢服務市場收入的29.12%。循環經濟和資源效率的交易規模雖小,但預計到2031年將以18.05%的複合年成長率高速成長,反映出企業對減少廢棄物和可再生設計的日益關注。由於資訊揭露要求的擴大,ESG報告諮詢的需求不斷成長;而綠色建築諮詢則受益於監管的加強和認證系統的普及。
推行循環經濟策略的客戶需要進行產品重新設計、逆向物流規劃、開發新的收入模式。諮詢團隊正在整合生命週期評估工具和財務影響模型,以支援決策。隨著原物料成本上漲和掩埋法規日益嚴格,經營團隊將循環經濟視為降低風險和創造價值的雙重途徑,從而推動永續發展諮詢服務市場的長期成長。
到了2025年,能源和電力公司將佔總支出的23.78%,凸顯該產業在全球脫碳進程中的核心作用。同時,製造業預計將以15.74%的複合年成長率推動成長,這得益於不斷完善的供應鏈監管和工業4.0投資與資源效率目標的同步推進。金融服務客戶將需要氣候風險情境分析和永續金融產品設計,而綠色建築標準和碳排放追蹤將成為建築和蘊藏量行業的關鍵活動。
製造商面臨越來越大的壓力,需要報告範圍 3 的排放、遵守客戶主導的供應商規範並降低能源強度。諮詢服務涵蓋物料流圖繪製、可再生能源採購數位雙胞胎實施等各個面向。隨著監管和商業性因素的融合,工業客戶在永續發展諮詢服務市場中所佔的佔有率越來越大。
永續發展諮詢服務市場按服務類型(例如,氣候變遷諮詢、綠色建築諮詢)、終端用戶產業(例如,能源電力、建築房地產)、諮詢交付模式(例如,策略與顧問)、永續發展重點領域(例如,氣候變遷與淨零排放)以及地區進行細分。市場預測以美元計價。
區域分析
到2025年,歐洲將佔全球收入的38.74%,反映出歐洲較早採納了相關監管措施,企業永續發展實踐日趨成熟。 《企業永續發展報告指令》(CSRD)、歐盟分類標準以及各國的氣候中和法律,都為持續進行多年諮詢服務提供了支持。例如,德國聯邦機構正在聘請顧問制定產業脫碳藍圖,並監測其2045年碳中和目標的進展。複雜的雙重實質評估和數位標籤法規進一步增加了對兼具法律、金融和技術學科專業知識的需求。
預計到2031年,亞太地區將以16.92%的複合年成長率實現最快成長速度。工業化、出口導向供應鏈以及主權財富基金的投資策略共同推動了諮詢支出的成長。中國和印度等國已啟動排放交易試點計畫和綠色金融框架,促使國內企業尋求合規和機會的指導。彭博新能源財經預測,到2050年,該地區將需要74兆至89兆美元的轉型資本,將為大規模的永續發展諮詢服務市場奠定基礎。能夠利用全球經驗並實現服務在地化的服務提供者將佔據最佳優勢。
北美市場日趨成熟,但規模仍龐大。企業自願性舉措、州級清潔能源標準以及投資者的積極參與支撐著市場的穩定成長,但缺乏全面的聯邦監管限制了其加速發展。隨著跨國公司供應鏈向下游擴展,南美市場需求正在湧現;而中東和非洲市場則受到資源產業多元化計畫以及主權財富基金ESG目標的推動。各地區政策成熟度的差異造就了不同的服務組合,從而增強了永續發展諮詢服務市場的全球韌性。
其他福利:
- Excel格式的市場預測(ME)表
- 3個月的分析師支持
目錄
第1章 引言
- 研究假設和市場定義
- 調查範圍
第2章調查方法
第3章執行摘要
第4章 市場洞察
- 市場概覽
- 市場促進因素
- 企業為實現淨零排放目標所做的努力推動了諮詢支出。
- 擴大 ESG 和永續性資訊揭露法規(例如,CSRD)
- 投資者面臨壓力,需要在配置資本時考慮氣候風險。
- 公共部門脫碳促進計劃
- 人工智慧驅動的碳核算平台推動綜合計劃
- 新興市場主權財富基金的永續性要求
- 市場限制
- 由於勞動力嚴重短缺,帳單成本上升。
- 監管確定性缺口和「綠色清洗」訴訟風險
- 現成的SaaS永續發展工具淘汰諮詢服務
- 碳權價格的波動降低了投資報酬率的吸引力。
- 價值鏈分析
- 監管環境
- 技術展望
- 波特五力分析
- 供應商的議價能力
- 買方的議價能力
- 新進入者的威脅
- 替代品的威脅
- 競爭對手之間的競爭
- 產業生態系分析
- 主要用例和案例研究
- 宏觀經濟趨勢評估
- 投資分析
第5章 市場規模與成長預測
- 按服務類型
- 氣候變遷諮詢
- 綠建築諮詢
- ESG和報告諮詢
- 循環經濟與資源效率諮詢
- 永續發展策略與管治
- 按最終用戶行業分類
- 能源與電力
- 建築和房地產
- 製造業和工業
- 金融服務和保險
- 公共部門和非政府組織(NGO)
- 透過諮商模式
- 策略與諮詢
- 部署與整合
- 託管服務/外包
- 數位平台和分析
- 培訓和能力建設
- 按永續發展優先領域分類
- 氣候變遷與淨零排放
- 生物多樣性和基於自然的解決方案
- 循環經濟與廢棄物管理
- 社會影響與多元、公平與包容
- 永續金融與報告
- 按地區
- 北美洲
- 美國
- 加拿大
- 墨西哥
- 南美洲
- 巴西
- 阿根廷
- 哥倫比亞
- 南美洲其他地區
- 歐洲
- 德國
- 英國
- 法國
- 義大利
- 西班牙
- 俄羅斯
- 荷蘭
- 其他歐洲地區
- 亞太地區
- 中國
- 日本
- 韓國
- 印度
- 澳洲
- 新加坡
- 亞太其他地區
- 中東和非洲
- 中東
- 沙烏地阿拉伯
- 阿拉伯聯合大公國
- 其他中東地區
- 非洲
- 南非
- 埃及
- 其他非洲地區
- 中東
- 北美洲
第6章 競爭情勢
- 市場集中度
- 策略趨勢
- 市佔率分析
- 公司簡介
- Accenture plc
- Boston Consulting Group, Inc.
- Tata Consultancy Services Ltd.
- Capgemini SE
- Roland Berger GmbH
- Bain and Company, Inc.
- KPMG International Ltd.
- Ernst and Young Global Ltd.
- Deloitte Touche Tohmatsu Ltd.
- PricewaterhouseCoopers LLP
- McKinsey and Company, Inc.
- AECOM
- WSP Global Inc.
- Environmental Resources Management Ltd.
- Jacobs Solutions Inc.
- Arcadis NV
- Wood Group plc
- Tetra Tech, Inc.
- Ramboll Group A/S
- Stantec Inc.
第7章 市場機會與未來展望
The sustainability consulting services market was valued at USD 45.75 billion in 2025 and estimated to grow from USD 57.51 billion in 2026 to reach USD 180.53 billion by 2031, at a CAGR of 25.68% during the forecast period (2026-2031).
Heightened regulatory mandates, fast-rising corporate net-zero pledges and digital carbon-data platforms are turning environmental, social and governance management into a board-level priority. The European Union's Corporate Sustainability Reporting Directive alone brings more than 50,000 firms into mandatory disclosure scope, multiplying demand for specialized guidance. At the same time, investors are reallocating capital toward climate-aligned assets, prompting companies to seek external verification of decarbonization plans. Technology adoption is reshaping service delivery as AI-enabled carbon-accounting engines automate data capture, freeing consultants to focus on high-value advisory. Competition is intensifying, yet the market remains sufficiently fragmented for both global majors and niche boutiques to capture share in emerging areas such as biodiversity, circularity and nature-based solutions.
Global Sustainability Consulting Services Market Trends and Insights
Corporate Net-Zero Commitments Accelerating Advisory Spend
Large enterprises now treat net-zero targets as hard compliance deadlines rather than aspirational statements. Boards must translate science-based targets into operational roadmaps that span supply-chain mapping, technology selection and stakeholder engagement. Scope 3 emissions regularly exceed 70% of total footprints, amplifying complexity and elevating the need for third-party guidance. Only 16% of the world's 2,000 largest firms remain on track for 2050 net-zero, underscoring a vast execution gap that external advisors are hired to close . Continuous monitoring, target recalibration and assurance requirements sustain multi-year consulting engagements as regulations tighten and methodologies evolve.
Expanding ESG and Sustainability Disclosure Regulations
The EU CSRD introduces double materiality analysis, structured digital tagging and third-party assurance, creating a steep learning curve for companies with European operations. Staggered adoption timelines from 2024 to 2026 keep advisory demand elevated across successive cohorts of filers. Non-EU multinationals with significant regional sales also fall within scope, extending compliance projects worldwide. Required data-collection depth forces upgrades to reporting processes, IT systems and internal controls, areas where consultancies provide assessment, design and change-management services.
Acute Talent Shortage Inflating Billing Rates
Demand for professionals who blend climate science, regulatory insight and strategic consulting far outweighs supply. Specialized roles in biodiversity valuation, circular-product design and AI-driven emissions analytics remain especially scarce. Firms raise compensation, poach competitors and invest in upskilling programs, yet pipeline constraints persist. Elevated day rates deter some midmarket clients, dampening project volumes and placing a natural brake on the sustainability consulting services market. Technology-enabled delivery models partly offset the shortfall, but complex engagements still require human expertise.
Other drivers and restraints analyzed in the detailed report include:
- AI-Enabled Carbon-Accounting Platforms Driving Integration Projects
- Public-Sector Decarbonization Stimulus Programs
- Off-the-Shelf SaaS Sustainability Tools Disintermediating Consulting
For complete list of drivers and restraints, kindly check the Table Of Contents.
Segment Analysis
Climate-change consulting accounted for 29.12% of 2025 revenue within the sustainability consulting services market. Circular-economy and resource-efficiency engagements, though smaller, will post the strongest 18.05% CAGR to 2031, reflecting growing corporate interest in waste elimination and regenerative design. ESG-reporting advisory gains traction as disclosure obligations expand, while green-building consulting benefits from stricter codes and certification schemes.
Clients pursuing circular-economy strategies demand product redesign, reverse-logistics planning and new revenue-model development. Advisory teams integrate life-cycle assessment tools with financial-impact modeling to guide decision-making. As material costs rise and landfill regulations tighten, leaders view circularity as both risk mitigation and value creation, reinforcing long-run expansion of the sustainability consulting services market.
Energy and power companies generated 23.78% of 2025 spending, underscoring the sector's central role in global decarbonization. Manufacturers, however, will pace growth at a 15.74% CAGR as supply-chain mandates propagate and Industry 4.0 investments intersect with resource-efficiency goals. Financial-services clients request climate-risk scenario analysis and sustainable-finance product design, while construction and real estate engagements revolve around green-building codes and embodied-carbon tracking.
Manufacturers face mounting pressure to report scope-3 emissions, comply with customer-driven supplier codes and reduce energy intensity. Consulting assignments span material-flow mapping, renewable-energy sourcing and digital twin deployment. As regulatory and commercial drivers converge, industrial clients contribute an ever-larger slice of the sustainability consulting services market size.
Sustainability Consulting Services Market is Segmented by Service Type (Climate-Change Consulting, Green-Building Consulting, and More), End-User Industry (Energy and Power, Construction and Real Estate, and More), Consulting Delivery Model (Strategy and Advisory, and More), Sustainability Focus Area (Climate-Change and Net-Zero, and More), and Geography. The Market Forecasts are Provided in Terms of Value (USD).
Geography Analysis
Europe generated 38.74% of 2025 revenue, reflecting early regulatory adoption and mature corporate sustainability practices. The CSRD, EU Taxonomy and national climate-neutrality laws sustain multiyear advisory pipelines. German federal agencies, for instance, enlist consultants to draft sector-specific decarbonization roadmaps and monitor progress toward the 2045 neutrality goal. Complex double-materiality assessments and digital tagging rules reinforce demand for integrated legal, financial, and technical expertise.
Asia-Pacific will deliver the fastest 16.92% CAGR to 2031. Industrialization, supply-chain export exposure and sovereign-wealth-fund mandates converge to spur consulting spend. Nations such as China and India launch emissions-trading pilots and green-finance frameworks, compelling domestic firms to seek guidance on compliance and opportunity capture. BloombergNEF projects the region needs USD 74-89 trillion in transition capital through 2050, anchoring a sizeable sustainability consulting services market. Service providers that localize offerings while leveraging global playbooks are best positioned.
North America remains sizeable though maturing. Voluntary corporate commitments, state-level clean-energy standards and investor activism underpin steady growth, yet lack of comprehensive federal regulation tempers acceleration. South American demand is emerging as multinational supply-chain requirements extend downstream, whereas the Middle East and Africa benefit from resource-sector diversification agendas and sovereign-fund ESG goals. Varied policy maturity across geographies ensures differentiated service mixes, bolstering global resilience of the sustainability consulting services market.
- Accenture plc
- Boston Consulting Group, Inc.
- Tata Consultancy Services Ltd.
- Capgemini SE
- Roland Berger GmbH
- Bain and Company, Inc.
- KPMG International Ltd.
- Ernst and Young Global Ltd.
- Deloitte Touche Tohmatsu Ltd.
- PricewaterhouseCoopers LLP
- McKinsey and Company, Inc.
- AECOM
- WSP Global Inc.
- Environmental Resources Management Ltd.
- Jacobs Solutions Inc.
- Arcadis N.V.
- Wood Group plc
- Tetra Tech, Inc.
- Ramboll Group A/S
- Stantec Inc.
Additional Benefits:
- The market estimate (ME) sheet in Excel format
- 3 months of analyst support
TABLE OF CONTENTS
1 INTRODUCTION
- 1.1 Study Assumptions and Market Definition
- 1.2 Scope of the Study
2 RESEARCH METHODOLOGY
3 EXECUTIVE SUMMARY
4 MARKET INSIGHTS
- 4.1 Market Overview
- 4.2 Market Drivers
- 4.2.1 Corporate net-zero commitments accelerating advisory spend
- 4.2.2 Expanding ESG and sustainability disclosure regulations (e.g., CSRD)
- 4.2.3 Investor pressure for climate-risk-aligned capital allocation
- 4.2.4 Public-sector decarbonization stimulus programs
- 4.2.5 AI-enabled carbon-accounting platforms driving integration projects
- 4.2.6 Sovereign-wealth-fund sustainability mandates in emerging markets
- 4.3 Market Restraints
- 4.3.1 Acute talent shortage inflating billing rates
- 4.3.2 Regulatory-certainty gaps and greenwashing litigation risk
- 4.3.3 Off-the-shelf SaaS sustainability tools disintermediating consulting
- 4.3.4 Carbon-credit price volatility undermining ROI narratives
- 4.4 Value Chain Analysis
- 4.5 Regulatory Landscape
- 4.6 Technological Outlook
- 4.7 Porter's Five Forces Analysis
- 4.7.1 Bargaining Power of Suppliers
- 4.7.2 Bargaining Power of Buyers
- 4.7.3 Threat of New Entrants
- 4.7.4 Threat of Substitutes
- 4.7.5 Competitive Rivalry
- 4.8 Industry Ecosystem Analysis
- 4.9 Key Use Cases and Case Studies
- 4.10 Assessment of Macroeconomic Trends
- 4.11 Investment Analysis
5 MARKET SIZE AND GROWTH FORECASTS (VALUE)
- 5.1 By Service Type
- 5.1.1 Climate-Change Consulting
- 5.1.2 Green-Building Consulting
- 5.1.3 ESG and Reporting Advisory
- 5.1.4 Circular-Economy and Resource-Efficiency Consulting
- 5.1.5 Sustainability Strategy and Governance
- 5.2 By End-User Industry
- 5.2.1 Energy and Power
- 5.2.2 Construction and Real Estate
- 5.2.3 Manufacturing and Industrials
- 5.2.4 Financial Services and Insurance
- 5.2.5 Public Sector and NGOs
- 5.3 By Consulting Delivery Model
- 5.3.1 Strategy and Advisory
- 5.3.2 Implementation and Integration
- 5.3.3 Managed Services / Outsourcing
- 5.3.4 Digital Platforms and Analytics
- 5.3.5 Training and Capacity-Building
- 5.4 By Sustainability Focus Area
- 5.4.1 Climate-Change and Net-Zero
- 5.4.2 Biodiversity and Nature-Based Solutions
- 5.4.3 Circular-Economy and Waste-Management
- 5.4.4 Social Impact and DEI
- 5.4.5 Sustainable Finance and Reporting
- 5.5 By Geography
- 5.5.1 North America
- 5.5.1.1 United States
- 5.5.1.2 Canada
- 5.5.1.3 Mexico
- 5.5.2 South America
- 5.5.2.1 Brazil
- 5.5.2.2 Argentina
- 5.5.2.3 Colombia
- 5.5.2.4 Rest of South America
- 5.5.3 Europe
- 5.5.3.1 Germany
- 5.5.3.2 United Kingdom
- 5.5.3.3 France
- 5.5.3.4 Italy
- 5.5.3.5 Spain
- 5.5.3.6 Russia
- 5.5.3.7 Netherlands
- 5.5.3.8 Rest of Europe
- 5.5.4 Asia-Pacific
- 5.5.4.1 China
- 5.5.4.2 Japan
- 5.5.4.3 South Korea
- 5.5.4.4 India
- 5.5.4.5 Australia
- 5.5.4.6 Singapore
- 5.5.4.7 Rest of Asia-Pacific
- 5.5.5 Middle East and Africa
- 5.5.5.1 Middle East
- 5.5.5.1.1 Saudi Arabia
- 5.5.5.1.2 United Arab Emirates
- 5.5.5.1.3 Rest of Middle East
- 5.5.5.2 Africa
- 5.5.5.2.1 South Africa
- 5.5.5.2.2 Egypt
- 5.5.5.2.3 Rest of Africa
- 5.5.5.1 Middle East
- 5.5.1 North America
6 COMPETITIVE LANDSCAPE
- 6.1 Market Concentration
- 6.2 Strategic Moves
- 6.3 Market Share Analysis
- 6.4 Company Profiles (includes Global level Overview, Market level overview, Core Segments, Financials as available, Strategic Information, Market Rank/Share for key companies, Products and Services, and Recent Developments)
- 6.4.1 Accenture plc
- 6.4.2 Boston Consulting Group, Inc.
- 6.4.3 Tata Consultancy Services Ltd.
- 6.4.4 Capgemini SE
- 6.4.5 Roland Berger GmbH
- 6.4.6 Bain and Company, Inc.
- 6.4.7 KPMG International Ltd.
- 6.4.8 Ernst and Young Global Ltd.
- 6.4.9 Deloitte Touche Tohmatsu Ltd.
- 6.4.10 PricewaterhouseCoopers LLP
- 6.4.11 McKinsey and Company, Inc.
- 6.4.12 AECOM
- 6.4.13 WSP Global Inc.
- 6.4.14 Environmental Resources Management Ltd.
- 6.4.15 Jacobs Solutions Inc.
- 6.4.16 Arcadis N.V.
- 6.4.17 Wood Group plc
- 6.4.18 Tetra Tech, Inc.
- 6.4.19 Ramboll Group A/S
- 6.4.20 Stantec Inc.
7 MARKET OPPORTUNITIES AND FUTURE OUTLOOK
- 7.1 White-space and Unmet-Need Assessment
 企業敏捷轉型服務市場:2026-2032年全球市場預測(依服務類型、調查方法、轉型階段、合約模式、部署模式、產業及組織規模分類)
 2026年全球IT諮詢市場報告2026年全球企業敏捷轉型服務市場報告
 企業敏捷轉型服務市場規模、佔有率、趨勢和預測:按方法論、服務類型、組織規模、產業和地區分類,2026-2034 年2026年全球公司秘書服務市場報告2026年全球房地產諮詢服務市場報告2026年全球精算諮詢服務市場報告2026年全球設計、研究、促銷與諮詢服務市場報告
 2026-2030年全球行銷諮詢市場
 東南亞諮詢服務:市場佔有率分析、產業趨勢與統計、成長預測(2026-2031)