


 |
市場調查報告書
商品編碼
1940860
冷卻塔:市場佔有率分析、產業趨勢與統計、成長預測(2026-2031)Cooling Tower - Market Share Analysis, Industry Trends & Statistics, Growth Forecasts (2026 - 2031) |
||||||
※ 本網頁內容可能與最新版本有所差異。詳細情況請與我們聯繫。
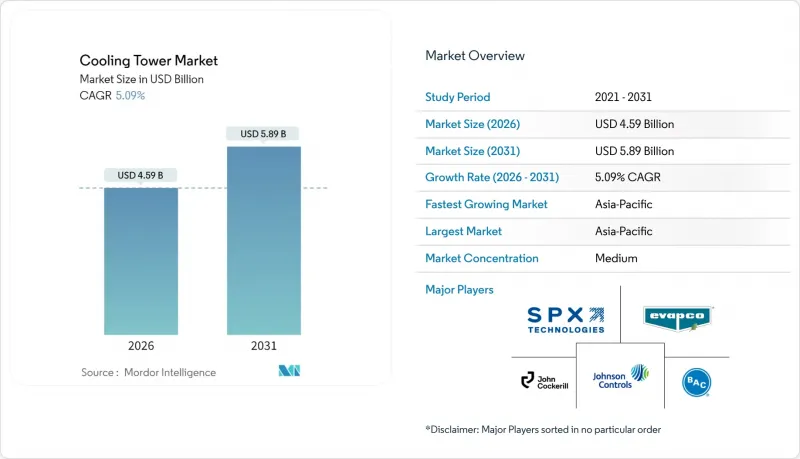
預計到 2026 年,冷卻塔市場規模將達到 45.9 億美元,高於 2025 年的 43.7 億美元。
預計到 2031 年將達到 58.9 億美元,2026 年至 2031 年的複合年成長率為 5.09%。
電力產業的持續資本投資和超大規模資料中心設施的擴張,不斷推動對大容量蒸發冷卻系統的需求。同時,營運商正在加速採用混合式(乾濕兩用)設計,以應對日益嚴格的用水和能源效率法規。逆流式冷卻水塔配置的加速普及、20MW以上裝置容量的成長以及向不含PFAS填充材的過渡,進一步鞏固了冷卻塔市場的成長動能。隨著永續性需求的日益成長,能夠整合數位雙胞胎分析、預測性維護和替代補水方案的供應商,將在實施這些策略方面佔據優勢。
全球冷卻塔市場趨勢與洞察
商業地產中暖通空調設備的擴建
混合用途設施和高規格資料中心的快速商業化正推動開發人員轉向高容量、數位化監控的蒸發冷卻和混合系統。江森自控報告稱,來自智慧建築業主的累積訂單高達131億美元,這些業主指定使用配備需量反應控制設備的冷卻塔,該控制器可與建築自動化伺服器連接。物聯網感測器整合可實現預測性維護程序並減少停機時間。水資源緊張的地區擴大採用乾濕混合式機組,以滿足監管標準,同時又不影響負載追蹤能力。能夠透過CTI認證的性能測試證明實際節能效果的供應商,在房地產投資者審核永續性指標時,將獲得採購優勢。
亞洲和中東電廠產能擴張
中國、印度和海灣地區的電力公司正在擴大核能、燃氣和可再生能源混合發電廠的規模,這些電廠需要大容量逆流冷卻塔來應對波動的蒸氣負荷。中國的河西工業蒸氣互聯系統(河西一號)每年輸送480萬噸製程蒸氣,展現了將冷卻塔整合到工業餘熱回收迴路的商業性效益。海灣合作理事會(GCC)國家的公共產業正在沿海聯合循環燃氣渦輪機發電廠採用海水冷卻冷卻塔,從而減少淡水取用量,即使在極端室外溫度下也能實現超過40%的運轉率。中東地區太陽熱能發電的擴張進一步凸顯了混合系統的優勢,這些系統與未來的碳定價機制相容。
營運成本上升和對缺水問題的擔憂
在乾旱地區,隨著化學品和廢水處理成本超過電力成本,總擁有成本不斷上升。太平洋西北國家實驗室的一項案例研究發現,軍事設施透過回收空調冷凝水和雨水來減少補給水需求,但整合儲水設施相關的資本支出意味著投資回收期超過五年。在澳洲和中東等水價超過每千加侖5美元的地區,即使效率降低,設施也擴大採用乾式冷卻和混合式設計。提供性能保證和節水改造維修的供應商正在獲得長期服務契約,從而緩解新建設較少時期的收入波動。
細分市場分析
到2025年,逆流式冷卻塔將佔市場收入的43.10%,年複合成長率達7.69%,主要得益於資料中心和製藥客戶對高液氣比和小面積的優先考慮。將逆流式冷卻塔與製程冷水冷卻器結合的工業熱泵計劃,每年可實現超過15%的節能效果,從而直接改善食品飲料廠的營運成本敏感度。交叉流冷卻塔在裝機量方面仍保持優勢,尤其是在燃煤和燃氣渦輪機發電廠,其低靜壓損失可降低輔助負載。然而,隨著水價上漲導致溫度控制更加嚴格,預計橫流式冷卻水塔的市佔率將會下降。數位雙胞胎模擬已證實,當與預測性儲水管理系統整合時,逆流式設計可降低5%的營運成本,這將進一步推動市場佔有率的成長。
現有的交叉流冷卻水塔在維修應用中仍然具有吸引力,因為填充材易於更換,且較大的表面積能夠吸收污垢而不會即時降低性能。採取分階段監管策略的業者通常會維修冷卻塔正逐漸成為標準配置,徵兆一場結構性變革,將在未來十年重塑製造商的產品系列。
混合式(乾濕結合)冷卻水塔的年複合成長率高達 8.34%,超過了預計到 2025 年仍將佔據 66.40% 市場佔有率的蒸發式冷卻塔。在缺水地區,公共產業尤其青睞混合式設計,因為這種設計可以在乾旱限制期間切換到乾式模式,在保持熱效率的同時,減少 50% 的季節性用水量。穿孔露點間接蒸發模組的現場測試證實,在送風比低於 0.5 時可實現最佳熱效率,這驗證了混合式冷卻水塔作為煙氣處理維修方案的可行性。
蒸發式冷卻塔在大容量應用中佔據主導地位。濕式運轉可將溫度控制在濕球溫度3°C以內,對蒸氣循環效率至關重要。為了規避市場風險,供應商正在推出模組化混合式冷卻系統,該系統可改裝到現有的蒸發式冷卻罐上,從而有效地改造傳統設備。材料技術的進步,例如親水性薄膜填充材,有望使混合式冷卻系統的出口溫度更接近濕式運作基準值,從而加劇都市區醫院和半導體工廠等對煙霧控制要求極高的場所的競爭。
冷卻塔市場報告按流量類型(橫流式和逆流式)、塔類型(蒸發式、乾式、混合式)、容量範圍(小於 5 MW、5-20 MW、大於 20 MW)、應用(石油和天然氣、化工和石化、發電、暖通空調製冷、資料中心、紙漿和造紙、食品和飲料、其他地區進行細分、歐洲地區和其他地區進行亞積水。
區域分析
亞太地區佔冷卻塔市場43.70%的佔有率,預計在中印兩國電力、石化和資料中心基礎設施同步投資的推動下,將以6.78%的複合年成長率成長。中國的核能-蒸氣汽電共生模式代表了該地區的綜合發展模式,將工業脫碳目標與製程熱最佳化相結合。印度正在加大火電廠維修的力度,採用混合式冷卻塔,以符合即將推出的限制用水強度的國家水資源標準。
在北美,資料中心擴建的需求(主要集中在維吉尼亞、德克薩斯州和太平洋西北地區)推動了煉油廠維修的需求,以去除 PFAS填充材。美國暖氣、冷氣與空調工程師學會 (ASHRAE) 和美國環保署 (EPA) 的嚴格指導方針,促使人們更傾向於採購經 CTI 認證的低漂移冷卻水塔。在歐洲,德國和斯堪地那維亞的區域能源項目採用混合式乾濕組合冷卻塔,以平衡水資源管理和應對季節性負荷波動,從而保持了溫和的成長。在非洲,淡水短缺推動了對零排放循環的需求,導致與太陽熱能發電和海水淡化聯合裝置相關的海水冷卻冷卻塔和乾式冷卻水塔的應用日益增加。南美洲的成長主要集中在巴西的礦區和阿根廷的大豆加工中心,這兩個地區都在採用 20MW 以上的逆流式冷卻塔來應對高粉塵和負荷波動問題。這些區域趨勢表明,即使在不同的氣候和法規環境下,冷卻塔市場也具有很強的韌性。
其他福利:
- Excel格式的市場預測(ME)表
- 3個月的分析師支持
目錄
第1章 引言
- 研究假設和市場定義
- 調查範圍
第2章調查方法
第3章執行摘要
第4章 市場情勢
- 市場概覽
- 市場促進因素
- 商業地產中暖通空調設備的擴建
- 亞洲和中東的發電廠裝置容量成長
- 嚴格的用水和能源效率法規(CTI、ASHRAE)
- 新興經濟體的工業化與煉油升級
- 超大規模資料中心園區建設快速擴張
- 需要製程冷卻的綠色氫電解計劃
- 市場限制
- 高昂的營業成本和對缺水問題的擔憂
- 煙羽抑制/漂移物清除監管合規成本
- 向功率小於1MW範圍內的絕熱乾式冷卻器過渡
- 逐步淘汰 PFAS填充材導致維修多於新建設。
- 供應鏈分析
- 監管環境
- 技術展望
- 波特五力模型
- 供應商的議價能力
- 消費者議價能力
- 新進入者的威脅
- 替代品的威脅
- 競爭對手之間的競爭
第5章 市場規模與成長預測
- 按流量類型
- 交叉流
- 回流
- 按塔型
- 蒸發冷卻
- 乾燥
- 混合型(乾濕兩用)
- 按容量範圍
- 小於5兆瓦
- 5~20MW
- 超過20兆瓦
- 透過使用
- 石油和天然氣
- 化工/石油化工
- 發電
- 暖通空調(適用於商業大樓)
- 資料中心
- 紙漿和造紙
- 食品/飲料
- 其他
- 按地區
- 北美洲
- 美國
- 加拿大
- 墨西哥
- 歐洲
- 德國
- 英國
- 法國
- 義大利
- 西班牙
- 俄羅斯
- 其他歐洲地區
- 亞太地區
- 中國
- 印度
- 日本
- 韓國
- 東南亞國協
- 亞太其他地區
- 南美洲
- 巴西
- 阿根廷
- 南美洲其他地區
- 中東和非洲
- 沙烏地阿拉伯
- 阿拉伯聯合大公國
- 卡達
- 南非
- 埃及
- 其他中東和非洲地區
- 北美洲
第6章 競爭情勢
- 市場集中度
- 策略性舉措(併購、夥伴關係、購電協議)
- 市場佔有率分析(主要企業的市場排名和佔有率)
- 公司簡介
- SPX Technologies, Inc.
- Baltimore Aircoil Company, Inc.
- EVAPCO, Inc.
- Johnson Controls International plc
- Hamon and CIE(John Cockerill SA)
- Brentwood Industries, Inc.
- Babcock and Wilcox Enterprises, Inc.
- ENEXIO Management GmbH
- Thermax Ltd.
- Artech Cooling Towers Pvt. Ltd.
- Kelvion Holding GmbH
- Paharpur Cooling Towers Ltd.
- Liang Chi Industry Co., Ltd.
- Star Cooling Towers Pvt. Ltd.
- Delta Cooling Towers, Inc.
- Reymsa Cooling Towers, Inc.
- SPIG SpA(BandW)
- Kimre, Inc.
- Mesan Group
第7章 市場機會與未來展望
Cooling Tower Market size in 2026 is estimated at USD 4.59 billion, growing from 2025 value of USD 4.37 billion with 2031 projections showing USD 5.89 billion, growing at 5.09% CAGR over 2026-2031.
Continued capital formation in power generation and the build-out of hyperscale data-center campuses keep high-capacity evaporative systems in demand, while hybrid wet-dry designs scale faster as operators react to tightening water-use and energy-efficiency regulations. The accelerated adoption of counter-flow configurations, growth in installations exceeding 20 MW, and the shift to PFAS-free fill materials further reinforce the cooling tower market's growth trajectory. Suppliers capable of integrating digital twin analytics, predictive maintenance, and alternative make-up-water schemes hold an execution edge as sustainability mandates intensify.
Global Cooling Tower Market Trends and Insights
Expanding HVACR Installations in Commercial Real-Estate
The rapid commercialization of mixed-use complexes and high-specification data centers is driving developers toward higher-capacity, digitally monitored evaporative and hybrid systems. Johnson Controls reported a USD 13.1 billion order backlog as smart-building owners specify cooling towers equipped with demand-responsive controls that synchronize with building automation servers. The integration of IoT sensors enables predictive maintenance routines that reduce downtime. Projects in water-stressed localities are increasingly selecting hybrid wet-dry units to meet compliance thresholds without compromising load-following capability. Suppliers that can validate real-world energy savings through CTI-certified performance testing gain a procurement advantage when property investors audit sustainability metrics.
Power Plant Capacity Additions in Asia and Middle East
Utilities in China, India, and the Gulf states are scaling nuclear, gas-fired, and renewable-hybrid plants that require high-capacity counter-flow towers to manage variable steam loads. China's Heqi-1 industrial steam linkage delivers 4.8 million tonnes of process steam annually, underscoring the commercial benefits of integrating cooling towers into industrial heat-recovery loops. GCC utilities adopt seawater-cooled towers at coastal Combined Cycle Gas Turbine sites, reducing freshwater withdrawal and enabling capacity factors above 40% in extreme ambient temperatures. The Middle East's move toward solar-thermal augmentation further positions hybrid systems as compliance-ready for future carbon pricing schemes.
High Operating Cost and Water-Scarcity Concerns
The total cost of ownership is rising because chemical conditioning and discharge fees now exceed electricity costs in many arid markets. Pacific Northwest National Laboratory case studies show that military installations are lowering makeup water demand by recovering HVAC condensate and rainwater; however, capital outlays for integrated storage push payback periods beyond five years. Facilities in Australia and the Middle East, where water charges exceed USD 5 per 1,000 gallons, are increasingly justifying dry cooling or hybrid designs despite efficiency penalties. Suppliers that bundle performance guarantees with water-saving retrofits secure longer-term service contracts that smooth revenue volatility during new-build lulls.
Other drivers and restraints analyzed in the detailed report include:
- Stringent Water-Use and Energy-Efficiency Mandates
- Rapid Build-Out of Hyperscale Data-Center Campuses
- PFAS-Fill Material Phase-Out Increasing Retrofit Demand
For complete list of drivers and restraints, kindly check the Table Of Contents.
Segment Analysis
Counter-flow installations captured 43.10% of the revenue in 2025 and are growing at a 7.69% CAGR, as data-center and pharmaceutical clients prioritize high L/G ratios and smaller footprints. Industrial heat-pump projects that couple counter-flow towers with process chillers deliver annual energy savings of over 15%, directly improving OPEX sensitivity in food & beverage plants. Cross-flow towers retain an installed-base advantage, particularly at coal and gas turbines, where low static-pressure drops ease auxiliary load. However, their share is expected to erode as water tariff escalators favor a more stringent approach to temperature control. Digital twin simulations confirm that counter-flow designs can cut operating cost by 5% when integrated with predictive reservoir management, further propelling share gains.
Legacy cross-flow units remain attractive for retrofit because fill packs are more accessible, and large surface areas accommodate fouling without immediate performance loss. Owners pursuing phased compliance strategies often refurbish cross-flow cells with low-drift eliminators to postpone capital replacement. Even so, new industrial complexes in Southeast Asia are standardizing counter-flow towers sized for a design wet-bulb depression of more than 10 °C, signaling a structural pivot that will reshape manufacturer product portfolios over the decade.
Hybrid wet-dry models are advancing at an 8.34% CAGR, outpacing evaporative towers, which are expected to hold a 66.40% share in 2025. Utilities in water-stressed areas appreciate hybrid designs that switch to dry mode during drought restrictions, maintaining thermal compliance while cutting seasonal water draw by 50%. Field trials of perforated dew-point indirect evaporative modules confirm that supply-air ratios below 0.5 achieve optimal thermal efficiency gains, positioning hybrids as viable replacements for plume-abatement retrofits.
Evaporative towers dominate high-capacity applications because wet operation achieves approach temperatures within 3 °C of the wet-bulb temperature, which is crucial for steam-cycle efficiency. Suppliers hedge market risk by launching modular hybrid lines that retrofit onto evaporative basins, effectively transforming legacy assets. Material advances such as hydrophilic membrane fill promise to push hybrid outlet temperatures closer to wet operation benchmarks, intensifying competition for urban hospitals and semiconductor fabs where plume mitigation is non-negotiable.
The Cooling Tower Market Report is Segmented by Flow Type (Cross-Flow and Counter-Flow), Tower Type (Evaporative, Dry, and Hybrid), Capacity Range (Below 5 MW, 5 To 20 MW, and Above 20 MW), Application (Oil and Gas, Chemical and Petrochemical, Power Generation, HVACR, Data Centers, Pulp and Paper, Food and Beverage, and Others), and Geography (North America, Europe, Asia Pacific, South America, and Middle East and Africa).
Geography Analysis
The Asia-Pacific region commands 43.70% of the cooling tower market and is expected to grow at a 6.78% CAGR, driven by synchronized investments in power, petrochemical, and data center infrastructure across China and India. China's nuclear-steam cogeneration model exemplifies the region's integrated approach, combining industrial decarbonization targets with process heat optimization. India's thermal power refurbishments increasingly specify hybrid towers to conform with draft national water norms that cap withdrawal intensity.
North America registers demand primarily from data-center expansions clustered in Virginia, Texas, and the Pacific Northwest, paired with refinery retrofits to remove PFAS-based fill. Stringent ASHRAE and EPA guidelines further shape procurement toward CTI-certified, low-drift cells. Europe sustains moderate growth as district energy schemes in Germany and Scandinavia adopt hybrid wet-dry towers to balance water stewardship and seasonal load variation. The Middle East and Africa are witnessing a rising uptake of seawater and dry towers attached to solar-thermal and desalination complexes, where freshwater scarcity commands a premium on zero-discharge cycles. South American momentum concentrates in Brazil's mining corridors and Argentina's soy-crushing hubs, both leaning on >20 MW counter-flow towers to handle high dust and variable loading. Collectively, these regional dynamics validate the cooling tower market's resilience across climatic and regulatory mosaics.
- SPX Technologies, Inc.
- Baltimore Aircoil Company, Inc.
- EVAPCO, Inc.
- Johnson Controls International plc
- Hamon and CIE (John Cockerill SA)
- Brentwood Industries, Inc.
- Babcock and Wilcox Enterprises, Inc.
- ENEXIO Management GmbH
- Thermax Ltd.
- Artech Cooling Towers Pvt. Ltd.
- Kelvion Holding GmbH
- Paharpur Cooling Towers Ltd.
- Liang Chi Industry Co., Ltd.
- Star Cooling Towers Pvt. Ltd.
- Delta Cooling Towers, Inc.
- Reymsa Cooling Towers, Inc.
- SPIG S.p.A (BandW)
- Kimre, Inc.
- Mesan Group
Additional Benefits:
- The market estimate (ME) sheet in Excel format
- 3 months of analyst support
TABLE OF CONTENTS
1 Introduction
- 1.1 Study Assumptions & Market Definition
- 1.2 Scope of the Study
2 Research Methodology
3 Executive Summary
4 Market Landscape
- 4.1 Market Overview
- 4.2 Market Drivers
- 4.2.1 Expanding HVACR installations in commercial real-estate
- 4.2.2 Power?plant capacity additions in Asia and Middle East
- 4.2.3 Stringent water-use and energy-efficiency mandates (CTI, ASHRAE)
- 4.2.4 Industrialization and refinery upgrades in emerging economies
- 4.2.5 Rapid build-out of hyperscale data-center campuses
- 4.2.6 Green hydrogen electrolyzer projects needing process cooling
- 4.3 Market Restraints
- 4.3.1 High operating cost and water?scarcity concerns
- 4.3.2 Plume-abatement/drift-elimination compliance costs
- 4.3.3 Shift toward adiabatic dry coolers in below 1 MW range
- 4.3.4 PFAS-fill material phase-out increasing retrofit over new build
- 4.4 Supply-Chain Analysis
- 4.5 Regulatory Landscape
- 4.6 Technological Outlook
- 4.7 Porter's Five Forces
- 4.7.1 Bargaining Power of Suppliers
- 4.7.2 Bargaining Power of Consumers
- 4.7.3 Threat of New Entrants
- 4.7.4 Threat of Substitutes
- 4.7.5 Intensity of Competitive Rivalry
5 Market Size & Growth Forecasts
- 5.1 By Flow Type
- 5.1.1 Cross-Flow
- 5.1.2 Counter-Flow
- 5.2 By Tower Type
- 5.2.1 Evaporative
- 5.2.2 Dry
- 5.2.3 Hybrid (Wet-Dry)
- 5.3 By Capacity Range
- 5.3.1 Below 5 MW
- 5.3.2 5 to 20 MW
- 5.3.3 Above 20 MW
- 5.4 By Application
- 5.4.1 Oil and Gas
- 5.4.2 Chemical and Petrochemical
- 5.4.3 Power Generation
- 5.4.4 HVACR (Commercial Buildings)
- 5.4.5 Data Centers
- 5.4.6 Pulp and Paper
- 5.4.7 Food and Beverage
- 5.4.8 Others
- 5.5 By Geography
- 5.5.1 North America
- 5.5.1.1 United States
- 5.5.1.2 Canada
- 5.5.1.3 Mexico
- 5.5.2 Europe
- 5.5.2.1 Germany
- 5.5.2.2 United Kingdom
- 5.5.2.3 France
- 5.5.2.4 Italy
- 5.5.2.5 Spain
- 5.5.2.6 Russia
- 5.5.2.7 Rest of Europe
- 5.5.3 Asia Pacific
- 5.5.3.1 China
- 5.5.3.2 India
- 5.5.3.3 Japan
- 5.5.3.4 South Korea
- 5.5.3.5 ASEAN Countries
- 5.5.3.6 Rest of Asia Pacific
- 5.5.4 South America
- 5.5.4.1 Brazil
- 5.5.4.2 Argentina
- 5.5.4.3 Rest of South America
- 5.5.5 Middle East and Africa
- 5.5.5.1 Saudi Arabia
- 5.5.5.2 United Arab Emirates
- 5.5.5.3 Qatar
- 5.5.5.4 South Africa
- 5.5.5.5 Egypt
- 5.5.5.6 Rest of Middle East and Africa
- 5.5.1 North America
6 Competitive Landscape
- 6.1 Market Concentration
- 6.2 Strategic Moves (MandA, Partnerships, PPAs)
- 6.3 Market Share Analysis (Market Rank/Share for key companies)
- 6.4 Company Profiles (includes Global level Overview, Market level overview, Core Segments, Financials as available, Strategic Information, Products and Services, and Recent Developments)
- 6.4.1 SPX Technologies, Inc.
- 6.4.2 Baltimore Aircoil Company, Inc.
- 6.4.3 EVAPCO, Inc.
- 6.4.4 Johnson Controls International plc
- 6.4.5 Hamon and CIE (John Cockerill SA)
- 6.4.6 Brentwood Industries, Inc.
- 6.4.7 Babcock and Wilcox Enterprises, Inc.
- 6.4.8 ENEXIO Management GmbH
- 6.4.9 Thermax Ltd.
- 6.4.10 Artech Cooling Towers Pvt. Ltd.
- 6.4.11 Kelvion Holding GmbH
- 6.4.12 Paharpur Cooling Towers Ltd.
- 6.4.13 Liang Chi Industry Co., Ltd.
- 6.4.14 Star Cooling Towers Pvt. Ltd.
- 6.4.15 Delta Cooling Towers, Inc.
- 6.4.16 Reymsa Cooling Towers, Inc.
- 6.4.17 SPIG S.p.A (BandW)
- 6.4.18 Kimre, Inc.
- 6.4.19 Mesan Group
7 Market Opportunities & Future Outlook
- 7.1 White-space and Unmet-Need Assessment
 2026年全球現場安裝冷卻塔市場報告
 全球冷卻塔市場規模、佔有率、趨勢和成長分析報告(2026-2034年)2026年全球冷卻水塔市場報告全球冷卻水塔市場:市場規模、佔有率、成長率、產業分析、依類型、應用和地區劃分的分析以及未來預測(2026-2034)
 冷卻塔市場-全球產業規模、佔有率、趨勢、機會、預測:按產品、材料、應用、區域和競爭格局分類,2021-2031年現場安裝式冷卻塔市場 - 全球產業規模、佔有率、趨勢、機會及預測(按類型、設計、最終用戶、地區和競爭格局分類,2021-2031年)
 日本冷卻水塔市場報告(按塔型、流型、設計、結構材料(纖維增強塑膠、鋼材、混凝土、木材、高密度聚乙烯及其他)、最終用戶和地區分類,2026-2034年)
 冷卻塔市場機會、成長要素、產業趨勢分析及預測(2026年至2035年)
 冷卻塔市場規模、佔有率和成長分析(按類型、設計、建築材料、流量類型、技術、應用和地區分類)-2026-2033年產業預測
 2025-2029年全球混合冷卻塔市場