


 |
市場調查報告書
商品編碼
1940841
越南化肥:市場佔有率分析、產業趨勢與統計、成長預測(2026-2031)Vietnam Fertilizers - Market Share Analysis, Industry Trends & Statistics, Growth Forecasts (2026 - 2031) |
||||||
※ 本網頁內容可能與最新版本有所差異。詳細情況請與我們聯繫。
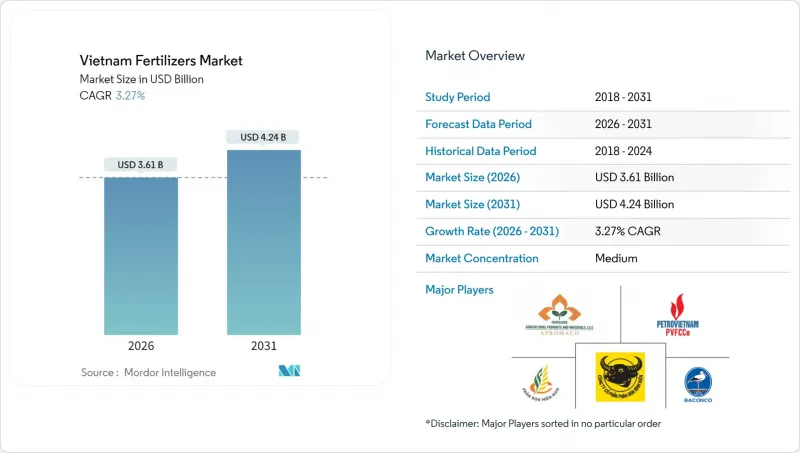
預計到 2026 年,越南化肥市場規模將達到 36.1 億美元,高於 2025 年的 35 億美元。
預計到 2031 年將達到 42.4 億美元,2026 年至 2031 年的複合年成長率為 3.27%。
越南受益於國內尿素盈餘、強力的政府現代化計劃以及對柬埔寨、韓國和菲律賓不斷擴大的出口。物流成本上升以及因引入5%的新增值稅而導致的成本結構變化帶來了競爭壓力,但稅額扣抵抵免最終有利於國內生產商。對精準施肥系統和高價值出口作物專用肥料的需求推動了技術投資,而仿冒品進口產品以及對鉀鹽和磷酸二銨的依賴繼續擠壓利潤空間。同時,主要企業積極擴張產能以及與全球經銷商建立合作關係,正在鞏固越南作為區域化肥中心的地位。
越南化肥市場趨勢與分析
國內尿素過剩推動出口擴張
越南每年尿素盈餘約120萬噸,預計2024年出口量將達173萬噸(價值7.0991億美元),較2023年成長11.7%。柬埔寨佔越南尿素出口總量的34.3%,韓國佔12.7%,菲律賓佔6.3%。富美和金甌一體化天然氣聯合裝置確保了原料價格的競爭力,從而帶來成本優勢。擴大出口分散了運輸風險,提高了工廠運轉率,即使國內需求放緩,也能支撐國內收入。
5%的增值稅免稅降低了國內生產成本
越南化肥市場實施5%的增值稅(VAT)免稅政策,將降低國內生產商的生產成本,並增強其相對於進口產品的競爭力。自2025年7月1日起,消費稅免稅政策將過渡到5%的課稅制度,屆時生產商可就天然氣和設備申請稅額扣抵。與全額課稅的進口化肥相比,這項稅制改革將降低淨生產成本。雖然此舉會增加營運資金需求,但也會提高國內企業的利潤率,尤其是在磷酸二銨(DAP)和鉀肥進口價格上漲的旺季。
向偏遠地區運送液態肥料和控釋肥料(CRF)的物流成本很高
在越南,向偏遠地區運輸液態和緩釋肥料(CRF)的高昂物流成本限制了市場成長。這些成本推高了最終價格,降低了肥料的普及率,並阻礙了市場滲透。基礎設施的限制、供應鏈效率低下以及對國際航運的依賴,使得越南的物流成本在農業企業收入中佔據了相當大的比例。運輸成本佔越南肥料物流成本的60%,遠高於30%的全球平均。疫情前,海運成本為每個貨櫃3000美元,到2024年預計將上漲至14,000美元。此外,通往西北部山區的公路交通仍然有限。液態和緩釋肥料的溫控運輸要求進一步增加了運輸成本,限制了Delta地區以外地區對特殊肥料的採用。
細分市場分析
2025年,單一成分肥料佔越南肥料市場佔有率的76.65%,預計到2031年將以3.42%的複合年成長率快速成長,主要受水稻、玉米和甘蔗種植中對成本敏感的小規模的需求推動。在這一類別中,尿素受益於國內生產的經濟效益,而磷酸二銨(DAP)和磷酸一銨(MAP)仍依賴進口,導致價格波動。複合肥料雖然市佔率較小,但由於人工林主對添加硫和微量元素的均衡氮磷鉀(NPK)肥料的需求,其成長速度更快。
尿素的供應支持傳統的撒施方式,但氮素揮發造成的損失促使人們關注抑制劑和包膜技術。複合肥配方在以出口產量為目標的咖啡和水果種植者中越來越受歡迎。雖然微量元素配方尚處於發展初期,但它們正在解決紅壤中常見的鋅和硼缺乏問題,並有助於提高水果品質。預計到2030年,政府持續進行營養管理的教育將推動市場對均衡配方的需求成長。
截至2025年,傳統顆粒肥料佔越南肥料市場94.85%的佔有率,反映出越南完善的分銷網路和對施肥設備的熟悉程度。受灌溉施肥和溫室種植面積擴大的推動,特種肥料預計到2031年將以3.58%的複合年成長率成長。水溶性晶體和液體懸浮液在滴灌熱帶果園中吸收迅速,與顆粒肥料相比,養分利用率更高。
儘管緩效肥料價格較高,且運往偏遠地區需要高昂的運輸成本,但大型咖啡農場願意支付更高的成本以降低人事費用。微生物接種劑和富含腐植酸的液體肥料能夠解決土壤健康問題,並符合有機認證標準。數位化平台的擴展使特種肥料生產商能夠有效率地滿足小眾市場需求,從而鼓勵大型生產商實現產品系列多元化。
越南化肥市場按類型(複合肥和單質肥)、形態(常規型和特種型)、施用方法(灌溉施肥、葉面噴布、土壤施用)和作物類型(田間作物、園藝作物等)進行細分。市場預測以價值(美元)和數量(公噸)為單位。
其他福利:
- Excel格式的市場預測(ME)表
- 3個月的分析師支持
目錄
第1章 引言
- 研究假設和市場定義
- 調查範圍
- 調查方法
第2章 報告
第3章執行摘要主要發現
第4章 主要產業趨勢
- 主要農作物種植面積
- 田間作物
- 園藝作物
- 平均施肥量
- 微量營養素
- 田間作物
- 園藝作物
- 宏量營養素
- 田間作物
- 園藝作物
- 次發性大量營養素
- 田間作物
- 園藝作物
- 微量營養素
- 具有灌溉設施的農田
- 法律規範
- 價值鍊和通路分析
- 市場促進因素
- 國內尿素產能過剩推動出口擴張
- 增值稅豁免將降低當地生產成本。
- 轉向高價值出口作物的特殊等級
- 在湄公河和紅河Delta地區引進精準施肥灌溉
- 政府有機肥目標(到2050年佔種植面積的50%)
- 向小規模農戶推廣電子商務分銷平台
- 市場限制
- 將液態肥料和控釋肥運往偏遠地區的物流成本很高
- 仿冒品偽劣進口商品損害了農民的信任。
- 對鉀肥和磷酸二銨進口的依賴使該國容易受到價格波動的影響。
- 季節性庫存過剩會對生產商的利潤率帶來壓力。
第5章 市場規模及成長預測(數量與價值)
- 類型
- 複合肥
- 單一肥料
- 微量營養素
- 硼
- 銅
- 鐵
- 錳
- 鉬
- 鋅
- 其他
- 氮基
- 尿素
- 其他
- 磷酸鹽
- DAP
- MAP
- TSP
- 其他
- 鉀肥
- MoP
- SoP
- 其他
- 次發性大量營養素
- 鈣
- 鎂
- 硫
- 微量營養素
- 形式
- 傳統的
- 特殊肥料
- CRF
- 液體肥料
- SRF
- 水溶性
- 應用方法
- 施肥和灌溉
- 葉面噴布
- 土壤
- 作物類型
- 田間作物
- 園藝作物
- 草坪和觀賞植物
第6章 競爭情勢
- 關鍵策略舉措
- 市佔率分析
- 公司概況
- 公司簡介
- PetroVietnam Fertilizer and Chemical Corporation
- PetroVietnam Ca Mau Fertilizer Joint Stock Company
- Baconco Company Limited
- Binh Dien Fertilizer Joint Stock Company
- Duc Giang Chemical Group Joint Stock Company
- Southern Fertilizer Joint Stock Company
- Ninh Binh Phosphate Fertilizer Joint Stock Company
- Agricultural Products and Materials Joint Stock Company
- Haifa Chemicals Ltd.
- Yara International ASA
- Grupa Azoty SA
- Lam Thao Fertilizers and Chemicals Joint Stock Company
- Song Gianh Corporation
- Que Lam Group Joint Stock Company
- Israel Chemicals Ltd.
- Nutrien Ltd.
第7章:CEO們需要思考的關鍵策略問題
Vietnam fertilizers market size in 2026 is estimated at USD 3.61 billion, growing from 2025 value of USD 3.5 billion with 2031 projections showing USD 4.24 billion, growing at 3.27% CAGR over 2026-2031.
Vietnam benefits from surplus domestic urea, strong government modernization programs, and growing exports to Cambodia, South Korea, and the Philippines. Competitive pressure comes from logistics inflation and a new 5% VAT that changes cost dynamics, yet the tax credit mechanism ultimately favors local producers. Precision-fertigation systems and specialty fertilizer demand for high-value export crops are driving technology investment, while counterfeit imports and dependence on potash and DAP continue to weigh on margins. Meanwhile, aggressive capacity additions by domestic leaders and alliances with global distributors strengthen Vietnam's role as a regional fertilizer hub.
Vietnam Fertilizers Market Trends and Insights
Surplus Domestic Urea Driving Export Push
Vietnam produces a urea surplus of about 1.2 million metric tons annually, enabling 2024 exports of 1.73 million metric tons valued at USD 709.91 million, a 11.7% volume jump over 2023. Cambodia absorbed 34.3% of shipments, followed by South Korea at 12.7% and the Philippines at 6.3%. Cost advantages stem from integrated gas-based complexes in Phu My and Ca Mau that secure competitive feedstock pricing. The export momentum spreads freight risk and lifts plant utilization, thus buoying domestic earnings even when local demand moderates.
Pending 5% VAT Credit Lowers Local Production Cost
The implementation of 5% VAT credits in Vietnam's fertilizer market reduces production costs for domestic manufacturers, enhancing their competitiveness against imports. The transition from VAT exemption to a 5% VAT regime, effective July 1, 2025, enables producers to reclaim input VAT on natural gas and equipment. This tax adjustment decreases net production costs compared to imported fertilizers subject to full taxation. While the measure increases working capital requirements, it strengthens profit margins for domestic companies, particularly during peak seasons when diammonium phosphate (DAP) and potash import prices increase.
High Logistics Cost for Liquids and CRF to Remote Provinces
The high logistics costs associated with transporting liquid fertilizers and Controlled-Release Fertilizers (CRFs) to Vietnam's remote provinces constrain market growth. These costs increase final prices, reduce adoption rates, and restrict market penetration. Vietnam's logistics expenses constitute a significant portion of agricultural business revenue due to infrastructure limitations, supply chain inefficiencies, and dependence on international shipping. Transportation represents 60% of fertilizer logistics costs in Vietnam, compared to the global average of 30%. Ocean freight costs increased from USD 3,000 per container before the pandemic to USD 14,000 in 2024 . Additionally, road accessibility to the mountainous Northwest region remains restricted. The temperature-controlled shipping requirements for liquid and controlled-release fertilizers further increase delivery costs, limiting specialty fertilizer adoption beyond the delta regions.
Other drivers and restraints analyzed in the detailed report include:
- Precision-Fertigation Adoption in Mekong and Red River Deltas
- Government Organic Fertilizer Targets
- Potash and DAP Import Dependence - Exposed to Price Shocks
For complete list of drivers and restraints, kindly check the Table Of Contents.
Segment Analysis
Straight fertilizers captured 76.65% of the Vietnam fertilizers market share in 2025 and show the fastest growth of CAGR 3.42% by 2031, driven by cost-sensitive smallholder practices in rice, corn, and sugarcane production. Within this group, urea benefits from strong domestic production economics, whereas DAP and MAP remain import-dependent, adding price volatility. Complex fertilizers account for a smaller slice yet expand faster as plantation operators seek balanced NPK blends with sulfur and micronutrients.
Urea's accessibility underpins traditional broadcast application, but nitrogen losses through volatilization spur interest in inhibitors and coating technologies. Complex blends find traction with coffee and fruit growers targeting export-grade yields. Micronutrient formulations, though nascent, address zinc and boron deficiencies common in lateritic soils, lifting fruit quality premiums. Continued government education on nutrient stewardship is anticipated to shift volumes toward balanced formulas by decade-end.
Conventional granules dominated 94.85% of the Vietnamese fertilizers market in 2025, reflecting entrenched distribution networks and familiarity with broadcasting tools. Specialty forms posted a 3.58% CAGR through 2031 due to fertigation and greenhouse growth. Water-soluble crystals and liquid suspensions generate rapid uptake in drip-irrigated tropical fruit orchards, improving nutrient efficiency relative to granular top-dressing.
Controlled-release fertilizers command premium pricing and face steep freight costs to remote provinces, but large coffee estates accept higher outlays to cut labor costs. Microbial inoculants and humic-enriched liquids address soil health concerns and meet organic certification criteria. As digital platforms expand, specialty suppliers can serve niche demand efficiently, encouraging portfolio diversification among major producers.
The Vietnam Fertilizers Market is Segmented by Type (Complex and Straight), Form (Conventional and Specialty), Application Mode (Fertigation, Foliar, and Soil), and Crop Type (Field Crops, Horticultural Crops, and More). The Market Forecasts are Provided in Terms of Value (USD) and Volume (Metric Tons).
List of Companies Covered in this Report:
- PetroVietnam Fertilizer and Chemical Corporation
- PetroVietnam Ca Mau Fertilizer Joint Stock Company
- Baconco Company Limited
- Binh Dien Fertilizer Joint Stock Company
- Duc Giang Chemical Group Joint Stock Company
- Southern Fertilizer Joint Stock Company
- Ninh Binh Phosphate Fertilizer Joint Stock Company
- Agricultural Products and Materials Joint Stock Company
- Haifa Chemicals Ltd.
- Yara International ASA
- Grupa Azoty S.A.
- Lam Thao Fertilizers and Chemicals Joint Stock Company
- Song Gianh Corporation
- Que Lam Group Joint Stock Company
- Israel Chemicals Ltd.
- Nutrien Ltd.
Additional Benefits:
- The market estimate (ME) sheet in Excel format
- 3 months of analyst support
TABLE OF CONTENTS
1 INTRODUCTION
- 1.1 Study Assumptions & Market Definition
- 1.2 Scope of the Study
- 1.3 Research Methodology
2 REPORT OFFERS
3 EXECUTIVE SUMMARY & KEY FINDINGS
4 KEY INDUSTRY TRENDS
- 4.1 Acreage Of Major Crop Types
- 4.1.1 Field Crops
- 4.1.2 Horticultural Crops
- 4.2 Average Nutrient Application Rates
- 4.2.1 Micronutrients
- 4.2.1.1 Field Crops
- 4.2.1.2 Horticultural Crops
- 4.2.2 Primary Nutrients
- 4.2.2.1 Field Crops
- 4.2.2.2 Horticultural Crops
- 4.2.3 Secondary Macronutrients
- 4.2.3.1 Field Crops
- 4.2.3.2 Horticultural Crops
- 4.2.1 Micronutrients
- 4.3 Agricultural Land Equipped For Irrigation
- 4.4 Regulatory Framework
- 4.5 Value Chain & Distribution Channel Analysis
- 4.6 Market Drivers
- 4.6.1 Surplus domestic urea driving export push
- 4.6.2 Pending 5 % VAT credit lowers local production cost
- 4.6.3 Shift to specialty grades for high-value export crops
- 4.6.4 Precision-fertigation adoption in Mekong & Red River deltas
- 4.6.5 Government organic-fertilizer targets (50 % area by 2050)
- 4.6.6 E-commerce distribution platforms reaching smallholders
- 4.7 Market Restraints
- 4.7.1 High logistics cost for liquids & CRF to remote provinces
- 4.7.2 Counterfeit & sub-standard imports eroding farmer trust
- 4.7.3 Potash & DAP import dependence exposed to price shocks
- 4.7.4 Seasonal inventory glut depressing producer margins
5 MARKET SIZE AND GROWTH FORECASTS (VALUE AND VOLUME)
- 5.1 Type
- 5.1.1 Complex
- 5.1.2 Straight
- 5.1.2.1 Micronutrients
- 5.1.2.1.1 Boron
- 5.1.2.1.2 Copper
- 5.1.2.1.3 Iron
- 5.1.2.1.4 Manganese
- 5.1.2.1.5 Molybdenum
- 5.1.2.1.6 Zinc
- 5.1.2.1.7 Others
- 5.1.2.2 Nitrogenous
- 5.1.2.2.1 Urea
- 5.1.2.2.2 Others
- 5.1.2.3 Phosphatic
- 5.1.2.3.1 DAP
- 5.1.2.3.2 MAP
- 5.1.2.3.3 TSP
- 5.1.2.3.4 Others
- 5.1.2.4 Potassic
- 5.1.2.4.1 MoP
- 5.1.2.4.2 SoP
- 5.1.2.4.3 Others
- 5.1.2.5 Secondary Macronutrients
- 5.1.2.5.1 Calcium
- 5.1.2.5.2 Magnesium
- 5.1.2.5.3 Sulfur
- 5.1.2.1 Micronutrients
- 5.2 Form
- 5.2.1 Conventional
- 5.2.2 Speciality
- 5.2.2.1 CRF
- 5.2.2.2 Liquid Fertilizer
- 5.2.2.3 SRF
- 5.2.2.4 Water Soluble
- 5.3 Application Mode
- 5.3.1 Fertigation
- 5.3.2 Foliar
- 5.3.3 Soil
- 5.4 Crop Type
- 5.4.1 Field Crops
- 5.4.2 Horticultural Crops
- 5.4.3 Turf & Ornamental
6 COMPETITIVE LANDSCAPE
- 6.1 Key Strategic Moves
- 6.2 Market Share Analysis
- 6.3 Company Landscape
- 6.4 Company Profiles (Includes Global Level Overview, Market Level Overview, Core Business Segments, Financials, Headcount, Key Information, Market Rank, Market Share, Products and Services, and Analysis of Recent Developments)
- 6.4.1 PetroVietnam Fertilizer and Chemical Corporation
- 6.4.2 PetroVietnam Ca Mau Fertilizer Joint Stock Company
- 6.4.3 Baconco Company Limited
- 6.4.4 Binh Dien Fertilizer Joint Stock Company
- 6.4.5 Duc Giang Chemical Group Joint Stock Company
- 6.4.6 Southern Fertilizer Joint Stock Company
- 6.4.7 Ninh Binh Phosphate Fertilizer Joint Stock Company
- 6.4.8 Agricultural Products and Materials Joint Stock Company
- 6.4.9 Haifa Chemicals Ltd.
- 6.4.10 Yara International ASA
- 6.4.11 Grupa Azoty S.A.
- 6.4.12 Lam Thao Fertilizers and Chemicals Joint Stock Company
- 6.4.13 Song Gianh Corporation
- 6.4.14 Que Lam Group Joint Stock Company
- 6.4.15 Israel Chemicals Ltd.
- 6.4.16 Nutrien Ltd.
7 KEY STRATEGIC QUESTIONS FOR FERTILIZER CEOS
 2026年全球生物炭肥料市場報告
 幾丁質肥料市場:2026-2032年全球市場預測(按應用、類型、原料、配方和分銷管道分類)肥料包膜市場:2026-2032年全球市場預測(以包膜化學、釋放機制、包膜養分類型、外形規格、製造流程、最終用途及通路分類)化肥市場:2026-2032年全球市場預測(依產品類型、作物類型、包裝、施用方法、最終用戶和分銷管道分類)藻類肥料市場:2026-2032年全球市場預測(依原料、產品類型、通路及應用分類)複合肥料市場:按產品類型、作物類型、物理形態和應用分類的全球市場預測,2026-2032年顆粒肥料市場:依產品類型、作物類型、配方類型、施用方法、包裝類型、使用時間、最終用戶和銷售管道分類-2026-2032年全球預測
 矽肥市場報告:按類型、形態、應用和地區分類(2026-2034年)
 ATS肥料市場規模、佔有率和成長分析:按產品類型、形態、應用、作物類型、最終用戶、分銷管道和地區分類 - 2026-2033年行業預測
 美國化肥:市場佔有率分析、產業趨勢與統計、成長預測(2026-2031)