


 |
市場調查報告書
商品編碼
1940789
美國智慧電錶:市場佔有率分析、產業趨勢與統計、成長預測(2026-2031 年)United States Smart Meter - Market Share Analysis, Industry Trends & Statistics, Growth Forecasts (2026 - 2031) |
||||||
※ 本網頁內容可能與最新版本有所差異。詳細情況請與我們聯繫。
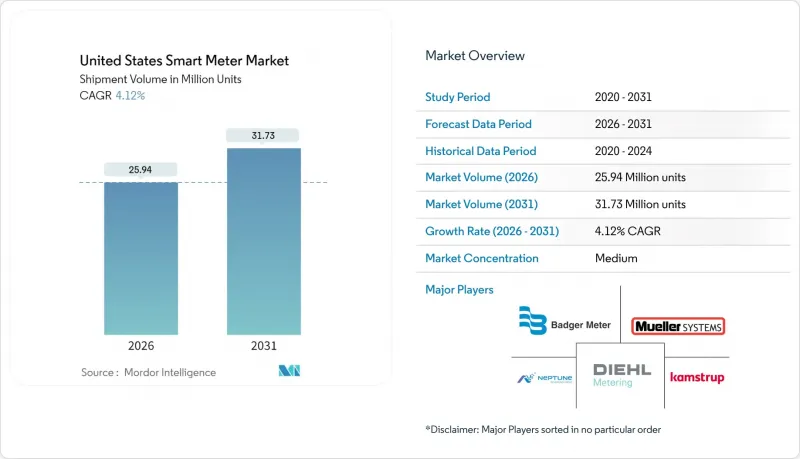
預計到 2026 年,美國智慧電錶市場規模將達到 2,594 萬台,高於 2025 年的 2,491 萬台。
預計到 2031 年,銷量將達到 3,173 萬輛,2026 年至 2031 年的複合年成長率為 4.12%。
這一快速成長得益於聯邦政府的基礎設施投資、各州的可再生能源強制性政策以及公用事業公司逐步淘汰傳統模擬設備。儘管硬體仍佔資本支出的大部分,但隨著資料管理、網路安全監控和進階分析等服務轉向訂閱模式,經常性業務收益正在不斷成長。投資者所有的公共產業佔據了新裝機量的大部分,但獲得聯邦資金直接支持的農村電力合作社正在迅速縮小差距。通訊技術日益多元化,射頻網狀網路仍是基礎技術,而蜂窩網路和窄帶物聯網(NB-IoT)連接在人口稀少的服務區域正在加速發展。總而言之,這些趨勢顯示市場正從設備採用階段過渡到數據驅動的電網調整階段,客戶參與應用預計將在此階段釋放下一波價值創造的浪潮。
美國智慧電錶市場趨勢與洞察
消費者意識的提高和聯邦法規的強制規定
聯邦基礎設施法案重新調整了公共產業的投資重點。 《基礎設施投資與就業法案》撥款650億美元用於增強電網韌性,並將智慧電錶定位為基礎資產,而非可選項。隨著極端天氣事件凸顯電網的脆弱性,消費者的態度正從懷疑轉變為需求。各州委員會擴大將高級計量基礎設施(AMI)要求納入定價方案,從而減少了阻礙實施的監管障礙。美國能源部(DOE)的電網韌性與創新夥伴關係計畫已撥款109億美元用於結合智慧電錶和柔軟性解決方案的計劃。麻薩諸塞州核准在2024年為三家公共產業投入11.7億美元用於AMI。這種合作消除了資產閒置的風險,並加快了全州的安裝進度。
擴大先進計量基礎設施資助計劃
市場正受益於聯邦撥款轉向基於公式的撥款方式,這種方式保證了多年的資本投入,從而緩解了受監管公共產業的資產負債表壓力。 GRIP津貼現在將網路安全合規性和開放標準互通性納入評估標準,促使擁有強化架構的供應商獲得津貼。農村電力合作社正在崛起成為關鍵參與者,它們透過在聯合採購小組中聚合需求,獲得電錶和蜂窩模組的批量折扣。加州自發電激勵計畫等州級撥款進一步放大了聯邦資金的影響,而國內採購規則則引導資金流向像Badger Meter這樣在美國設有工廠的製造商。可預測的資金來源促進了大規模、循序漸進的採用,加速了網路效應和資料貨幣化的潛力。
AMI網路中的網路安全與隱私問題
短期內阻礙技術普及的最大因素是對供應鏈完整性的日益重視。 NIST網路安全架構2.0將供應商管治從簡單的清單式審核提升為董事會層面的治理議題。公共產業在下訂單前會委託第三方進行滲透測試,這導致採購週期延長數月。各州委員會現在要求AMI應用必須包含正式的網路風險緩解計劃,而NARUC指南則專門針對加密、金鑰管理和事件回應程序。雖然公共產業不會完全停止採用這項技術,但新增的管制措施會減緩其普及速度,並增加非硬體成本。
細分市場分析
截至2025年,智慧電錶在美國智慧電錶市場佔據68.02%的佔有率,這得益於監管要求、成本回收保證以及停電管理和遠端連接/斷開功能帶來的顯著投資回報率(ROI)。該領域成熟的供應商生態系統使公共產業能夠協商優惠價格,從而支持農村地區的大規模競標。預計到2031年,美國智慧電錶市場規模將達到2,166萬台,並隨著電網邊緣自動化升級而持續成長。
隨著市政當局面臨日益嚴重的漏水罰款以及為應對乾旱而設定的節水目標,水錶行業的成長正在加速。雖然單位成本高於電錶,但不斷上漲的水價正在提高投資報酬率。為了避免地下井道中的訊號流失,水錶通常採用蜂巢模組,並利用雲分析來識別未貨幣化的水量。因此,預計2026年至2031年間,水務業將新增114萬個節點,部分縮小與電錶的差距。由於安全標準和複雜的安裝規章延長了計劃週期,燃氣表和熱量表在絕對數量和相對數量上都落後於電錶。然而,低功耗廣域網路(LPWAN)技術的進步以及防爆外殼的廣泛應用,可能會在2020年代後半期推動農村燃氣網路部署量的活性化。
到2025年,住宅用戶將佔智慧電錶安裝總量的71.74%,這反映了公共產業推行的綜合性項目,這些項目整合了電錶部署、客戶入口網站和需量反應註冊等功能。標準化的上門安裝流程降低了單位人事費用,鞏固了住宅用戶在美國智慧電錶市場的主導地位。即使其他終端用戶的採用速度加快,到2031年,住宅用戶在美國智慧電錶市場的佔有率也不太可能低於70%。
安裝在變壓器、電容器組和配電線路上的公共產業自有運轉電錶是成長最快的細分市場,年複合成長率達 4.78%。這些設備能夠提供負載曲線、電壓偏差和相位不平衡等資訊。公共產業正將這些設備與分散式能源 (DER) 容量研究相結合,以延緩資本設備升級。商業和工業領域的應用雖然較為活躍,但規模仍然有限,許多大型設施已經部署了建築管理系統來取代公用事業公司提供的電錶。然而,碳排放揭露標準的推動正促使企業收集公用事業層面的數據,用於審核追蹤和範圍 2 報告。
其他福利:
- Excel格式的市場預測(ME)表
- 分析師支持(3個月)
目錄
第1章 引言
- 研究假設和市場定義
- 調查範圍
第2章調查方法
第3章執行摘要
第4章 市場情勢
- 市場概覽
- 市場促進因素
- 消費者意識的提高和聯邦法規的強制規定
- 擴大高級計量基礎設施(AMI)資助計劃
- 公共產業脫碳和電氣化藍圖
- 分時電價的引入將推動對即時計量技術的需求。
- 利用 5G 和 NB-IoT 部署提升電錶連接性
- 將分散式能源資源整合到V2G生態系統中(報告不足)
- 市場限制
- AMI網路中的網路安全與隱私問題
- 半導體元件供應鏈中斷(未充分通報)
- 智慧燃氣表成本效益實現延遲
- 各公共產業數據標準化方面的差距(漏報)
- 產業生態系分析
- 監管環境
- 智慧電網概念分析
- 宏觀經濟因素的影響
- 技術展望
- 波特五力分析
- 供應商的議價能力
- 消費者議價能力
- 新進入者的威脅
- 競爭對手之間的競爭
- 替代品的威脅
第5章 市場規模及成長預測(出貨量)
- 按類型
- 智慧電錶
- 智慧燃氣表
- 智慧水錶
- 智慧熱量表
- 最終用戶
- 住宅
- 商業的
- 工業的
- 公共產業
- 透過通訊技術
- 射頻網狀網路
- 電力線路通訊(PLC)
- 蜂窩通訊(3G/4G/5G、NB-IoT)
- 其他通訊技術(Wi-SUN、ZigBee、LoRa)
- 按組件
- 硬體(儀表、通訊模組)
- 軟體(主資料管理、分析)
- 服務(實施支援、託管服務)
第6章 競爭情勢
- 市場集中度
- 策略趨勢
- 市佔率分析
- 供應商市佔率分析
- 公司簡介
- Badger Meter Inc.
- Mueller Water Products Inc.(Mueller Systems LLC)
- Diehl Metering LLC
- Kamstrup A/S
- Neptune Technology Group Inc.
- General Electric Company
- Itron Inc.
- Sensus USA Inc.(Xylem Inc.)
- Elster American Meter LLC(Honeywell International Inc.)
- Landis+Gyr AG
- Aclara Technologies LLC
- Schneider Electric SE
- Siemens AG
- Silver Spring Networks Inc.(Itron)
- Zenner USA
- EDMI Limited
- Oracle Corporation
- Trilliant Holdings Inc.
- Sense Labs Inc.
- Ossiaco Inc.
第7章 市場機會與未來展望
The United States smart meter market size in 2026 is estimated at 25.94 million units, growing from 2025 value of 24.91 million units with 2031 projections showing 31.73 million units, growing at 4.12% CAGR over 2026-2031.
The surge is being underpinned by federal infrastructure spending, state-level renewable mandates, and a utility pivot away from legacy analog equipment. Hardware still captures most capital outlay, yet recurring service revenues are rising as data management, cyber-security monitoring, and advanced analytics shift to subscription models. Investor-owned utilities account for the bulk of new installations, but rural electric cooperatives are rapidly closing the gap after gaining direct access to federal funds. Communication technologies are diversifying-RF mesh remains the anchor, although cellular and NB-IoT connections are accelerating in sparsely populated service territories. Collectively, these threads indicate a market in transition from device deployment to data-driven grid orchestration, with customer engagement applications poised to unlock the next wave of value creation.
United States Smart Meter Market Trends and Insights
Higher Consumer Awareness and Federal Mandates
Federal infrastructure legislation has re-ordered utility investment priorities. The Infrastructure Investment and Jobs Act allocates USD 65 billion for grid resilience, positioning smart meters as foundational assets rather than optional upgrades. Consumer attitudes have flipped from skepticism to demand as extreme weather events spotlight grid fragility. State commissions increasingly embed Advanced Metering Infrastructure (AMI) requirements into rate cases, cutting the red tape that previously delayed rollouts. The DOE Grid Resilience and Innovation Partnerships program reserves USD 10.9 billion for projects that pair smart meters with flexibility solutions, while Massachusetts approved USD 1.17 billion of AMI spend across three utilities in 2024. This alignment eliminates stranded-asset risk and fast-tracks statewide installation schedules.
Expansion of Advanced Metering Infrastructure Funding Programs
The market is benefiting from a shift toward formula-based federal allocations that guarantee multi-year capital availability, easing balance-sheet pressure for regulated utilities. GRIP grants now rank cyber-security compliance and open-standards interoperability as scoring criteria, tilting awards toward vendors with hardened architectures. Rural electric cooperatives are new power players, pooling demand under joint procurement groups to draw bulk discounts for meters and cellular modules. State match-funding-such as California's Self-Generation Incentive Program-further leverages federal dollars, while domestic-content rules channel spending to manufacturers like Badger Meter that operate U.S. plants. The predictable funding pipeline encourages larger, contiguous deployment blocks, accelerating network effects and data monetization potential.
Cyber-Security and Privacy Concerns in AMI Networks
The biggest near-term drag on rollouts is the heightened focus on supply-chain integrity. NIST Cyber-Security Framework 2.0 elevates vendor vetting from a checklist to a board-level governance issue. Utilities are commissioning third-party penetration tests before signing purchase orders, adding months to procurement cycles. State commissions now require formal cyber-risk mitigation plans in AMI filings; NARUC guidance specifically calls out encryption, key management, and incident-response playbooks. Utilities will not completely halt deployments, but the added controls slow volume ramps and raise non-hardware costs.
Other drivers and restraints analyzed in the detailed report include:
- Utility Decarbonization and Electrification Roadmaps
- Rise of Time-of-Use Tariffs Driving Real-Time Metering Needs
- Supply-Chain Disruptions for Semiconductor Components
For complete list of drivers and restraints, kindly check the Table Of Contents.
Segment Analysis
Smart electricity meters retained a 68.02% share of the United States smart meter market in 2025. They rode on regulatory mandates, cost-recovery guarantees, and field-proven ROI from outage management and remote connect or disconnect functions. The segment's entrenched vendor ecosystem allows utilities to negotiate favorable pricing, which, in turn, supports large-block tenders in rural territories. The United States smart meter market size for electricity deployments is expected to reach 21.66 million units by 2031, expanding in lockstep with grid-edge automation upgrades.
Growth in water metering is accelerating because municipalities face mounting leakage fines and drought-related conservation goals. Although unit prices are higher than for electric meters, rising water tariffs improve the payback calculus. Cellular modules are frequently specified to avoid RF signal loss inside subterranean vaults, and cloud analytics pinpoint non-revenue water. Consequently, the water segment is projected to add 1.14 million new nodes between 2026 and 2031, closing part of the volume gap with electricity meters. Gas and heat meters trail in both absolute and relative terms because safety codes and complex installation rules extend project timelines. Still, advances in LPWAN and explosion-proof enclosures could invigorate rural gas deployments in the latter half of the decade.
The residential segment accounted for 71.74% of installations in 2025, reflecting wrap-around utility programs that combine meter rollout, customer portals, and demand response enrollment. Because installation crews can move house-to-house with standardized processes, per-unit labor costs are low, reinforcing the segment's leadership in the United States smart meter market. The United States smart meter market share for residential users is unlikely to drop below 70% before 2031, even as other end-users accelerate deployments.
Utility-owned operational meters-installed on transformers, capacitor banks, and distribution feeders-represent the fastest-growing slice, advancing at a 4.78% CAGR. These devices deliver visibility into loading profiles, voltage deviations, and phase imbalances. Utilities deploy them in tandem with DER hosting-capacity studies to defer capital upgrades. Commercial and industrial adoption remains healthy but not spectacular; many large facilities already sport building-management systems that substitute for utility-supplied meters. Still, the push toward carbon disclosure standards is nudging corporations toward utility-grade data for audit trails and Scope 2 reporting.
The United States Smart Meter Market Report is Segmented by Type (Smart Electricity Meters, Smart Gas Meters, Smart Water Meters, and Smart Heat Meters), End-User (Residential, Commercial, Industrial, and Utilities), Communication Technology (RF Mesh, Power Line Communication [PLC}, Cellular, and More), Component (Hardware, Software, and Services), and Geography. The Market Forecasts are Provided in Terms of Volume (Units).
List of Companies Covered in this Report:
- Badger Meter Inc.
- Mueller Water Products Inc. (Mueller Systems LLC)
- Diehl Metering LLC
- Kamstrup A/S
- Neptune Technology Group Inc.
- General Electric Company
- Itron Inc.
- Sensus USA Inc. (Xylem Inc.)
- Elster American Meter LLC (Honeywell International Inc.)
- Landis+Gyr AG
- Aclara Technologies LLC
- Schneider Electric SE
- Siemens AG
- Silver Spring Networks Inc. (Itron)
- Zenner USA
- EDMI Limited
- Oracle Corporation
- Trilliant Holdings Inc.
- Sense Labs Inc.
- Ossiaco Inc.
Additional Benefits:
- The market estimate (ME) sheet in Excel format
- 3 months of analyst support
TABLE OF CONTENTS
1 INTRODUCTION
- 1.1 Study Assumptions and Market Definition
- 1.2 Scope of the Study
2 RESEARCH METHODOLOGY
3 EXECUTIVE SUMMARY
4 MARKET LANDSCAPE
- 4.1 Market Overview
- 4.2 Market Drivers
- 4.2.1 Higher consumer awareness and federal mandates
- 4.2.2 Expansion of Advanced Metering Infrastructure funding programs
- 4.2.3 Utility decarbonization and electrification roadmaps
- 4.2.4 Rise of Time-of-Use tariffs driving real-time metering needs
- 4.2.5 5G and NB-IoT rollout improving meter connectivity
- 4.2.6 Integration of distributed energy resources and V2G ecosystems (under-reported)
- 4.3 Market Restraints
- 4.3.1 Cyber-security and privacy concerns in AMI networks
- 4.3.2 Supply-chain disruptions for semiconductor components (under-reported)
- 4.3.3 Slower smart gas meter cost-benefit realization
- 4.3.4 Inter-utility data standardization gaps (under-reported)
- 4.4 Industry Ecosystem Analysis
- 4.5 Regulatory Landscape
- 4.6 Smart Grid Initiatives Analysis
- 4.7 Impact of Macroeconomic Factors
- 4.8 Technological Outlook
- 4.9 Porter's Five Forces Analysis
- 4.9.1 Bargaining Power of Suppliers
- 4.9.2 Bargaining Power of Consumers
- 4.9.3 Threat of New Entrants
- 4.9.4 Intensity of Competitive Rivalry
- 4.9.5 Threat of Substitutes
5 MARKET SIZE AND GROWTH FORECASTS (SHIPMENT VOLUME)
- 5.1 By Type
- 5.1.1 Smart Electricity Meters
- 5.1.2 Smart Gas Meters
- 5.1.3 Smart Water Meters
- 5.1.4 Smart Heat Meters
- 5.2 By End-User
- 5.2.1 Residential
- 5.2.2 Commercial
- 5.2.3 Industrial
- 5.2.4 Utilities
- 5.3 By Communication Technology
- 5.3.1 RF Mesh
- 5.3.2 Power Line Communication (PLC)
- 5.3.3 Cellular (3G/4G/5G, NB-IoT)
- 5.3.4 Other Communication Technologies (Wi-SUN, ZigBee, LoRa)
- 5.4 By Component
- 5.4.1 Hardware (Meters, Communication Modules)
- 5.4.2 Software (MDM, Analytics)
- 5.4.3 Services (Deployment, Managed Services)
6 COMPETITIVE LANDSCAPE
- 6.1 Market Concentration
- 6.2 Strategic Moves
- 6.3 Market Share Analysis
- 6.4 Vendor Market Share Analysis
- 6.5 Company Profiles (includes Global level Overview, Market level overview, Core Segments, Financials as available, Strategic Information, Market Rank/Share for key companies, Products and Services, and Recent Developments)
- 6.5.1 Badger Meter Inc.
- 6.5.2 Mueller Water Products Inc. (Mueller Systems LLC)
- 6.5.3 Diehl Metering LLC
- 6.5.4 Kamstrup A/S
- 6.5.5 Neptune Technology Group Inc.
- 6.5.6 General Electric Company
- 6.5.7 Itron Inc.
- 6.5.8 Sensus USA Inc. (Xylem Inc.)
- 6.5.9 Elster American Meter LLC (Honeywell International Inc.)
- 6.5.10 Landis+Gyr AG
- 6.5.11 Aclara Technologies LLC
- 6.5.12 Schneider Electric SE
- 6.5.13 Siemens AG
- 6.5.14 Silver Spring Networks Inc. (Itron)
- 6.5.15 Zenner USA
- 6.5.16 EDMI Limited
- 6.5.17 Oracle Corporation
- 6.5.18 Trilliant Holdings Inc.
- 6.5.19 Sense Labs Inc.
- 6.5.20 Ossiaco Inc.
7 MARKET OPPORTUNITIES AND FUTURE OUTLOOK
- 7.1 White-space and Unmet-Need Assessment
 智慧電錶:市場佔有率分析、產業趨勢與統計、成長預測(2026-2031)
 智慧電錶市場規模、佔有率和趨勢分析報告:按組件、類型、技術、最終用途、地區和細分市場分類(2026-2033 年)
 智慧電錶市場預測——全球產品、組件、通訊技術、技術、應用、最終用戶和地區分析——2034年
 智慧電錶市場:按類型、通訊技術、技術、組件、階段、應用、最終用途、部署模式和客戶類型分類-2026-2032年全球市場預測
 物聯網市場追蹤調查:計量北美智慧電錶:市場佔有率分析、產業趨勢與統計及成長預測(2026-2031 年)
 2026年全球智慧電錶市場報告多功能智慧電錶市場(按最終用戶、應用、通訊技術、相型、部署模式和安裝類型分類),全球預測,2026-2032年歐洲智慧電錶:市場佔有率分析、產業趨勢與統計、成長預測(2026-2031 年)全球電網現代化投資市場:預測(至2034年)-按輸電基礎設施、組件、資金來源、電網類型、技術、應用、最終用戶和地區進行分析