


 |
市場調查報告書
商品編碼
1940783
美國光電:市場佔有率分析、行業趨勢和統計數據、成長預測(2026-2031)United States Photonics - Market Share Analysis, Industry Trends & Statistics, Growth Forecasts (2026 - 2031) |
||||||
※ 本網頁內容可能與最新版本有所差異。詳細情況請與我們聯繫。
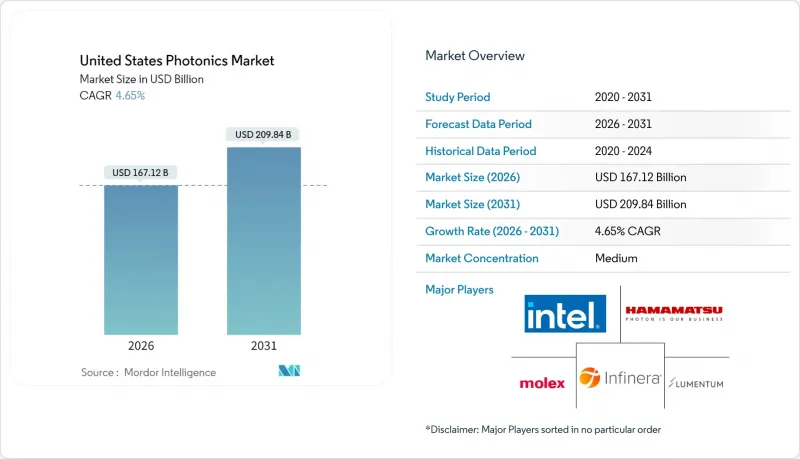
美國光電市場預計將從 2025 年的 1,596.9 億美元成長到 2026 年的 1,671.2 億美元,預計到 2031 年將達到 2098.4 億美元,2026 年至 2031 年的複合年成長率為 4.65%。
超大規模設施中人工智慧工作負載的激增、聯邦政府對國內製造業的重新推動以及定向能源計劃的實施,共同構建了一個比傳統電信中心模式更為廣泛的需求結構。矽光電平台正蓬勃發展,因為它們可以在現有的CMOS生產線上製造;而化合物半導體晶圓廠則受益於《晶片工業與資訊技術法案》(CHIPS Act)的津貼,從而抵消了高昂的資本成本。同時,微創成像和光生物調節療法在醫療領域的應用,確保了持續的第二大成長引擎。稀土元素和III-V族材料的供應安全仍然存在不確定性,因為鍺和鎵的出口限制推高了原料成本,並引發了國內的替代需求。
美國光電市場趨勢與洞察
人工智慧主導的資料中心光I/O激增
2024年光收發器出貨量成長創紀錄的60%,反映出超大規模業者正從400G連結向800G連結過渡。 1.6T模組的試驗也在進行中。矽光電佔出貨量的35%,因為整合電光晶粒降低了每位元功耗並簡化了共封裝光學元件。英特爾和Ayar Labs展示了到2026年實現單封裝3.2T的藍圖,這證實了市場對積體光子電路的多年需求。美國能源部的百億億百萬兆級計畫進一步強化了這一趨勢,因為超級電腦正在向光連接模組過渡,以實現節能擴展。
《CHIPS法案》國內製造業獎勵措施
《晶片/科學法案》確保了2024年2.8億美元的資金用於光電計劃。連貫)獲得了1.12億美元用於擴大其磷化銦/碳化矽產能,而格羅方德公司(GlobalFoundries)獲得了7500萬美元用於矽光電開發。 AIM 光電的多計劃晶圓服務透過共用掩模組和晶圓製造時間降低了Start-Ups的准入門檻,並促進了強大的國內供應商基礎的形成。這些獎勵有助於縮短前置作業時間,確保可靠的供應商,並降低海外供應鏈中斷的風險。
資本密集型光電製造基礎設施
被動元件需要10級潔淨室,主動元件需要1級潔淨室,這意味著其建造成本遠高於傳統半導體生產線。 AIM Photonics估計,一座滿載運轉的光電工廠造價在1億至5億美元之間,其中計量設備的成本是電子工具的兩到三倍。國內晶圓廠數量有限,而此時市場對磷化銦和氮化矽平台的需求卻激增,造成了產能瓶頸。
細分市場分析
醫療科技產業預計將以5.83%的複合年成長率成長,這反映出監管核准後,一旦臨床療效得到證實,採購預算就會隨之穩定下來。資料通訊通訊仍是最大的細分市場,占美國光電市場佔有率的28.35%,這主要得益於超大規模流量向800G光纖通訊的遷移。雷射雷達在自動駕駛汽車和智慧基礎設施監控領域的應用,正使測繪和感測技術獲得日益成長的關注。同時,生產技術領域正利用高功率雷射開發積層製造生產線。
影像導引手術和動態療法的強勁發展勢頭維持了其對宏觀經濟波動較為穩健的需求結構。照明和顯示器產業趨於成熟,但園藝照明和紫外線消毒等細分市場仍蘊藏成長機會。量子運算、環境感測和空間平台等新興領域為能夠將成熟技術應用於新領域的供應商創造了價值選擇。
整合光子電路預計將以6.05%的複合年成長率成長,這主要得益於市場對整合光源、調製器和檢測器於單晶粒上的晶片級模組的需求不斷成長。雷射和光源目前佔據24.05%的市場佔有率,但其產品正逐漸趨於同質化,供應商需要將其與控制電子設備和軟體捆綁銷售。檢測器和感測器則受益於汽車ADAS(進階駕駛輔助系統)和照護現場診斷需求的成長,而崩光二極體和單光子計數器靈敏度的不斷提高正是推動這一成長的主要因素。
光纖和波導等基礎設施的需求持續成長,主要得益於遍遠地區寬頻部署的推動;而調變器的需求則因雲骨幹網中動態波長切換需求的不斷成長而增加。無源光元件供應商正將業務重心轉向嚴苛環境的太空船和海底系統,因為這些領域擁有更強的定價權。隨著客戶越來越傾向於選擇提供完整子系統而非單一組件的供應商,供應商名單也不斷精簡。
其他福利:
- Excel格式的市場預測(ME)表
- 分析師支持(3個月)
目錄
第1章 引言
- 研究假設和市場定義
- 調查範圍
第2章調查方法
第3章執行摘要
第4章 市場情勢
- 市場概覽
- 市場促進因素
- 人工智慧驅動型資料中心的光I/O快速成長
- 《晶片製造和生產法案》(CHIPS Act)鼓勵國內製造業
- 國防雷射和定向能技術的資金投入正在增加
- 微創生物醫學影像診斷技術的推廣
- 自動駕駛汽車LiDAR整合競賽
- 量子光電研發投資
- 市場限制
- 資本密集型光子製造基礎設施
- 熟練光電人員短缺
- 稀土元素/III-V族半導體供應鏈風險
- 標準與生態系互通性差距
- 產業供應鏈分析
- 宏觀經濟因素的影響
- 監管環境
- 技術展望
- 波特五力分析
- 供應商的議價能力
- 買方和消費者的議價能力
- 新進入者的威脅
- 替代品的威脅
- 競爭對手之間的競爭
第5章 市場規模與成長預測
- 透過使用
- 勘測與探測
- 生產技術
- 資料通訊
- 影像擷取與顯示
- 醫療技術
- 照明
- 其他用途
- 依組件類型
- 雷射和光源
- 檢測器和感測器
- 光纖和波導管
- 調製器和開關元件
- 積體光子電路
- 被動式光學元件(透鏡、濾光片等)
- 按最終用戶行業分類
- 電信和資料中心
- 工業製造
- 醫學與生命科學
- 國防/航太
- 家用電子電器
- 能源與環境
- 透過技術
- 矽光電
- 光纖光子光電
- 自由空間與衍射光學
- 量子與非線性光電
第6章 競爭情勢
- 市場集中度
- 策略趨勢
- 市佔率分析
- 公司簡介
- Intel Corporation
- Lumentum Holdings Inc.
- Infinera Corporation
- Molex LLC(Koch Industries)
- Hamamatsu Photonics KK
- IPG Photonics Corporation
- Coherent Corp.
- Vescent Photonics Inc.
- Photonic Systems Inc.
- Thorlabs Inc.
- NEC Corporation
- ams OSRAM AG
- TRUMPF SE+Co. KG
- Polatis Ltd.(Huber+Suhner AG)
- Nokia Corporation
- Rockley Photonics Holdings Ltd.
- Lumibird SA
- Acacia Communications Inc.(Cisco)
- GlobalFoundries Inc.
- Analog Photonics LLC
第7章 市場機會與未來展望
The United States photonics market is expected to grow from USD 159.69 billion in 2025 to USD 167.12 billion in 2026 and is forecast to reach USD 209.84 billion by 2031 at 4.65% CAGR over 2026-2031.
Surging artificial-intelligence workloads inside hyperscale facilities, a renewed federal push for on-shore manufacturing, and directed-energy programs together shape a demand profile that is broader than prior telecom-centric cycles. Silicon photonics platforms gain momentum because they can be produced on existing CMOS lines, while compound-semiconductor plants benefit from CHIPS Act grants that offset high capital costs. At the same time, healthcare adoption of minimally invasive imaging and photobiomodulation therapies secures a durable second growth engine. Supply security for rare-earths and III-V materials remains a swing factor as germanium and gallium export curbs inflate input costs and trigger domestic substitution efforts.
United States Photonics Market Trends and Insights
AI-driven datacenter optical-I/O boom
A record 60% jump in optical-transceiver shipments in 2024 reflected hyperscale operators' shift from 400 G to 800 G links, and trials for 1.6 T modules are underway. Silicon photonics captured 35% of those volumes because integrated electro-optical dies reduce power per bit and simplify co-packaged optics. Intel and Ayar Labs demonstrated roadmaps toward 3.2 T per package by 2026, ensuring a multi-year pull for integrated photonic circuits. Department of Energy exascale programs reinforce the trend as supercomputers pivot to optical interconnects for energy-efficient scaling.
CHIPS Act domestic manufacturing incentives
The CHIPS and Science Act reserved USD 280 million for photonics projects in 2024, with Coherent receiving USD 112 million to expand indium-phosphide and silicon-carbide capacity and GlobalFoundries gaining USD 75 million for silicon photonics. AIM Photonics' multi-project wafer service lowers entry costs for start-ups by sharing mask sets and fab time, catalyzing a richer domestic supplier base. These incentives shorten lead times, support trusted-supplier mandates, and mitigate exposure to overseas supply disruptions.
Cap-intensive photonic-fab infrastructure
Clean-room requirements of Class 10 for passive and Class 1 for active devices elevate construction outlays well above traditional semiconductor lines. AIM Photonics estimates USD 100-500 million for a full-capacity photonic fab, while metrology tools can cost 2-3X electronic counterparts. Limited domestic fab count forms a capacity bottleneck when demand surges for indium-phosphide or silicon-nitride platforms.
Other drivers and restraints analyzed in the detailed report include:
- Defense laser and directed-energy funding upswing
- Minimally invasive biomedical imaging adoption
- Rare-earth and III-V supply-chain risks
For complete list of drivers and restraints, kindly check the Table Of Contents.
Segment Analysis
Medical Technology captured a 5.83% CAGR outlook, reflecting regulatory approvals that anchor procurement budgets once clinical efficacy is proven. Data Communication still represents the largest slice at 28.35% of the United States photonics market share, propelled by hyperscale traffic migration to 800 G optics. Surveying and Detection gains incremental traction from autonomous-vehicle LiDAR and smart-infrastructure monitoring, while Production Technology leverages high-power lasers for additive manufacturing lines.
Momentum in image-guided surgery and photodynamic therapy sustains a demand profile resilient to macro-economic swings. Lighting and display sub-segments mature, yet horticultural and UV-sterilization niches provide targeted growth. Emerging areas, quantum computing, environmental sensing, and space platforms, create option value for suppliers positioned to spin off proven technologies into new verticals.
Integrated Photonic Circuits are slated for a 6.05% CAGR as customers gravitate toward chip-scale modules that embed sources, modulators, and detectors on a single die. Lasers and Sources hold a 24.05% share, but steady commoditization presses suppliers to bundle control electronics and software. Detectors and Sensors benefit from rising automotive ADAS and point-of-care diagnostics, underscoring sensitivity advances in avalanche photodiodes and single-photon counters.
Optical Fibers and Waveguides maintain baseline demand from rural broadband rollouts, whereas modulators experience a lift from dynamic wavelength switching in cloud backbones. Passive optics suppliers reposition toward harsh-environment spacecraft and subsea systems where pricing power is stronger. Customers increasingly favor vendors offering full subsystems over discrete parts, consolidating the vendor list.
The United States Photonics Market Report is Segmented by Application (Surveying and Detection, Production Technology, and More), Component Type (Lasers and Sources, Detectors and Sensors, and More), End-User Industry (Telecom and Datacenters, Industrial Manufacturing, and More), and Technology (Silicon Photonics, Optical Fiber Photonics, and More). The Market Forecasts are Provided in Terms of Value (USD).
List of Companies Covered in this Report:
- Intel Corporation
- Lumentum Holdings Inc.
- Infinera Corporation
- Molex LLC (Koch Industries)
- Hamamatsu Photonics K.K.
- IPG Photonics Corporation
- Coherent Corp.
- Vescent Photonics Inc.
- Photonic Systems Inc.
- Thorlabs Inc.
- NEC Corporation
- ams OSRAM AG
- TRUMPF SE + Co. KG
- Polatis Ltd. (Huber+Suhner AG)
- Nokia Corporation
- Rockley Photonics Holdings Ltd.
- Lumibird SA
- Acacia Communications Inc. (Cisco)
- GlobalFoundries Inc.
- Analog Photonics LLC
Additional Benefits:
- The market estimate (ME) sheet in Excel format
- 3 months of analyst support
TABLE OF CONTENTS
1 INTRODUCTION
- 1.1 Study Assumptions and Market Definition
- 1.2 Scope of the Study
2 RESEARCH METHODOLOGY
3 EXECUTIVE SUMMARY
4 MARKET LANDSCAPE
- 4.1 Market Overview
- 4.2 Market Drivers
- 4.2.1 AI-driven datacenter optical-I/O boom
- 4.2.2 CHIPS Act domestic manufacturing incentives
- 4.2.3 Defense laser and directed-energy funding upswing
- 4.2.4 Minimally-invasive biomedical imaging adoption
- 4.2.5 Autonomous-vehicle LiDAR integration race
- 4.2.6 Quantum-photonics R&D investments
- 4.3 Market Restraints
- 4.3.1 Cap-intensive photonic-fab infrastructure
- 4.3.2 Photonics-skilled talent shortage
- 4.3.3 Rare-earth / III-V supply-chain risks
- 4.3.4 Standards and ecosystem interoperability gaps
- 4.4 Industry Supply-Chain Analysis
- 4.5 Impact of Macroeconomic Factors
- 4.6 Regulatory Landscape
- 4.7 Technological Outlook
- 4.8 Porter's Five Forces Analysis
- 4.8.1 Bargaining Power of Suppliers
- 4.8.2 Bargaining Power of Buyers/Consumers
- 4.8.3 Threat of New Entrants
- 4.8.4 Threat of Substitutes
- 4.8.5 Intensity of Competitive Rivalry
5 MARKET SIZE AND GROWTH FORECASTS (VALUE)
- 5.1 By Application
- 5.1.1 Surveying and Detection
- 5.1.2 Production Technology
- 5.1.3 Data Communication
- 5.1.4 Image Capture and Display
- 5.1.5 Medical Technology
- 5.1.6 Lighting
- 5.1.7 Other Applications
- 5.2 By Component Type
- 5.2.1 Lasers and Sources
- 5.2.2 Detectors and Sensors
- 5.2.3 Optical Fibers and Waveguides
- 5.2.4 Modulators and Switched Devices
- 5.2.5 Integrated Photonic Circuits
- 5.2.6 Passive Optics (Lenses, Filters, etc.)
- 5.3 By End-User Industry
- 5.3.1 Telecom and Datacenters
- 5.3.2 Industrial Manufacturing
- 5.3.3 Healthcare and Life Sciences
- 5.3.4 Defense and Aerospace
- 5.3.5 Consumer Electronics
- 5.3.6 Energy and Environment
- 5.4 By Technology
- 5.4.1 Silicon Photonics
- 5.4.2 Optical Fiber Photonics
- 5.4.3 Free-space and Diffractive Optics
- 5.4.4 Quantum and Non-linear Photonics
6 COMPETITIVE LANDSCAPE
- 6.1 Market Concentration
- 6.2 Strategic Moves
- 6.3 Market Share Analysis
- 6.4 Company Profiles (includes Global level Overview, Market level overview, Core Segments, Financials as available, Strategic Information, Market Rank/Share for key companies, Products and Services, and Recent Developments)
- 6.4.1 Intel Corporation
- 6.4.2 Lumentum Holdings Inc.
- 6.4.3 Infinera Corporation
- 6.4.4 Molex LLC (Koch Industries)
- 6.4.5 Hamamatsu Photonics K.K.
- 6.4.6 IPG Photonics Corporation
- 6.4.7 Coherent Corp.
- 6.4.8 Vescent Photonics Inc.
- 6.4.9 Photonic Systems Inc.
- 6.4.10 Thorlabs Inc.
- 6.4.11 NEC Corporation
- 6.4.12 ams OSRAM AG
- 6.4.13 TRUMPF SE + Co. KG
- 6.4.14 Polatis Ltd. (Huber+Suhner AG)
- 6.4.15 Nokia Corporation
- 6.4.16 Rockley Photonics Holdings Ltd.
- 6.4.17 Lumibird SA
- 6.4.18 Acacia Communications Inc. (Cisco)
- 6.4.19 GlobalFoundries Inc.
- 6.4.20 Analog Photonics LLC
7 MARKET OPPORTUNITIES AND FUTURE OUTLOOK
- 7.1 White-space and Unmet-Need Assessment
 光電晶片市場分析及預測(至2035年):類型、產品類型、技術、組件、應用、材料類型、裝置、最終用戶、功能
 光子學市場:依產品類型、應用和終端用戶產業劃分 - 至2036年的全球預測光電市場分析及預測(至2035年):依類型、產品類型、服務、技術、組件、應用、材料類型、裝置、最終用戶、功能分類
 光電市場-全球產業規模、佔有率、趨勢、機會及預測(依產品類型、應用、最終用戶、地區及競爭格局分類,2021-2031年)光電裝置市場-全球產業規模、佔有率、趨勢、預測及機會(按產品、應用、產業、地區及競爭格局分類),2021-2031年
 2026-2030年全球光電市場
 日本光子學市場報告(按類型、應用、最終用戶和地區分類,2026-2034年)
 光電市場規模、佔有率和成長分析(按類型、應用、最終用途產業和地區分類)-產業預測,2026-2033年
 全球光電市場按產品類型、波長、應用、材料、最終用途產業和地區分類-預測至 2030 年
 全球光電市場:2025-2030 年預測