


 |
市場調查報告書
商品編碼
1940712
歐洲共享辦公空間:市場佔有率分析、產業趨勢與統計、成長預測(2026-2031)Europe Coworking Spaces - Market Share Analysis, Industry Trends & Statistics, Growth Forecasts (2026 - 2031) |
||||||
※ 本網頁內容可能與最新版本有所差異。詳細情況請與我們聯繫。
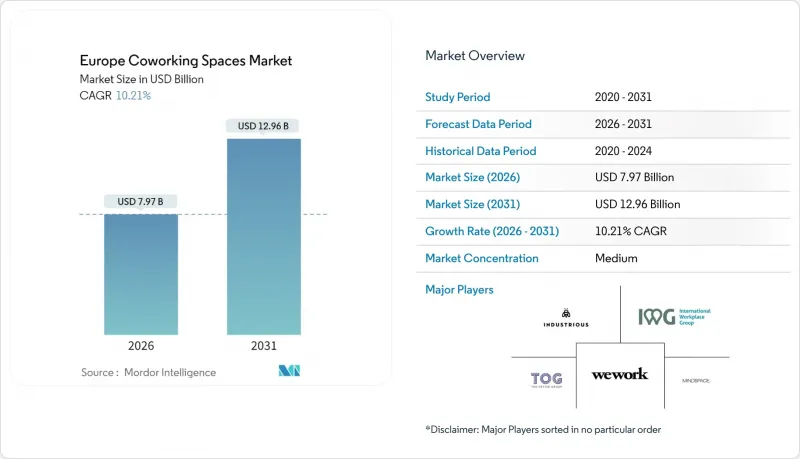
2025年歐洲共享辦公空間市場價值為72.3億美元,預計將從2026年的79.7億美元成長到2031年的129.6億美元。
預計在預測期(2026-2031 年)內,複合年成長率將達到 10.21%。
混合辦公模式的興起、企業最佳化房地產投資組合的壓力日益增大,以及政府降低前期成本的激勵措施,共同推動了對彈性辦公空間解決方案的持續需求。企業正採用輕資產管理協議以節省資金,而中型辦公空間則能滿足營運商平衡使用率和服務品質所需的密度。大型辦公空間的擴張速度最快,因為大型企業客戶需要配備專用協作區域的整層辦公空間。人工智慧驅動的運轉率平台也透過提供支援動態定價的即時入住率數據,幫助營運商提高利潤率。同時,主要城市過剩的閒置租賃物業以及老舊辦公大樓ESG維修成本的不斷上漲,限制了營運商近期的定價能力。將技術差異化與混合用途位置策略結合的營運商,將更有利於掌握歐洲共同工作空間市場下一階段的成長機會。
歐洲共享辦公空間市場趨勢與洞察
利用靈活空間最佳化企業房地產投資組合
隨著商業債務市場再融資風險的再次浮現,企業加速向彈性辦公空間轉型。輕資產交易如今佔主導地位:IWG 2024 年的 624 個辦公地點中,95% 都採用管理夥伴關係模式,為企業租戶提供承包辦公環境,同時將資本支出轉移給業主。跨國公司正將彈性辦公中心作為網路房地產策略的一部分,以減少固定租賃數量並重新部署員工。這使得房地產管理人員能夠在符合法定人均面積要求的前提下,將座位密度降低 20%。空間預訂 API 與企業人力資源系統整合,允許員工在辦公日預訂靠近企劃團隊的辦公桌,使企業能夠將人均占地面積比 2019 年的基準值降低 35%。這一趨勢在倫敦和慕尼黑最為明顯,金融機構估計,2025 年至 2027 年間,辦公室相關資產將佔 929 億美元債務資金籌措的 44%。彈性辦公空間在嚴峻的勞動市場中,既能減少租賃義務,又能維持關鍵的人才吸引指標。
加速歐盟勞動法中混合工作政策的實施
歐盟層級關於在家工作權利的指南在2024年至2025年間被納入各國法律,明確規定了遠距辦公安排和使用符合人體工學的衛星辦公室的權利。雇主現在必須在通勤範圍內提供“合適的設施”,或提供補貼以支付使用共享辦公空間的費用。這項義務將合規成本轉移到了缺乏必要建築認證追蹤系統的公司身上,促使採購部門將整個職場外包給專業供應商。因此,到2025年,允許員工每天選擇工作地點的多站點通行證(訂閱模式)的企業合約數量比去年同期增加了32%。為了因應這項變化,營運商正在維修現有設施,使其符合ISO 45001健康與安全標準,並加裝隔音裝置和空氣品質感測器以支援勞動審核。混合辦公政策也推動了設計變革,例如團隊辦公區和以會議為導向的樓層佈局,使公司能夠在遵守密度限制的同時,調整「重點協作日」。
老舊辦公大樓ESG維修成本不斷上漲
歐洲2030年能源績效法規要求商業占地面積達到EPC B級或同等標準,這導致老舊資產的資本支出激增。一棟建於1970年代的建築,平均維修成本超過每平方英尺190美元,其中包括電機空調、LED照明和外牆隔熱材料。簽訂管理協議而非租賃協議的共享辦公空間業者可以避免直接資本支出,但仍需承擔房東轉嫁的更高服務費。受監管行業的租戶在簽署多年合約之前,越來越要求獲得BREEAM「優秀」或LEED「金級」認證,這使得不符合標準的辦公空間實際上無法出租。在次市場,依賴基於浮動利率基準的銀行貸款的資本結構增加了資金籌措的難度。提前預測維修計劃並協商綠色認證資本支出分攤條款的運營商可以獲得成本優勢,而那些拖延翻新的運營商則面臨資產過時的風險,這可能會減緩歐洲聯合辦公空間市場的網路擴張。
細分市場分析
截至2025年,中型辦公空間(20,000-40,000平方英尺)佔據了歐洲共享辦公空間市場52.80%的佔有率,這反映出它們能夠在不影響社群互動的情況下,維持300-500個工位的網路。營運商正利用模組化隔間,在48小時內調整佈局,以適應不斷變化的企業需求。預計到2031年,大型辦公空間將以11.74%的複合年成長率成長,這主要得益於企業傾向於租用整層樓,並對廣播工作室和5G身臨其境型室等高階設施的需求。營運商正透過採用人工智慧驅動的空間利用工具來抵消大型辦公空間較高的固定成本,並緩解季節性收入波動,這些工具在活動日可將座位密度提高18%。小規模辦公空間在通勤區域蓬勃發展,作為中心輻射式模式中的樞紐,確保會員可以在距離家20分鐘車程內找到工位。
管理合約的顯著成長(2024年IWG所有新分店的95%)表明,業主更傾向於夥伴關係模式,這種模式既能穩定現金流,又能滿足租賃協議中的運轉率要求。在規模較大的辦公空間中,企業套房佔總可出租面積的42%(兩年前為26%),這印證了辦公空間佈局正從以自由工作者為中心轉向以企業為中心。合約期限指標也反映了這項變化,2023年至2025年間,企業合約的平均期限從9個月增加到14個月。這些趨勢證實了中大型辦公空間在加速歐洲共享辦公空間市場成長方面發揮核心作用。
其他福利:
- Excel格式的市場預測(ME)表
- 3個月的分析師支持
目錄
第1章 引言
- 研究假設和市場定義
- 調查範圍
第2章調查方法
第3章執行摘要
第4章 市場情勢
- 市場概覽
- 市場促進因素
- 一個蓬勃發展的Start-Ups生態系統正在尋求經濟高效且靈活的租賃方案
- 利用彈性空間最佳化企業房地產 (CRE) 投資組合
- 疫情後振興中央商務區的國家與地方獎勵
- 加速歐盟勞動法中混合工作政策的實施(2025年及以後)
- 為「居家辦公」提供郊區創業投資創投
- 人工智慧驅動的空間利用平台提升營運商利潤率
- 市場限制
- 過剩的閒置辦公空間正在拉低主要城市的辦公桌租金。
- 老舊辦公大樓進行ESG維修的成本不斷上升
- 利率波動限制了房地產投資信託基金的資金籌措機會
- 市政當局對歷史街區分區變更的抵制
- 產業內的政府法規和政策
- 共享辦公空間房地產市場的技術創新
- 對辦公室房地產行業關鍵指標(供應量、租金、價格、運轉率/空置率(%))的深入分析
- 遠距辦公如何影響空間需求
- 產業吸引力-波特五力分析
- 新進入者的威脅
- 買方和消費者的議價能力
- 供應商的議價能力
- 替代品的威脅
- 競爭對手之間的競爭
第5章 市場規模及成長預測(價值,單位:十億美元)
- 按設施規模和量
- 小規模
- 中號
- 大規模
- 按行業
- 資訊科技(IT 和 ITES)
- 銀行、金融服務和保險業 (BFSI)
- 商業諮詢和專業服務
- 其他服務(零售、生命科學、能源、法律服務)
- 最終用戶
- 自由工作者
- 公司
- Start-Ups及其他
- 按地區
- 德國
- 英國
- 法國
- 義大利
- 西班牙
- 其他歐洲地區
第6章 競爭情勢
- 市場集中度
- 策略趨勢
- 市佔率分析
- 公司簡介
- IWG(Regus & Spaces)
- WeWork
- The Office Group(TOG)
- Mindspace
- Industrious
- Second Home
- Tribes
- Impact Hub
- Fora Space
- Talent Garden
- Huckletree
- Betahaus
- Knotel Europe
- KAPTUR
- BounceSpace
- Mokrin House
- Paper Hub
- Mortimer House
- Sirius Facilities
第7章 市場機會與未來展望
The Europe Co-Working Spaces Market was valued at USD 7.23 billion in 2025 and estimated to grow from USD 7.97 billion in 2026 to reach USD 12.96 billion by 2031, at a CAGR of 10.21% during the forecast period (2026-2031).
Structural shifts toward hybrid work, mounting pressure to optimize corporate real-estate portfolios, and municipal incentives that lower set-up costs are driving sustained demand for flexible workspace solutions. Corporations are embracing asset-light managed agreements to conserve capital, while medium facilities provide the density operators need to balance utilization and service quality. Large sites are scaling fastest as enterprise clients ask for entire floors equipped with private collaboration zones, and AI-enabled utilization platforms are boosting operator margins by providing real-time occupancy data that supports dynamic pricing. At the same time, surplus grey-lease inventory in Tier-1 cities and rising ESG retrofitting costs on aging office stock temper near-term pricing power. Operators that combine technology differentiation with mixed-use location strategies are positioned to capitalize on the next growth phase of the Europe co-working spaces market.
Europe Coworking Spaces Market Trends and Insights
Corporate Real-Estate Portfolio Optimization via Flex Space
Enterprises accelerated their migration to flexible space once refinancing risk resurfaced in the commercial debt market. Asset-light deals now dominate: 95% of IWG's 624 openings in 2024 were structured as managed partnerships that shift cap-ex to landlords while delivering turnkey office ecosystems to corporate tenants. Multinationals treat flexible hubs as part of a networked real-estate stack that reallocates headcount across fewer fixed leases, helping real-estate directors hit 20% seat-density targets without breaching labor-code mandates on square footage per employee. Space-booking APIs integrate with company HR systems so staff reserve desks near project teams on in-office days, enabling firms to reduce square footage per employee by 35% relative to 2019 benchmarks. The most pronounced uptake is in London and Munich, where lenders estimate offices make up 44% of the USD 92.9 billion debt-funding gap due 2025-2027. Flexible space mitigates lease liabilities while sustaining talent-attraction metrics that matter in tight labor markets.
Acceleration of Hybrid Work Policies in EU Labor Codes
EU-level guidance on home-office rights filtered into national statutes during 2024-2025, codifying employee entitlements to remote scheduling and ergonomically safe satellite offices. Employers must now provide "suitable facilities" within commuting distance or grant allowances that cover co-working subscriptions. The mandate shifts compliance costs to companies ill-equipped to track building certifications, prompting procurement teams to outsource the entire workplace bundle to specialized operators. As a result, subscription models, multi-site passes that let staff choose locations daily, gained 32% more corporate seats during 2025 than the prior year. Operators respond by rehabbing legacy inventory to meet ISO 45001 health-and-safety standards, embedding acoustic dampening and air-quality sensors that satisfy labor-inspection audits. Hybrid policies also drive design changes such as team-based neighborhoods and meeting-heavy floorplates so firms can orchestrate anchor days that concentrate collaboration while respecting density caps.
Rising ESG Retrofitting Costs for Aging Office Stock
Europe's 2030 energy-performance mandate requires commercial floor space to achieve EPC B or equivalent, pushing capital expenditure on dated assets skyward. Average retrofit costs for 1970s-era buildings exceed USD 190 per square foot when factoring in electrified HVAC, LED lighting, and facade insulation. Co-working operators that hold management contracts rather than leases avoid direct cap-ex yet still confront service-charge increases passed through by landlords. Tenants from regulated industries now demand BREEAM Very Good or LEED Gold ratings before signing multi-year agreements, effectively rendering non-compliant space unlettable. Financing hurdles intensify in secondary markets where capital-stack structures rely on bank debt priced off floating-rate benchmarks. Operators that anticipate retrofit schedules and negotiate green-certification cap-ex sharing clauses secure a cost advantage, while laggards face stranded-asset risk that can stall network expansion within the Europe co-working spaces market.
Other drivers and restraints analyzed in the detailed report include:
- Booming Startup Ecosystem Seeking Cost-Efficient, Flexible Leases
- National & Municipal Incentives for Revitalizing Post-Pandemic CBDs
- Surplus Grey-Lease Inventory Depressing Desk Rates in Tier-1 Cities
For complete list of drivers and restraints, kindly check the Table Of Contents.
Segment Analysis
Medium facilities, 20,000 to 40,000 square feet, held 52.80% of Europe's co-working spaces market share in 2025, reflecting their ability to support 300-to-500 desk networks without diluting community engagement. Operators use modular partitions to pivot layouts within 48 hours, meeting fluctuating corporate requirements. Large facilities are projected to grow at an 11.74% CAGR through 2031 as enterprises commit to entire floors and demand premium amenities such as broadcast studios and 5G-enabled immersive rooms. Operators balance the higher fixed costs of large footprints by integrating AI-driven space-utilization tools that lift seat density by 18% on event days, smoothing revenue seasonality. Small facilities thrive in commuter belts, acting as spokes in hub-and-spoke models that guarantee members a seat within 20 minutes of home.
A surge in managed agreements, 95% of IWG openings in 2024, signals that landlords prefer partnership models that stabilize cash flows while enabling them to satisfy lender covenants on occupancy. In large facilities, corporate suites account for 42% of gross leased area versus 26% two years earlier, underscoring the shift from freelancer-centric to enterprise-oriented layouts. Duration metrics mirror this shift: the average enterprise contract length rose from nine to 14 months between 2023 and 2025. These dynamics solidify the central role of medium and large sites in accelerating the Europe co-working spaces market.
The Europe Co-Working Spaces Market Report is Segmented by Size & Scale of Facility (Small, Medium, Large), by Sector (Information Technology, BFSI, Business Consulting & Professional Service, Other Services), by End Use (Freelancers, Enterprises, Start Ups and Others), and by Geography (Germany, United Kingdom, France, Italy, Spain, Rest of Europe). The Market Forecasts are Provided in Terms of Value (USD).
List of Companies Covered in this Report:
- IWG (Regus & Spaces)
- WeWork
- The Office Group (TOG)
- Mindspace
- Industrious
- Second Home
- Tribes
- Impact Hub
- Fora Space
- Talent Garden
- Huckletree
- Betahaus
- Knotel Europe
- KAPTUR
- BounceSpace
- Mokrin House
- Paper Hub
- Mortimer House
- Sirius Facilities
Additional Benefits:
- The market estimate (ME) sheet in Excel format
- 3 months of analyst support
TABLE OF CONTENTS
1 Introduction
- 1.1 Study Assumptions & Market Definition
- 1.2 Scope of the Study
2 Research Methodology
3 Executive Summary
4 Market Landscape
- 4.1 Market Overview
- 4.2 Market Drivers
- 4.2.1 Booming startup ecosystem seeking cost-efficient, flexible leases
- 4.2.2 Corporate real-estate (CRE) portfolio optimisation via flex space
- 4.2.3 National & municipal incentives for revitalising post-pandemic CBDs
- 4.2.4 Acceleration of hybrid work policies in EU labour codes (2025+)
- 4.2.5 Venture-capital funding earmarked for "work-near-home" sub-urb hubs
- 4.2.6 AI-enabled space-utilisation platforms boosting operator margins
- 4.3 Market Restraints
- 4.3.1 Surplus grey-lease inventory depressing desk-rates in Tier-1 cities
- 4.3.2 Rising ESG retrofitting costs for ageing office stock
- 4.3.3 Interest-rate volatility constraining REIT financing windows
- 4.3.4 Municipal resistance to zoning conversion in heritage districts
- 4.4 Government Regulations and Initiatives in the Industry
- 4.5 Technological Innovations in the Co-Working Office Space Real Estate Market
- 4.6 Insights into the Key Office Real Estate Industry Metrics (Supply, Rentals, Prices, Occupancy/Vacancy (%))
- 4.7 Impact of Remote Working on Space Demand
- 4.8 Industry Attractiveness - Porter's Five Forces Analysis
- 4.8.1 Threat of New Entrants
- 4.8.2 Bargaining Power of Buyers/Consumers
- 4.8.3 Bargaining Power of Suppliers
- 4.8.4 Threat of Substitute Products
- 4.8.5 Intensity of Competitive Rivalry
5 Market Size & Growth Forecasts (Value, In USD Billion)
- 5.1 By Size & Scale of Facility
- 5.1.1 Small
- 5.1.2 Medium
- 5.1.3 Large
- 5.2 By Sector
- 5.2.1 Information Technology (IT and ITES)
- 5.2.2 BFSI (Banking, Financial Services and Insurance)
- 5.2.3 Business Consulting & Professional Service
- 5.2.4 Other Services (Retail, Lifesciences, Energy, Legal Services)
- 5.3 By End User
- 5.3.1 Freelancers
- 5.3.2 Enterprises
- 5.3.3 Start Ups and Others
- 5.4 By Geography
- 5.4.1 Germany
- 5.4.2 United Kingdom
- 5.4.3 France
- 5.4.4 Italy
- 5.4.5 Spain
- 5.4.6 Rest of Europe
6 Competitive Landscape
- 6.1 Market Concentration
- 6.2 Strategic Moves
- 6.3 Market Share Analysis
- 6.4 Company Profiles (includes Global level Overview, Market level overview, Core Segments, Financials as available, Strategic Information, Products & Services, and Recent Developments)
- 6.4.1 IWG (Regus & Spaces)
- 6.4.2 WeWork
- 6.4.3 The Office Group (TOG)
- 6.4.4 Mindspace
- 6.4.5 Industrious
- 6.4.6 Second Home
- 6.4.7 Tribes
- 6.4.8 Impact Hub
- 6.4.9 Fora Space
- 6.4.10 Talent Garden
- 6.4.11 Huckletree
- 6.4.12 Betahaus
- 6.4.13 Knotel Europe
- 6.4.14 KAPTUR
- 6.4.15 BounceSpace
- 6.4.16 Mokrin House
- 6.4.17 Paper Hub
- 6.4.18 Mortimer House
- 6.4.19 Sirius Facilities
7 Market Opportunities & Future Outlook
- 7.1 White-space & Unmet-Need Assessment
 辦公空間市場-全球產業規模、佔有率、趨勢、機會、預測:按類型、應用、地區和競爭格局分類,2021-2031年
 2026年全球公用廚房預約平台市場報告
 共享辦公空間預訂平台市場預測至2034年——全球平台類型、工作空間類型、定價模式、功能、應用、最終用戶和區域分析2026年全球共享辦公桌市場報告2026年全球共享辦公空間市場報告
 全球共享辦公空間市場規模、佔有率、趨勢和成長分析報告(2026-2034)
 共享辦公空間市場:按空間類型和區域分類
 英國共享辦公空間:市場佔有率分析、產業趨勢與統計及成長預測(2026-2031)2026年全球共享辦公空間管理軟體市場報告2026年全球辦公空間市場報告