


 |
市場調查報告書
商品編碼
1911331
共用辦公空間:市場佔有率分析、產業趨勢與統計、成長預測(2026-2031)Shared Office Spaces - Market Share Analysis, Industry Trends & Statistics, Growth Forecasts (2026 - 2031) |
||||||
※ 本網頁內容可能與最新版本有所差異。詳細情況請與我們聯繫。
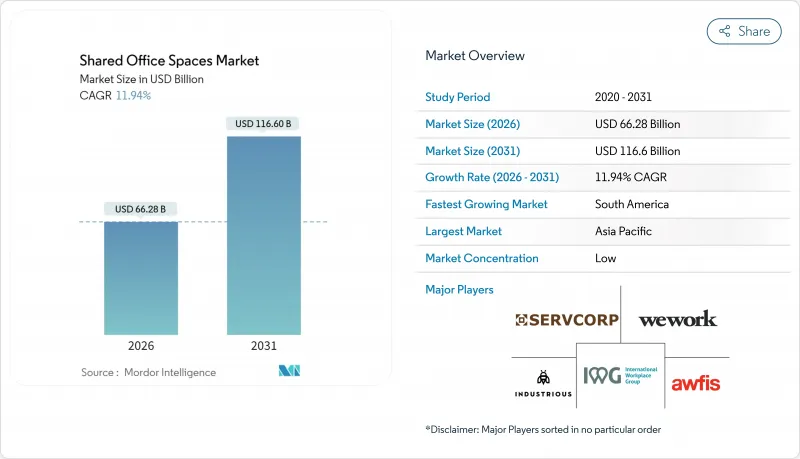
共用辦公空間市場預計將從 2025 年的 592 億美元成長到 2026 年的 662.8 億美元,到 2031 年達到 1,166 億美元,2026 年至 2031 年的複合年成長率為 11.94%。
企業加速採用混合辦公模式、投資者對輕資產模式的興趣以及向區域城市的穩步擴張,共同推動了這一成長。營運商正將重心轉向收益分成夥伴關係,以擴大網路覆蓋範圍並控制租賃義務。對健康認證和數據驅動型空間的技術投資提高了客戶留存率,但現有城市中心的供應過剩持續擠壓著利潤率。亞太地區是成長的主要驅動力,而南美洲則最具快速成長潛力,因為新進業者正在吸引首次使用彈性辦公空間的使用者。
全球共用辦公空間市場趨勢與洞察
無論在大公司或小公司,混合彈性工作安排都正迅速變得越來越普遍。
混合辦公和彈性辦公模式正迅速受到大中小型企業的青睞。世邦魏理仕 (CBRE) 的一項調查顯示,超過 92% 的受訪企業已實施混合辦公模式,其中三分之二的企業希望員工每週至少到辦公室工作三天。這種轉變使得長期租賃合約成為潛在的風險,而靈活的合約條款則成為一項策略性需求。企業紛紛轉向共用辦公空間,以便根據員工出勤率的波動調整座位數量,並消除閒置空間帶來的成本。這種模式不僅降低了成本,也有助於人才招聘,因為員工越來越重視工作地點的柔軟性。能夠保證在多個城市提供最高安全等級和始終如一的服務品質的營運商,其需求量正在激增。
全球共享辦公室營運商正向新興城市和區域城市擴張
為了滿足日益成長的需求,全球共享辦公空間營運商正加速向新興城市和區域城鎮擴張。 2024年,IWG主要透過合作開設了867個辦公地點,營收成長至33億英鎊(41億美元)。該公司專注於輕資產交易,將更多資金投入裝修而非租賃。這種模式提高了投資報酬率(ROIC),並支持了郊區和區域城鎮的發展,這些地區的優質共同工作空間歷來稀缺。分散的辦公地點使IWG能夠減少其遠距辦公團隊的通勤時間,並從傳統的市中心模式轉向軸輻式網路。這項策略不僅保護了營運商免受市中心潛在空置風險的影響,也滿足了當地中小企業未被滿足的需求。
高昂的營運和內部成本降低了營運商的盈利。
在彈性辦公空間市場,高昂的營運和裝修成本正嚴重影響營運商的盈利。 2024年第二季度,WeWork的運轉率降至67%,固定成本超過收入,引發了人們對其償付能力的擔憂。該公司的高階裝修、企業級IT基礎設施和一流服務都需要大量的資本投入。當出現空置時,這些成本尤其沉重。營運商正日益尋求房東的合作以減輕這一資本負擔,但小規模的供應商卻難以籌集資金進行現代化整修。這項挑戰可能會加速市場退出,並進一步加劇產業整合。
細分市場分析
截至2025年,共享辦公空間佔共用辦公市場總量的59.12%。其成功歸功於即用型環境、社區計畫以及對試點團隊和新市場進入者而言的具成本效益。企業傾向於選擇共享辦公中心內的專屬套間,以兼顧隱私和協作機會。對於那些需要固定期限、配備齊全的私人空間的企業而言,服務式辦公室和行政套房仍然需求旺盛。
混合辦公和虛擬辦公室解決方案將成為成長最快的細分市場,2026 年至 2031 年的複合年成長率將達到 12.75%。這些解決方案整合了基於雲端的辦公桌預訂、去中心化會員制和按需會議額度,反映了混合辦公通訊協定的廣泛應用。 WeWork 與 Vast Coworking Group 合作,在郊區部署 75 個無需租賃承諾的辦公地點,體現了營運商向網路化服務交付模式的轉變。這些模式使企業能夠根據計劃進度靈活調整其辦公空間佈局,進而提升共用辦公空間市場的價值提案。
區域分析
亞太地區預計到2025年將佔全球收入的37.10%,這主要得益於快速的都市化和政府支持的創新中心。印度的共享辦公空間(以Smartworks和IndiQube等為主導)運轉率接近飽和,尤其是在向二線城市擴張之後。在中國,共用辦公空間被納入智慧城市規劃。在東南亞,遊客和數位遊民的興起促使該地區的營運商組織具有文化意義的社區活動,作為其網路擴大策略的一部分。
北美是第二大市場,但情況較為複雜。城市地區空置率上升導致租金下降,迫使營運商增加配套設施以維持租金。同時,郊區蓬勃發展,美國45%的彈性辦公空間位於中央商務區(CBD)以外,滿足了人們縮短通勤時間的需求。企業客戶擴大將郊區空間用作衛星辦公室,從而在傳統住宅擴展業務網路。
南美洲成長最快,預計到2031年複合年成長率將達到13.28%。巴西是推動這一成長的主要力量,但哥倫比亞和智利的次市場也吸引了首次進入拉丁美洲的跨國公司日益濃厚的興趣。儘管匯率波動構成風險,但業主正透過管理協議與營運商合作,以降低准入風險。在歐洲,成長穩定但較為溫和。流動性框架和跨境GDPR合規性正在支撐成長,尤其是在擁有穩定遠距工作簽證政策的大都會地區。
其他福利
- Excel格式的市場預測(ME)表
- 3個月的分析師支持
目錄
第1章 引言
- 研究假設和市場定義
- 調查範圍
第2章調查方法
第3章執行摘要
第4章 市場情勢
- 市場概覽
- 市場促進因素
- 混合式和靈活式工作安排在大中小型企業中都迅速普及。
- 全球共享辦公室營運商正向新興城市和區域城市擴張
- 來自Start-Ups、自由工作者和數位遊牧者的需求不斷成長
- 投資者對共用辦公室投資組合的興趣在於將其視為一種具有韌性的資產類別。
- 租戶更傾向於選擇獲得健康認證、配備科技設施且以社區主導的空間。
- 市場限制
- 高昂的營運和內部成本正在降低營運商的盈利。
- 成熟市場供應過剩的風險及相關的價格壓力
- 經濟波動影響中小企業和Start-Ups運轉率的穩定性
- 價值/供應鏈分析
- 概述
- 房地產開發商和資產所有者——關鍵的定量和定性見解
- 工作空間設計技術顧問—關鍵的定量和定性見解
- 模組化家具和智慧辦公室解決方案提供者—關鍵定量和定性洞察
- 產業內的政府法規和政策
- 共享辦公室房地產市場的技術創新
- 對辦公室房地產行業關鍵指標(供應量、租金、價格、運轉率/空置率(%))的深入分析
- 遠距辦公如何影響空間需求
- 波特五力模型
- 供應商的議價能力
- 買方的議價能力
- 新進入者的威脅
- 替代品的威脅
- 競爭對手之間的競爭
第5章 市場規模及成長預測(金額:美元)
- 按類型
- 共同工作空間
- 服務式辦公室/行政套房
- 其他(混合辦公、虛擬辦公)
- 按行業
- 資訊科技(IT 和 ITES)
- 銀行、金融服務和保險 (BFSI)
- 商業諮詢和專業服務
- 其他服務(零售、生命科學、能源、法律服務)
- 按最終用途
- 自由工作者
- 公司
- Start-Ups及其他
- 按地區
- 北美洲
- 美國
- 加拿大
- 墨西哥
- 南美洲
- 巴西
- 南美洲其他地區
- 歐洲
- 英國
- 德國
- 法國
- 義大利
- 西班牙
- 其他歐洲
- 中東和非洲
- 沙烏地阿拉伯
- 阿拉伯聯合大公國
- 其他中東和非洲地區
- 亞太地區
- 中國
- 印度
- 日本
- 韓國
- 澳洲
- 印尼
- 亞太其他地區
- 北美洲
第6章 競爭情勢
- 市場集中度
- 策略趨勢
- 公司簡介
- IWG plc(Regus, Spaces)
- WeWork Inc.
- Industrious
- Servcorp Ltd.
- Awfis Space Solutions
- Smartworks
- Ucommune International
- JustCo
- Convene
- Knotel
- Impact Hub
- Office Evolution
- Serendipity Labs
- 擴充型(原名 Novel Coworking)
- CommonGrounds Workplace
- The Executive Centre
- Bizspace
- Workbar
- WorkSuites
- Office Partners 360
第7章 市場機會與未來展望
The shared office spaces market is expected to grow from USD 59.20 billion in 2025 to USD 66.28 billion in 2026 and is forecast to reach USD 116.6 billion by 2031 at 11.94% CAGR over 2026-2031.
Rapid enterprise adoption of hybrid work, investor appetite for asset-light models, and steady expansion into secondary cities fuel this momentum. Operators are pivoting toward revenue-sharing partnerships that limit lease liabilities while extending network reach. Technology investments in wellness-certified, data-driven spaces deepen client stickiness, even as oversupply in legacy urban cores pressures margins. Asia-Pacific drives headline growth, while South America offers the steepest runway for new entrants courting first-time flexible-workspace users.
Global Shared Office Spaces Market Trends and Insights
Rapid Adoption of Hybrid and Flexible Work Models Across Corporations and SMEs
Hybrid and flexible work models are becoming increasingly prevalent among corporations and SMEs. Over 92% of clients surveyed by CBRE have adopted hybrid work schedules, with two-thirds anticipating their staff will be onsite a minimum of three days each week. This transition has turned extended leases into potential liabilities, making flexible terms a strategic imperative. Companies are gravitating towards shared office spaces, allowing them to adjust seating based on fluctuating attendance and reducing costs associated with unused space. This setup not only cuts costs but also attracts talent, as employees increasingly value location flexibility. Operators who can ensure top-tier security and consistent quality across different cities are witnessing a surge in demand.
Expansion of Global Co-working Operators into Emerging and Secondary Cities
Global co-working operators are increasingly expanding into emerging and secondary cities to meet growing demand. In 2024, IWG increased its revenue to GBP3.3 billion (USD 4.1 billion) by opening 867 sites, primarily through partnerships. By focusing on asset-light deals, the company allocates more capital to fit-outs rather than leases. This approach improves their Return on Invested Capital (ROIC) and supports their growth into suburbs and tier-II metros, areas previously lacking premium co-working spaces. With distributed locations, IWG reduces commute times for remote-first teams, shifting from a traditional downtown-focused model to a hub-and-spoke network. This strategy not only protects operators from potential vacancies in central business districts but also addresses the unmet needs of local SMEs.
High Operational and Fit-out Costs Reducing Operator Profitability
High operational and fit-out costs are significantly impacting the profitability of operators in the flexible workspace market. In Q2 2024, WeWork's occupancy dipped to 67%, raising concerns about its solvency as fixed costs eclipsed its billings. The company's premium interiors, enterprise-level IT, and top-tier services demand hefty capital expenditures. These costs weigh heavily, especially when seats remain unoccupied. While operators are increasingly partnering with landlords to alleviate these capital burdens, smaller providers face challenges in financing modern refurbishments. This struggle could hasten their exit from the market and fuel further consolidation.
Other drivers and restraints analyzed in the detailed report include:
- Rising Demand from Start-ups, Freelancers, and Digital Nomads
- Investor Interest in Shared Office Portfolios as a Resilient Asset Class
- Oversupply Risks in Mature Markets Leading to Price Pressures
For complete list of drivers and restraints, kindly check the Table Of Contents.
Segment Analysis
Co-working accounted for 59.12% of the shared office spaces market share in 2025. Its success stems from turnkey access, community programming, and cost efficiency for pilot teams or market entries. Enterprises favor dedicated suites within co-working hubs to balance privacy with collaboration opportunities. Serviced offices and executive suites maintain relevance among firms needing fully equipped private spaces on sealed terms.
Hybrid and virtual solutions form the fastest-growing cohort at a 12.75% CAGR as 2026-2031 unfolds. They blend cloud-based desk bookings, distributed memberships, and on-demand meeting credits, mirroring wider hybrid-work protocols. WeWork's alliance with Vast Coworking Group to onboard 75 suburban sites without signing leases demonstrates operator migration toward networked service delivery. These models let companies toggle physical presence as project pipelines ebb and flow, reinforcing the value proposition of the shared office spaces market.
The Shared Office Spaces Market Report is Segmented by Type (Co-Working Space, Serviced Offices/Executive Suites and Others), by Sector (Information Technology, Business Consulting & Professional Service, and More), by End Use (Freelancers, Enterprises and Start Ups and Others), and by Geography (North America, South America, Europe, Asia-Pacific and More). The Market Forecasts are Provided in Terms of Value (USD).
Geography Analysis
In 2025, the Asia-Pacific region contributed 37.10% of global revenue, driven by rapid urbanization and government-supported innovation hubs. Co-working spaces in India, led by companies like Smartworks and IndiQube, saw occupancy levels near full capacity, especially as they expanded into tier-II cities. In China, shared offices are part of the country's smart-city plans. Southeast Asia is benefiting from an increase in tourists and digital nomads. Operators in the region are organizing culturally relevant community events to strengthen their network expansion strategies.
North America, while ranking second in value, faces mixed conditions. Downtown areas are experiencing lower prices due to rising vacancies, prompting operators to improve amenities to maintain rates. Suburbs, however, are performing well; 45% of flexible workspaces in the U.S. are now located outside central business districts, meeting the demand for shorter commutes. Enterprise clients are increasingly using suburban spaces as satellite offices, leading to the growth of networks in previously residential areas.
South America is growing the fastest, with a 13.28% CAGR projected through 2031. Brazil is leading this growth, but secondary markets in Colombia and Chile are also seeing increased interest from multinationals entering Latin America for the first time. Although currency volatility poses a risk, landlords are partnering with operators through management agreements to reduce entry risks. In Europe, growth is steady but moderate. Mobility frameworks and compliance with cross-border GDPR support this growth, particularly in capitals with stable policies for remote work visas.
- IWG plc (Regus, Spaces)
- WeWork Inc.
- Industrious
- Servcorp Ltd.
- Awfis Space Solutions
- Smartworks
- Ucommune International
- JustCo
- Convene
- Knotel
- Impact Hub
- Office Evolution
- Serendipity Labs
- Expansive (-formerly Novel Coworking)
- CommonGrounds Workplace
- The Executive Centre
- Bizspace
- Workbar
- WorkSuites
- Office Partners 360
Additional Benefits:
- The market estimate (ME) sheet in Excel format
- 3 months of analyst support
TABLE OF CONTENTS
1 Introduction
- 1.1 Study Assumptions & Market Definition
- 1.2 Scope of the Study
2 Research Methodology
3 Executive Summary
4 Market Landscape
- 4.1 Market Overview
- 4.2 Market Drivers
- 4.2.1 Rapid adoption of hybrid and flexible work models across corporates and SMEs
- 4.2.2 Expansion of global co-working operators into emerging and secondary cities
- 4.2.3 Rising demand from start-ups, freelancers, and digital nomads
- 4.2.4 Investor interest in shared office portfolios as resilient asset class
- 4.2.5 Increasing tenant preference for wellness-certified, tech-enabled, and community-driven spaces
- 4.3 Market Restraints
- 4.3.1 High operational and fit-out costs reducing operator profitability
- 4.3.2 Oversupply risks in mature markets leading to price pressures
- 4.3.3 Economic volatility impacting occupancy stability for SMEs and start-ups
- 4.4 Value / Supply-Chain Analysis
- 4.4.1 Overview
- 4.4.2 Real Estate Developers and Asset Owners - Key Quantitative and Qualitative Insights
- 4.4.3 Workspace Design and Technology Consultants - Key Quantitative and Qualitative Insights
- 4.4.4 Modular Furniture and Smart Office Solutions Providers - Key Quantitative and Qualitative Insights
- 4.5 Government Regulations and Initiatives in the Industry
- 4.6 Technological Innovations in the Shared Office Space Real Estate Market
- 4.7 Insights into the Key Office Real Estate Industry Metrics (Supply, Rentals, Prices, Occupancy/Vacancy (%))
- 4.8 Impact of Remote Working on Space Demand
- 4.9 Porter's Five Forces
- 4.9.1 Bargaining Power of Suppliers
- 4.9.2 Bargaining Power of Buyers
- 4.9.3 Threat of New Entrants
- 4.9.4 Threat of Substitutes
- 4.9.5 Intensity of Competitive Rivalry
5 Market Size & Growth Forecasts (Value USD)
- 5.1 By Type
- 5.1.1 Co-Working Space
- 5.1.2 Serviced offices / Executive suites
- 5.1.3 Others (Hybrid, Virtual Office)
- 5.2 By Sector
- 5.2.1 Information Technology (IT and ITES)
- 5.2.2 BFSI (Banking, Financial Services and Insurance)
- 5.2.3 Business Consulting & Professional Service
- 5.2.4 Other Services (Retail, Lifesciences, Energy, Legal Services)
- 5.3 By End Use
- 5.3.1 Freelancers
- 5.3.2 Enterprises
- 5.3.3 Start Ups and Others
- 5.4 By Geography
- 5.4.1 North America
- 5.4.1.1 United States
- 5.4.1.2 Canada
- 5.4.1.3 Mexico
- 5.4.2 South America
- 5.4.2.1 Brazil
- 5.4.2.2 Rest of South America
- 5.4.3 Europe
- 5.4.3.1 United Kingdom
- 5.4.3.2 Germany
- 5.4.3.3 France
- 5.4.3.4 Italy
- 5.4.3.5 Spain
- 5.4.3.6 Rest of Europe
- 5.4.4 Middle East and Africa
- 5.4.4.1 Saudi Arabia
- 5.4.4.2 United Arab Emirates
- 5.4.4.3 Rest of Middle East and Africa
- 5.4.5 Asia-Pacific
- 5.4.5.1 China
- 5.4.5.2 India
- 5.4.5.3 Japan
- 5.4.5.4 South Korea
- 5.4.5.5 Australia
- 5.4.5.6 Indonesia
- 5.4.5.7 Rest of Asia-Pacific
- 5.4.1 North America
6 Competitive Landscape
- 6.1 Market Concentration
- 6.2 Strategic Moves
- 6.3 Company Profiles {(includes Global level Overview, Market level overview, Core Segments, Financials as available, Strategic Information, Products & Services, and Recent Developments)}
- 6.3.1 IWG plc (Regus, Spaces)
- 6.3.2 WeWork Inc.
- 6.3.3 Industrious
- 6.3.4 Servcorp Ltd.
- 6.3.5 Awfis Space Solutions
- 6.3.6 Smartworks
- 6.3.7 Ucommune International
- 6.3.8 JustCo
- 6.3.9 Convene
- 6.3.10 Knotel
- 6.3.11 Impact Hub
- 6.3.12 Office Evolution
- 6.3.13 Serendipity Labs
- 6.3.14 Expansive (-formerly Novel Coworking)
- 6.3.15 CommonGrounds Workplace
- 6.3.16 The Executive Centre
- 6.3.17 Bizspace
- 6.3.18 Workbar
- 6.3.19 WorkSuites
- 6.3.20 Office Partners 360
7 Market Opportunities & Future Outlook
 辦公空間市場規模、佔有率和成長分析:按物業類型、等級、租賃類型、公司規模、最終用途產業、用途和地區分類-2026-2033年產業預測
 印度彈性辦公空間:市場佔有率分析、產業趨勢與統計及成長預測(2026-2031)
 共享辦公空間市場:按類型、產品類型、營運模式、產業和最終用戶分類-2026-2032年全球市場預測
 辦公空間市場-全球產業規模、佔有率、趨勢、機會、預測:按類型、應用、地區和競爭格局分類,2021-2031年
 2026年全球公用廚房預約平台市場報告
 共享辦公空間預訂平台市場預測至2034年——全球平台類型、工作空間類型、定價模式、功能、應用、最終用戶和區域分析2026年全球共享辦公桌市場報告2026年全球共享辦公空間市場報告
 全球共享辦公空間市場規模、佔有率、趨勢和成長分析報告(2026-2034)
 共享辦公空間市場:按空間類型和區域分類