


 |
市場調查報告書
商品編碼
1940703
美國維護、修理和營運 (MRO):市場佔有率分析、行業趨勢和統計數據、成長預測 (2026-2031)United States Maintenance, Repair, And Operations (MRO) - Market Share Analysis, Industry Trends & Statistics, Growth Forecasts (2026 - 2031) |
||||||
※ 本網頁內容可能與最新版本有所差異。詳細情況請與我們聯繫。
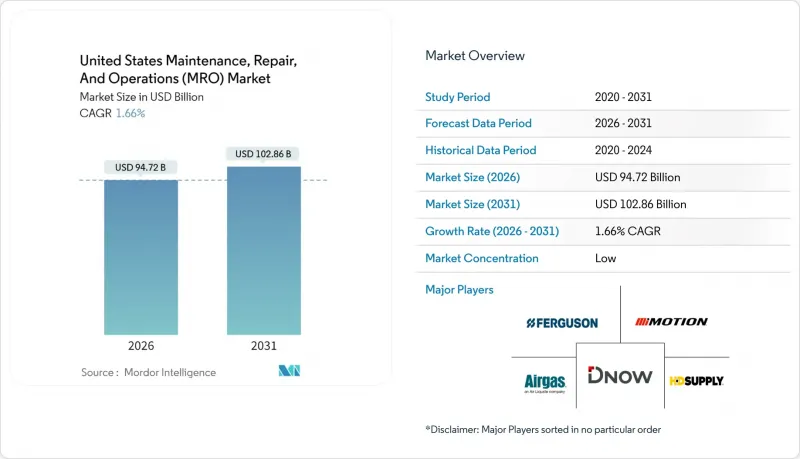
2025年美國維護、修理和營運(MRO)市場價值為931.7億美元,預計到2031年將達到1028.6億美元,高於2026年的947.2億美元。
預計在預測期(2026-2031 年)內,複合年成長率將達到 1.66%。
這一前景反映了市場的成熟度,儘管受到結構性勞動力短缺的限制,但得益於聯邦基礎設施支出和採購業務的快速數位化。工業資產裝置容量的不斷成長、對節能維修需求的日益成長以及預測性維護軟體的廣泛應用,是推動市場溫和成長的根本動力。 《基礎設施投資和就業創造法案》、《晶片與科學法案》以及《通貨膨脹控制法案》等政策獎勵持續刺激對半導體製造廠、電池工廠和清潔能源計劃的資本投資,而這些項目都依賴高價值的維護、維修和大修 (MRO) 服務。同時,隨著買家轉向能夠提高採購效率、減少交易量並改善庫存可見度的整合式線上平台,電子商務的滲透率正在加速提升。儘管存在這些機遇,市場仍面臨許多挑戰,包括嚴重的技術純熟勞工短缺、分銷經銷商毛利率下降以及持續的供應鏈波動,這些波動推高了倉儲成本並延長了交貨時間。租賃和分銷公司之間的整合仍然是應對競爭的關鍵策略,近期價值超過 150 億美元的收購案便印證了這一點,這些收購旨在實現規模經濟並擴大地域覆蓋範圍。
美國維護、維修和營運 (MRO) 市場趨勢與洞察
透過預測性維護降低成本
實施預測性維護計劃的組織報告稱,計劃外停機時間減少了 50% 以上,缺陷減少了 70% 以上,這使得維護、維修和大修 (MRO) 從成本中心轉變為價值創造者。航空業者擴大將狀態監控納入機隊管理契約,而工業設施則將物聯網感測器與分析平台整合,以確保服務水準保證。能夠提供數據驅動的運轉率保證的供應商可以獲得更高的價格,而買家則受益於更低的生命週期成本和更高的設備運轉率。政府資助的工業評估中心的興起進一步促進了中型製造商採用預測性技術。隨著預測性解決方案的規模化,軟體使用費和感測器維修費將成為服務供應商的經常性收入來源,進一步推動了複合年成長率 (CAGR)。
工業資產老化導致維修週期增加
美國1950年代和1960年代運作的大量工業機械設備已超過設計壽命,導致維護頻率增加,單一設備的維護成本上升。墨西哥灣沿岸地區的化學和石化設施正面臨日益嚴格的監管審查,壓力容器和管道系統必須進行強制性檢修。公共交通機構報告稱,車輛、軌道和設施的維修金額高達500億至800億美元。在航空領域,註冊機械師的平均年齡已達到54歲,凸顯了資產健康管理計畫的緊迫性,這些計畫旨在延長設備使用壽命並最大限度地降低安全風險。這些趨勢共同推動了對檢驗服務、狀態評估和維修零件的需求,從而支撐了美國MRO(維護、修理和大修)市場收入的穩定成長。
產品同質化對利潤率帶來壓力
數位平台上的價格透明度正在擠壓標準緊固件、軸承和耗材分銷商的利潤空間。 2024年,主要分銷商報告稱,由於客戶轉向成本最低的供應商並更多地使用自有品牌產品,其季度毛利率持續下降。市場領導格蘭傑的市佔率僅為7%,而且沒有哪家經銷商擁有足夠的規模來制定產業價格。為了維持經銷商正在增加附加價值服務,例如現場銷售、套件組裝和技術培訓,但這些服務需要前期投資和較長的投資回收期,從而擠壓了短期盈利。
細分市場分析
到2025年,工業MRO(維護、維修和營運)將佔總收入的45.32%,這主要得益於製造業、採礦業和加工業的龐大機械設備基礎。美國工業MRO市場規模的成長主要受半導體製造、汽車電氣化和航太組裝等領域投資回流的推動。高運轉率使得密封件、軸承和液壓元件的更換週期保持穩定。受電網現代化補貼和工廠電氣化強制令的推動,對開關設備、驅動裝置和感測器的需求增加,預計到2031年,電氣MRO將以2.75%的複合年成長率成長。隨著聯邦獎勵加速維修改造,專注於電氣設備維修的服務供應商正在不斷擴大市場佔有率。
設施維護、維修和大修 (MRO) 領域對建築系統維護(包括暖通空調、屋頂和管道)的需求穩定,而「其他」類別則涵蓋醫療設備校準和通訊設備維護等專業細分領域。操作技術( 冷暖氣空調 ) 和資訊科技 (IT) 的整合正在模糊傳統界限,尤其是在互聯系統需要能夠同時管理機械和網路安全任務的技術人員的情況下。擁有綜合性多學科團隊的供應商正以可觀的利潤率贏得長期服務合約。
截至2025年,製造業將占美國維護、維修和營運(MRO)市場佔有率的37.62%,這主要得益於與機械設備維護和故障相關的570億美元支出。五大湖區和墨西哥灣沿岸的重工業叢集對泵浦、閥門和變速箱的檢修需求穩定成長。然而,醫療保健產業將主導醫院升級老舊基礎設施並遵守嚴格的設備維護標準。根據《基礎設施投資和就業創造法案》,聯邦政府已撥款數十億美元用於醫院的節能維修,這將進一步擴大醫療保健產業的服務市場。
能源與公共產業產業持續穩定成長,這主要得益於管線完整性維護專案和電廠延壽計劃的推進。隨著飛機運轉率的提高,航太與國防產業的需求呈現復甦趨勢,引擎維護服務也逐漸成為利潤豐厚的細分市場。儘管建築週期會帶來波動,但模組化和異地製造技術的日益普及為預防性維護項目和售後零件供應創造了機會。
其他福利:
- Excel格式的市場預測(ME)表
- 分析師支持(3個月)
目錄
第1章 引言
- 研究假設和市場定義
- 調查範圍
第2章調查方法
第3章執行摘要
第4章 市場情勢
- 市場概覽
- 市場促進因素
- 預測性維護的成本降低效益
- 工業設備老化導致維修週期增加
- MRO用品的電子商務滲透率
- 透過回流投資擴大已安裝基礎
- 聯邦政府對節能維修的激勵措施
- 用於按需製造備件的積層製造技術
- 市場限制
- 產品同質化對利潤率帶來壓力
- 供應鏈波動和庫存短缺
- 熟練的MRO(維修、維修和大修)勞動力短缺
- 連網裝置的網路安全風險
- 產業價值鏈分析
- 監管環境
- 技術展望
- 波特五力分析
- 供應商的議價能力
- 買方的議價能力
- 新進入者的威脅
- 替代品的威脅
- 競爭對手之間的競爭
- 對宏觀經濟趨勢的市場評估
第5章 市場規模與成長預測
- 按MRO類型
- 工業維護、維修和運行
- 電氣維護、維修和運行
- 設施維護、維修和大修
- 其他MRO類型
- 按最終用戶行業分類
- 製造業
- 能源與公共產業
- 航太與國防
- 建造
- 衛生保健
- 其他終端用戶產業
- 依採購模式
- 內部採購
- 外包(第三方/IFM)
- 一體化供應(VMI/一體化MRO)
- 透過維護方法
- 預防/定期
- 調整/反應
- 預知/條件
- 透過分銷管道
- 線下經銷商
- 線上/電子商務
- 直接從原始設備製造商採購
第6章 競爭情勢
- 市場集中度
- 策略趨勢
- 市佔率分析
- 公司簡介
- Ferguson PLC
- Motion Industries Inc.(Genuine Parts Company)
- Airgas Inc.(Air Liquide SA)
- DNOW Inc.(DistributionNOW)
- HD Supply Holdings Inc.
- MRC Global Inc.
- Fastenal Company
- MSC Industrial Direct Co. Inc.
- Applied Industrial Technologies
- WESCO International Inc.
- Sonepar SA
- Rexel Holdings USA(Rexel)
- Eastern Power Technologies Inc.
- Consolidated Electrical Distributors Inc.
- Elliot Electric Supply
- Border States Industrial Inc.
- Ferguson PLC
- WW Grainger Inc.
- Fastenal Company
- MSC Industrial Direct Co. Inc.
- Distribution Solutions Group Inc.
- The Home Depot Inc.(Interline Brands Inc.)
- Builders Firstsource
- Bluelinx Holdings
第7章 市場機會與未來展望
The United States Maintenance, Repair, And Operations Market was valued at USD 93.17 billion in 2025 and estimated to grow from USD 94.72 billion in 2026 to reach USD 102.86 billion by 2031, at a CAGR of 1.66% during the forecast period (2026-2031).
This outlook reflects the market's maturity, limited by structural labor shortages yet supported by federal infrastructure spending and rapid digitalization of procurement. Moderate growth is anchored by an expanding installed base of industrial assets, rising demand for energy-efficient retrofits, and wider use of predictive maintenance software. Policy incentives from the Infrastructure Investment and Jobs Act, the CHIPS and Science Act, and the Inflation Reduction Act continue to stimulate capital investment in semiconductor fabs, battery plants, and clean-energy projects, all of which rely on high-value MRO services. At the same time, e-commerce penetration accelerates as buyers migrate to integrated online platforms that streamline sourcing, reduce transaction volume, and improve inventory visibility. Despite these opportunities, the market contends with acute skilled-labor shortages, shrinking distributor gross margins, and ongoing supply-chain volatility that inflates carrying costs and lengthens lead times. Consolidation among rental and distribution companies remains a primary competitive response, with more than USD 15 billion in recent acquisitions aimed at scale efficiencies and expanded geographic coverage.
United States Maintenance, Repair, And Operations (MRO) Market Trends and Insights
Predictive Maintenance Driven Cost Savings
Organizations adopting predictive programs report eliminating more than 50% of unplanned downtime and cutting defects by over 70%, shifting MRO from a cost center to a value generator. Aviation operators increasingly embed condition-based monitoring in fleet management contracts, and industrial facilities pair IoT sensors with analytics platforms to secure service-level guarantees. Vendors capable of delivering data-backed uptime commitments command premium rates, while buyers benefit from lower lifecycle costs and higher equipment availability. The growing roster of government-funded Industrial Assessment Centers further diffuses predictive know-how across mid-sized manufacturers. As predictive solutions scale, software fees and sensor retrofits become recurring revenue streams for service providers, reinforcing the positive CAGR contribution.
Aging Industrial Assets Increasing Repair Cycles
A large share of U.S. industrial machinery installed during the 1950s-1960s is now operating beyond its design life, driving more frequent maintenance events and higher spend per asset. Chemical and petrochemical facilities in the Gulf Coast face heightened regulatory scrutiny, prompting mandated overhauls of pressure vessels and piping systems. Public transit agencies report a USD 50-80 billion backlog for railcar, track, and facility rehabilitation . In aviation, the average certified mechanic age of 54 years underscores the urgency of asset-integrity management programs that minimize safety risks while extending service life. These dynamics collectively increase demand for inspection services, condition assessments, and refurbishment parts, supporting steady revenue growth for the United States MRO market.
Margin Pressure from Product Commoditization
Price transparency on digital platforms reduces distributor mark-ups across standard fasteners, bearings, and consumables. During 2024, leading distributors reported sequential gross-margin declines as customers migrated to lowest-cost suppliers and expanded use of private-label alternatives. With market leader Grainger holding only 7% share, no participant wields sufficient scale to set industry pricing. Distributors increasingly emphasize value-added services, such as on-site vending, kitting, and technical training, to preserve margins, yet these services entail upfront investment and longer payback periods that strain near-term profitability.
Other drivers and restraints analyzed in the detailed report include:
- E-commerce Penetration of MRO Supplies
- Reshoring Investments Expanding Installed Base
- Supply-Chain Volatility and Inventory Shortages
For complete list of drivers and restraints, kindly check the Table Of Contents.
Segment Analysis
Industrial MRO generated 45.32% of 2025 revenue, underpinned by the extensive machinery base in manufacturing, mining, and process industries. The United States maintenance, repair, and operations market size for industrial applications is fueled by reshoring investments in semiconductor fabrication, automotive electrification, and aerospace assembly. High-hour utilization rates create steady replacement cycles for seals, bearings, and hydraulic components. Electrical MRO, projected to grow at 2.75% CAGR to 2031, benefits from grid-modernization grants and plant electrification mandates that boost demand for switchgear, drives, and sensors. As federal incentives accelerate energy-efficiency upgrades, service providers specializing in electrical retrofits capture incremental market share.
The facility MRO segment maintains stable demand from building-system upkeep, including HVAC, roofing, and plumbing, while the "other" category comprises specialized niches such as medical-device calibration and telecom-equipment servicing. Convergence of operational technology and IT blurs traditional boundaries, particularly as interconnected systems require technicians who can manage both mechanical and cyber-security tasks. Providers that integrate multi-disciplinary teams secure longer-term service agreements at favorable margins.
Manufacturing commanded 37.62% of the United States maintenance, repair, and operations market share in 2025, supported by USD 57 billion in machinery upkeep and additional fault-related spending. Heavy-industry clusters in the Great Lakes and Gulf Coast create consistent demand for pump, valve, and gearbox overhauls. Yet healthcare leads in growth, advancing at 2.56% CAGR through 2031 as hospitals retrofit aging infrastructure and comply with stringent equipment-maintenance standards. Federal funding under the Infrastructure Investment and Jobs Act earmarks billions for hospital energy upgrades, further expanding the healthcare serviceable market.
Energy and utilities remain steady contributors, driven by pipeline-integrity programs and power-plant life-extension projects. Aerospace and defense demand rebounds alongside higher fleet-utilization rates, with engine-maintenance services surfacing as a high-margin niche. Construction cycles introduce volatility, but the rising prevalence of modular and off-site fabrication increases opportunities for pre-emptive maintenance planning and aftermarket parts supply.
The United States Maintenance, Repair, and Operations (MRO) Market Report is Segmented by MRO Type (Industrial, Electrical, and More), End-User Industry (Manufacturing, Energy and Utilities, and More), Sourcing Model (In-House, Outsourced, and More), Maintenance Approach (Preventive, Corrective, and More), and Distribution Channel (Offline, Online, and More). The Market Forecasts are Provided in Terms of Value (USD).
List of Companies Covered in this Report:
- Ferguson PLC
- Motion Industries Inc. (Genuine Parts Company)
- Airgas Inc. (Air Liquide SA)
- DNOW Inc. (DistributionNOW)
- HD Supply Holdings Inc.
- MRC Global Inc.
- Fastenal Company
- MSC Industrial Direct Co. Inc.
- Applied Industrial Technologies
- WESCO International Inc.
- Sonepar SA
- Rexel Holdings USA (Rexel)
- Eastern Power Technologies Inc.
- Consolidated Electrical Distributors Inc.
- Elliot Electric Supply
- Border States Industrial Inc.
- Ferguson PLC
- W.W. Grainger Inc.
- Fastenal Company
- MSC Industrial Direct Co. Inc.
- Distribution Solutions Group Inc.
- The Home Depot Inc. (Interline Brands Inc.)
- Builders Firstsource
- Bluelinx Holdings
Additional Benefits:
- The market estimate (ME) sheet in Excel format
- 3 months of analyst support
TABLE OF CONTENTS
1 INTRODUCTION
- 1.1 Study Assumptions and Market Definition
- 1.2 Scope of the Study
2 RESEARCH METHODOLOGY
3 EXECUTIVE SUMMARY
4 MARKET LANDSCAPE
- 4.1 Market Overview
- 4.2 Market Drivers
- 4.2.1 Predictive maintenance driven cost savings
- 4.2.2 Aging industrial assets increasing repair cycles
- 4.2.3 E-commerce penetration of MRO supplies
- 4.2.4 Reshoring investments expanding installed base
- 4.2.5 Federal incentives for energy-efficient retrofits
- 4.2.6 Additive manufacturing for on-demand spares
- 4.3 Market Restraints
- 4.3.1 Margin pressure from product commoditization
- 4.3.2 Supply-chain volatility and inventory shortages
- 4.3.3 Skilled MRO labor shortage
- 4.3.4 Cyber-security risks in connected equipment
- 4.4 Industry Value Chain Analysis
- 4.5 Regulatory Landscape
- 4.6 Technological Outlook
- 4.7 Porter's Five Forces Analysis
- 4.7.1 Bargaining Power of Suppliers
- 4.7.2 Bargaining Power of Buyers
- 4.7.3 Threat of New Entrants
- 4.7.4 Threat of Substitutes
- 4.7.5 Intensity of Competitive Rivalry
- 4.8 Assessment of Macro-economic Trends on the Market
5 MARKET SIZE AND GROWTH FORECASTS (VALUES)
- 5.1 By MRO Type
- 5.1.1 Industrial MRO
- 5.1.2 Electrical MRO
- 5.1.3 Facility MRO
- 5.1.4 Other MRO Types
- 5.2 By End-User Industry
- 5.2.1 Manufacturing
- 5.2.2 Energy and Utilities
- 5.2.3 Aerospace and Defense
- 5.2.4 Construction
- 5.2.5 Healthcare
- 5.2.6 Other End-user Industries
- 5.3 By Sourcing Model
- 5.3.1 In-house
- 5.3.2 Outsourced (3rd-party/IFM)
- 5.3.3 Integrated Supply (VMI/Integrated-MRO)
- 5.4 By Maintenance Approach
- 5.4.1 Preventive / Scheduled
- 5.4.2 Corrective / Reactive
- 5.4.3 Predictive / Condition-based
- 5.5 By Distribution Channel
- 5.5.1 Offline Distributors
- 5.5.2 Online / E-commerce
- 5.5.3 Direct from OEM
6 COMPETITIVE LANDSCAPE
- 6.1 Market Concentration
- 6.2 Strategic Moves
- 6.3 Market Share Analysis
- 6.4 Company Profiles (includes Global level Overview, Market level overview, Core Segments, Financials as available, Strategic Information, Market Rank/Share for key companies, Products and Services, and Recent Developments)
- 6.4.1 Ferguson PLC
- 6.4.2 Motion Industries Inc. (Genuine Parts Company)
- 6.4.3 Airgas Inc. (Air Liquide SA)
- 6.4.4 DNOW Inc. (DistributionNOW)
- 6.4.5 HD Supply Holdings Inc.
- 6.4.6 MRC Global Inc.
- 6.4.7 Fastenal Company
- 6.4.8 MSC Industrial Direct Co. Inc.
- 6.4.9 Applied Industrial Technologies
- 6.4.10 WESCO International Inc.
- 6.4.11 Sonepar SA
- 6.4.12 Rexel Holdings USA (Rexel)
- 6.4.13 Eastern Power Technologies Inc.
- 6.4.14 Consolidated Electrical Distributors Inc.
- 6.4.15 Elliot Electric Supply
- 6.4.16 Border States Industrial Inc.
- 6.4.17 Ferguson PLC
- 6.4.18 W.W. Grainger Inc.
- 6.4.19 Fastenal Company
- 6.4.20 MSC Industrial Direct Co. Inc.
- 6.4.21 Distribution Solutions Group Inc.
- 6.4.22 The Home Depot Inc. (Interline Brands Inc.)
- 6.4.23 Builders Firstsource
- 6.4.24 Bluelinx Holdings
7 MARKET OPPORTUNITIES AND FUTURE OUTLOOK
- 7.1 White-Space and Unmet-Need Assessment
 2026年全球重型設備維護、修理和大修(MRO)市場報告
 農業無人機維護服務市場報告:趨勢、預測與競爭分析(至2035年)全球MRO(維護、維修與營運)市場:機會與策略展望(至2035年)
 維護、維修和營運 (MRO) 市場規模、佔有率、趨勢和預測:按供應商、MRO 類型和地區分類,2026-2034 年2026年全球工業維護服務市場報告2026年全球維護服務市場報告
 辦公艙市場按艙體類型、建築材料、移動性和部署方式、設計配置、分銷管道和最終用戶行業分類-全球預測,2026-2032年
 電動車維護市場機會、成長要素、產業趨勢分析及2026-2035年預測飛行員艙市場依產品類型、機器類型、通路和最終用戶分類,全球預測(2026-2032年)
 歐洲維護、維修和營運 (MRO) 市場:市場佔有率分析、行業趨勢、統計數據和成長預測 (2026-2031)