


 |
市場調查報告書
商品編碼
1940693
二手及翻新智慧型手機:市佔率分析、產業趨勢及統計、成長預測(2026-2031)Used And Refurbished Smartphone - Market Share Analysis, Industry Trends & Statistics, Growth Forecasts (2026 - 2031) |
||||||
※ 本網頁內容可能與最新版本有所差異。詳細情況請與我們聯繫。
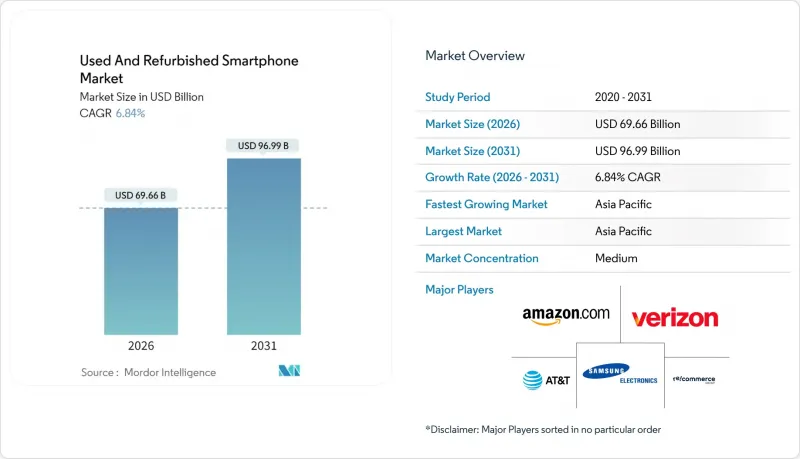
預計二手和翻新智慧型手機市場將從 2025 年的 652 億美元成長到 2026 年的 696.6 億美元,到 2031 年將達到 969.9 億美元,2026 年至 2031 年的複合年成長率為 6.84%。
就出貨量而言,市場規模預計將從2025年的3.15億部成長到2030年的4.3億部,在預測期內(2025-2030年)的複合年成長率(CAGR)為6.42%。亞太地區的成長動力主要來自高價新機、不斷擴大的OEM以舊換新計畫以及旨在遏制電子廢棄物的監管壓力。售價超過1,300美元的旗艦機型促使價格敏感型消費者轉向認證二手設備,而5G升級週期也為二手市場帶來了穩定的準新機供應。線上市場簡化了評級、保固和退貨流程,縮小了先前阻礙市場成長的可靠性差距。企業和消費者一樣,也開始接受設備再利用,以實現排放目標並降低硬體預算。這些因素共同推動了二手和翻新智慧型手機市場的強勁成長。
全球二手及翻新智慧型手機市場趨勢與洞察
智慧型手機價格上漲,縮小了消費者所能負擔的價格範圍。
像 iPhone 16 Pro Max 這樣的旗艦機型售價高達 1,399.99 美元,令許多消費者望而卻步。而同款機型的認證二手版本售價則低 30% 至 40%,進一步拉大了價格差距,從而推動了二手和翻新智慧型手機市場的發展。在新興經濟體,進口翻新產品往往是實現 5G 連接的唯一經濟可行的途徑,這使得更高的價格成為推動結構性成長的催化劑。
OEM認證計畫重新定義品質標準
包括蘋果和三星在內的原始設備製造商(OEM)透過提供新電池、外觀修復和一年保修,提振了消費者信心並規範了設備等級。歐洲投資銀行於2024年向Swappie提供的1,700萬歐元貸款,也印證了投資人對大規模翻新模式的信心。
消費者對可靠性的擔憂仍然存在。
即使有原廠保修,65%的潛在買家仍將電池劣化和防水性能下降列為他們最擔心的問題,這阻礙了新進入翻新機市場的企業。因此,宣傳活動教育活動和提供延長保固服務對於降低消費者的風險認知仍然至關重要。
細分市場分析
認證二手設備正以7.28%的複合年成長率成長,但普通二手設備仍佔主導地位,市佔率高達60.85%。由於Phonecheck等自動化診斷解決方案(僅需2分鐘即可完成檢測),認證二手和翻新智慧型手機的市場規模正在不斷擴大。消費者越來越傾向將OEM認證視為與全新品質相同的標準,因此也願意支付更高的價格。
儘管低階設備的點對點交易仍然是主流,但更嚴格的進口限制和歐盟的「維修權」政策預計將推動透過專業剪切機進行的交易增加。這種結構性變化正在縮小品質差距,並提高品牌和有保障產品的價值。
到2025年,線上通路將佔銷售額的38.22%,反映出消費者偏好便利的點擊出貨服務和透明的退貨政策。通訊業者的以舊換新服務將成為庫存來源,光是AT&T一家公司在2024年就回收了1,250萬台設備。 OEM零售店雖然規模較小,但將成為成長最快的管道,年複合成長率達8.88%,因為品牌可以在保障用戶體驗的同時,直接實現二手需求的變現。
實體店對那些重視親眼所見、親手觸摸商品的消費者來說仍然至關重要,尤其是在數位支付普及速度緩慢的新興市場。融合線上線下購物體驗的策略,例如透過自助支付終端提供即時支付選項,正逐漸成為推動這一轉變的有效途徑。
二手及翻新智慧型手機市場報告按設備狀況(二手、翻新/認證二手)、銷售管道(線上市場、線下零售商等)、價格區間(100美元以下、100-199美元、200-399美元、200美元以上)、最終用戶(消費者/個人、企業/公司、政府/機構)和地區進行分析。市場預測以價值(美元)和銷售量(出貨量)兩種單位呈現。
區域分析
亞太地區將在2025年佔據最大的市場佔有率,達到41.05%,這反映了該地區較高的行動網路普及率和5G的快速部署。日本在2024年二手車銷量將達到315萬輛,比上年成長15.5%,這主要得益於其零售分銷網路的擴張以及對認證二手產品的積極行銷。中國主要電商平台正增設二手產品專區,加速二手車市場的普及。
在印度,供不應求導致需求無法滿足,預計2025年銷售量將下降5%至7%。儘管Cashify累計的收入為95.5億印度盧比(約1.18億美元),但這仍凸顯了回收網路的重要性。東南亞智慧型手機年成長率高達20%,加上人口結構年輕化和數據消費量不斷成長,預計將使該地區在二手和翻新智慧型手機市場佔據相當大的佔有率。
北美地區的通訊業者計畫已經相當成熟,但仍有70%的用戶持有二手設備,這表明存在潛在的供應來源。企業回收計劃和維修權立法可能會推動更多分銷管道的拓展。歐洲將受益於2025年6月生效的生態設計指令,該指令通過七年的零件供應義務,降低翻新成本並延長設備使用壽命。
其他福利:
- Excel格式的市場預測(ME)表
- 3個月的分析師支持
目錄
第1章 引言
- 研究假設和市場定義
- 調查範圍
第2章調查方法
第3章執行摘要
第4章 市場情勢
- 市場概覽
- 市場促進因素
- 智慧型手機零售價格上漲推動了次市場需求。
- 拓展線上市場,實現更便利的交易
- 原始設備製造商主導的以舊換新和認證再製造計劃
- 永續性法規與消費者環保意識
- 5G將加速設備更換週期,導致二手設備供應增加。
- 一種面向企業的設備租賃模式,可提供高品質的庫存。
- 市場限制
- 消費者關注品質和保固問題
- 假零件和灰色經銷商日益增加。
- 軟體安全鎖限制了翻新產品的可行性。
- 加強對電子廢棄物進出口的監管
- 價值鏈分析
- 監管環境
- 技術展望
- 分銷通路趨勢(OEM 與第三方平台)
- 5G將如何影響二手和翻新智慧型手機
- 波特五力分析
- 供應商的議價能力
- 消費者議價能力
- 新進入者的威脅
- 競爭對手之間的競爭
- 替代品的威脅
- 影響市場的宏觀經濟因素
第5章 市場規模與成長預測
- 按設備狀態
- 用過的
- 翻新/認證二手
- 按銷售管道
- 網路市集
- 線下零售商
- 通訊業者/承運商以舊換新計劃
- OEM認證翻新店
- 批發/B2B
- 按價格範圍
- 100美元以下
- 100-199美元
- 200-399美元
- 400-599美元
- 超過 600 美元
- 最終用戶
- 消費者/個人
- 商業/企業
- 政府/機構
- 按地區
- 北美洲
- 美國
- 加拿大
- 墨西哥
- 南美洲
- 巴西
- 阿根廷
- 南美洲其他地區
- 歐洲
- 德國
- 英國
- 法國
- 義大利
- 西班牙
- 俄羅斯
- 其他歐洲地區
- 亞太地區
- 中國
- 印度
- 日本
- 韓國
- 東南亞
- 亞太其他地區
- 中東
- 沙烏地阿拉伯
- 阿拉伯聯合大公國
- 土耳其
- 其他中東地區
- 非洲
- 南非
- 奈及利亞
- 埃及
- 其他非洲地區
- 北美洲
第6章 競爭情勢
- 市場集中度
- 策略趨勢
- 市佔率分析
- 公司簡介
- Apple Inc.
- Samsung Electronics Co., Ltd.
- Back Market, Inc.
- Amazon.com, Inc.
- Recommerce Group
- Verizon Communications Inc.
- AT&T Inc.
- Best Buy Co., Inc.
- Alibaba Group Holding Ltd.
- Swappie Oy
- Cashify(Manak Waste Management Private Limited)
- Gazelle(ecoATM, LLC)
- Likewize Corp.(Brightstar Corp.)
- Trocafone, Inc.
- musicMagpie plc(Decluttr)
- FoneGiant Limited
- Reboxed Ltd.
第7章 市場機會與未來展望
The Used And Refurbished Smartphone market is expected to grow from USD 65.20 billion in 2025 to USD 69.66 billion in 2026 and is forecast to reach USD 96.99 billion by 2031 at 6.84% CAGR over 2026-2031.
In terms of shipment volume, the market is expected to grow from 315 million units in 2025 to 430 million units by 2030, at a CAGR of 6.42% during the forecast period (2025-2030). Asia-Pacific region buoyed by high new-device prices, growing OEM trade-in programs, and regulatory pressure to curb e-waste. Flagship devices priced above USD 1,300 push price-sensitive buyers toward certified alternatives, while 5G upgrade cycles recycle a steady flow of near-new handsets into the secondary channel. Online marketplaces have streamlined grading, warranty, and returns, shrinking the trust gap that once limited growth. Enterprises are joining consumers in device reuse to hit emissions goals and trim hardware budgets. Collectively, these forces position the used and refurbished smartphones market for resilient, broad-based expansion.
Global Used And Refurbished Smartphone Market Trends and Insights
Rising Smartphone Prices Narrow the Affordability Window
Flagship devices such as the iPhone 16 Pro Max list at USD 1,399.99, placing premium hardware beyond reach for many buyers . Certified units of the same model sell 30-40% lower, widening the value gap that fuels the used and refurbished smartphones market. In emerging economies, refurbished imports often represent the only financially viable path to 5G connectivity, turning price inflation into a structural growth catalyst.
OEM Certification Programs Reset Quality Expectations
Apple, Samsung, and other OEMs guarantee new batteries, cosmetic refurbishing, and full-year warranties, lifting consumer confidence and standardizing device grades. Financing from the European Investment Bank, EUR 17 million to Swappie in 2024, underscores investor belief in scale refurbishment models .
Consumer Concerns About Reliability Persist
Even with OEM guarantees, 65% of prospective buyers cite battery degradation and waterproofing loss as top worries, dampening adoption in first-time refurb markets . Educational campaigns and extended warranties remain essential to lower perceived risk.
Other drivers and restraints analyzed in the detailed report include:
- 5G Upgrade Waves Boost Supply Quality
- Online Marketplaces Remove Transaction Friction
- Counterfeit Components Undercut Trust
For complete list of drivers and restraints, kindly check the Table Of Contents.
Segment Analysis
Certified pre-owned units are accelerating at a 7.28% CAGR, while standard used phones still dominate volume at 60.85%. The used and refurbished smartphones market size for certified devices is lifted by automated testing solutions such as Phonecheck that complete diagnostics in two minutes. Increasingly, buyers equate OEM certification with near-new quality, enabling premium pricing.
Peer-to-peer resales remain popular for low-value handsets, yet stringent import laws and upcoming EU right-to-repair mandates are expected to push more trade through professional refurbishers. This structural shift narrows the quality gap and pushes value toward branded, warrantied inventory.
Online portals accounted for 38.22% of 2025 turnover, reflecting consumer preference for click-to-door convenience and transparent return policies. Carrier trade-in desks feed inventory pipelines; AT&T alone collected 12.5 million devices in 2024. OEM storefronts, though smaller, are the fastest-growing channel at 8.88% CAGR as brands monetize secondary demand directly while safeguarding user experience.
Physical retailers retain relevance for shoppers who value in-hand inspection, especially in emerging markets where digital payment penetration lags. Blended online-offline strategies, including kiosk-based instant payment options, are gaining traction to ease the transition.
The Used and Refurbished Smartphone Market Report is Segmented by Device Condition (Used, Refurbished/Certified Pre-Owned), Sales Channel (Online Marketplaces, Offline Retailers, and More), Price Band (< USD 100, USD 100-199, USD 200-399, and More), End User (Consumer/Individual, Business/Enterprise, Government/Institutional), and Geography. The Market Forecasts are Provided in Terms of Value (USD) and Volume (Shipments).
Geography Analysis
Asia-Pacific generated the largest share at 41.05% in 2025, reflecting deep mobile penetration and rapid 5G rollouts. Japan logged 3.15 million secondary sales in fiscal year 2024, up 15.5% year on year, aided by wide retail distribution and aggressive marketing of certified stock. China's e-commerce giants have added dedicated refurbished sections, accelerating mainstream acceptance.
India shows unmet demand constrained by supply gaps; unit volumes dipped 5-7% in 2025 despite Cashify posting INR 955 crore (USD 118 million) revenue, underscoring the importance of collection networks. Southeast Asia, with 20% annual smartphone growth, combines young demographics with rising data consumption, positioning the region for outsized share gains within the used and refurbished smartphones market.
North America leverages mature carrier programs, yet 70% of owners still retain retired devices, signaling latent supply. Corporate take-back schemes and right-to-repair laws could unlock additional flow. Europe benefits from the Ecodesign Directive, effective June 2025, which requires spare-parts availability for seven years, lowering refurbishment costs and enhancing device lifetimes.
- Apple Inc.
- Samsung Electronics Co., Ltd.
- Back Market, Inc.
- Amazon.com, Inc.
- Recommerce Group
- Verizon Communications Inc.
- AT&T Inc.
- Best Buy Co., Inc.
- Alibaba Group Holding Ltd.
- Swappie Oy
- Cashify (Manak Waste Management Private Limited)
- Gazelle (ecoATM, LLC)
- Likewize Corp. (Brightstar Corp.)
- Trocafone, Inc.
- musicMagpie plc (Decluttr)
- FoneGiant Limited
- Reboxed Ltd.
Additional Benefits:
- The market estimate (ME) sheet in Excel format
- 3 months of analyst support
TABLE OF CONTENTS
1 INTRODUCTION
- 1.1 Study Assumptions and Market Definition
- 1.2 Scope of the Study
2 RESEARCH METHODOLOGY
3 EXECUTIVE SUMMARY
4 MARKET LANDSCAPE
- 4.1 Market Overview
- 4.2 Market Drivers
- 4.2.1 Rising smartphone retail prices driving secondary-market demand
- 4.2.2 Expansion of online marketplaces enabling convenient transactions
- 4.2.3 OEM-led trade-in and certified refurbishment programs
- 4.2.4 Sustainability regulations and consumer eco-consciousness
- 4.2.5 5G-driven device replacement cycles increasing used-phone supply
- 4.2.6 Enterprise device-leasing models feeding high-grade inventory
- 4.3 Market Restraints
- 4.3.1 Consumer concerns around quality and warranties
- 4.3.2 Proliferation of counterfeit parts and grey-market sellers
- 4.3.3 Software security locks limiting refurb viability
- 4.3.4 Tightening e-waste import/export regulations
- 4.4 Value Chain Analysis
- 4.5 Regulatory Landscape
- 4.6 Technological Outlook
- 4.7 Distribution Channel Landscape (OEMs vs Third-Party Platforms)
- 4.8 Impact of 5G on Used and Refurbished Smartphones
- 4.9 Porter's Five Forces Analysis
- 4.9.1 Bargaining Power of Suppliers
- 4.9.2 Bargaining Power of Consumers
- 4.9.3 Threat of New Entrants
- 4.9.4 Intensity of Competitive Rivalry
- 4.9.5 Threat of Substitutes
- 4.10 Impact of Macroeconomic Factors on the Market
5 MARKET SIZE AND GROWTH FORECASTS (VALUE)
- 5.1 By Device Condition
- 5.1.1 Used
- 5.1.2 Refurbished/Certified Pre-Owned
- 5.2 By Sales Channel
- 5.2.1 Online Marketplaces
- 5.2.2 Offline Retailers
- 5.2.3 Carrier/Operator Trade-In Programs
- 5.2.4 OEM Certified Refurbished Stores
- 5.2.5 Wholesale/B2B
- 5.3 By Price Band
- 5.3.1 < USD 100
- 5.3.2 USD 100-199
- 5.3.3 USD 200-399
- 5.3.4 USD 400-599
- 5.3.5 >= USD 600
- 5.4 By End User
- 5.4.1 Consumer/Individual
- 5.4.2 Business/Enterprise
- 5.4.3 Government/Institutional
- 5.5 By Geography
- 5.5.1 North America
- 5.5.1.1 United States
- 5.5.1.2 Canada
- 5.5.1.3 Mexico
- 5.5.2 South America
- 5.5.2.1 Brazil
- 5.5.2.2 Argentina
- 5.5.2.3 Rest of South America
- 5.5.3 Europe
- 5.5.3.1 Germany
- 5.5.3.2 United Kingdom
- 5.5.3.3 France
- 5.5.3.4 Italy
- 5.5.3.5 Spain
- 5.5.3.6 Russia
- 5.5.3.7 Rest of Europe
- 5.5.4 Asia Pacific
- 5.5.4.1 China
- 5.5.4.2 India
- 5.5.4.3 Japan
- 5.5.4.4 South Korea
- 5.5.4.5 Southeast Asia
- 5.5.4.6 Rest of Asia Pacific
- 5.5.5 Middle East
- 5.5.5.1 Saudi Arabia
- 5.5.5.2 United Arab Emirates
- 5.5.5.3 Turkey
- 5.5.5.4 Rest of Middle East
- 5.5.6 Africa
- 5.5.6.1 South Africa
- 5.5.6.2 Nigeria
- 5.5.6.3 Egypt
- 5.5.6.4 Rest of Africa
- 5.5.1 North America
6 COMPETITIVE LANDSCAPE
- 6.1 Market Concentration
- 6.2 Strategic Moves
- 6.3 Market Share Analysis
- 6.4 Company Profiles (includes Global level Overview, Market level overview, Core Segments, Financials as available, Strategic Information, Market Rank/Share for key companies, Products and Services, and Recent Developments)
- 6.4.1 Apple Inc.
- 6.4.2 Samsung Electronics Co., Ltd.
- 6.4.3 Back Market, Inc.
- 6.4.4 Amazon.com, Inc.
- 6.4.5 Recommerce Group
- 6.4.6 Verizon Communications Inc.
- 6.4.7 AT&T Inc.
- 6.4.8 Best Buy Co., Inc.
- 6.4.9 Alibaba Group Holding Ltd.
- 6.4.10 Swappie Oy
- 6.4.11 Cashify (Manak Waste Management Private Limited)
- 6.4.12 Gazelle (ecoATM, LLC)
- 6.4.13 Likewize Corp. (Brightstar Corp.)
- 6.4.14 Trocafone, Inc.
- 6.4.15 musicMagpie plc (Decluttr)
- 6.4.16 FoneGiant Limited
- 6.4.17 Reboxed Ltd.
7 MARKET OPPORTUNITIES AND FUTURE OUTLOOK
- 7.1 White-Space and Unmet-Need Assessment
 二手及翻新智慧型手機市場:2026-2030年全球市場預測(依產品類型、成色等級、作業系統、連接方式、最終用戶及通路分類)
 翻新及二手行動電話市場規模、佔有率及成長分析(按類型、價格分佈範圍、銷售管道及地區分類)-2026-2033年產業預測
 翻新智慧型手機市場規模、佔有率和成長分析(按作業系統、智慧型手機類型、銷售管道和地區分類)-2026-2033年產業預測
 全球二手行動電話市場
 全球翻新和行動電話市場:行業分析、規模、佔有率、成長、趨勢和預測(2025-2032 年)
 2025-2029 年全球翻新智慧型手機市場
 中國翻新智慧型手機市場:市場佔有率分析、產業趨勢與統計、成長預測(2025-2030 年)全球翻新智慧型手機市場