


 |
市場調查報告書
商品編碼
1940612
沼氣:市場佔有率分析、產業趨勢與統計、成長預測(2026-2031)Biogas - Market Share Analysis, Industry Trends & Statistics, Growth Forecasts (2026 - 2031) |
||||||
※ 本網頁內容可能與最新版本有所差異。詳細情況請與我們聯繫。
2025 年沼氣市場價值為 21.65 吉瓦,預計到 2031 年將達到 28.34 吉瓦,高於 2026 年的 22.64 吉瓦。
預計在預測期(2026-2031 年)內,複合年成長率將達到 4.59%。
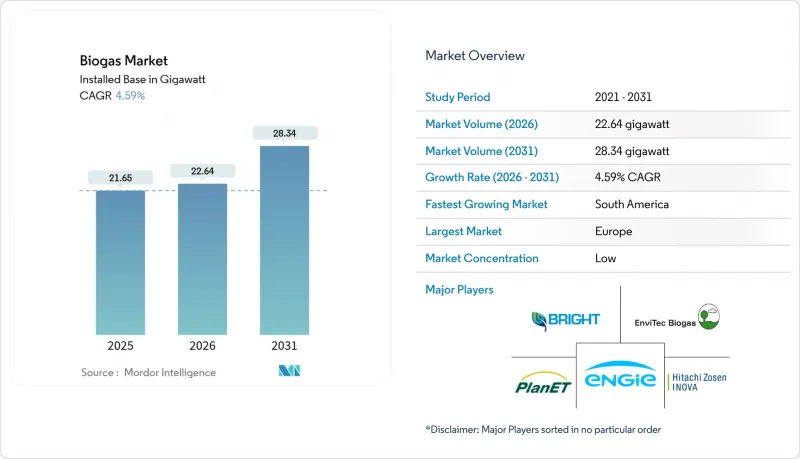
成熟的政策獎勵、從專用電廠向可再生天然氣 (RNG) 升級改造的轉變,以及企業不斷增加脫碳力度,正在重塑投資標準。交通燃料法規認可酪農和食品廢棄物廢棄物的負碳特性,公用事業公司正在整合可客製化的沼氣,以穩定以太陽能和風能為主的電網。歐洲憑藉上網電價補貼 (FIT) 和併網生物甲烷基礎設施保持著先發優勢,但南美洲預計到 2030 年將實現 10% 的複合年成長率,這意味著新的政策框架可能會加速低度開發地區的發展。雖然 0.5 至 2 兆瓦的中型設施仍佔據新增裝置容量的大部分,但在分散式發電激勵措施能夠縮短併網等待時間的地區,0.5 兆瓦以下的區域性電站正在迅速擴張。競爭仍然激烈,像 EnviTec Biogas 這樣的現有整合商透過自籌資金進行擴張來捍衛市場佔有率,而新參與企業則專注於模組化升級和碳捕獲附加元件,以提高產量並獲得優質的上網電價合約。
全球沼氣市場趨勢與洞察
政府支持措施和可再生能源強制規定
基於產量的稅額扣抵正在取代傳統的上網電價補貼,從而延長開發商的收入期限。 2025 年美國沼氣稅收抵免計畫專注於可再生天然氣 (RNG) 升級改造計劃,而非電力銷售。印度的壓縮沼氣計畫透過上網電價補貼支持 5,000 座沼氣廠,而波蘭的 FEnIKS 計畫已撥款 9,300 萬美元歐盟資金以吸引更多資本。這些不斷發展的措施支持分散式沼氣廠,這些沼氣廠能夠創造農村收入、閉合營養循環並穩定電網。
公共產業和企業脫碳目標
公用事業公司目前正在評估沼氣作為一種穩定能源,以填補太陽能發電量下降時出現的晚間用電需求缺口。各公司正在採購可再生天然氣 (RNG),以減少範圍 3 的排放並獲得檢驗的排碳權。加州的負碳排放強度評分使得酪農衍生的 RNG 的交易價格比化石天然氣高出三到四倍,從而提高了計劃的內部收益率。第三方檢驗框架正在推動對具有透明甲烷捕集核算系統的工廠的需求。
與太陽能和風能計劃相比,資本投資更高
安裝成本遠高於大型太陽能發電廠,高達每千瓦3000至5000美元,使得融資條款更加複雜。 EnviTec Biogas透過自籌1億歐元新增300吉瓦時的裝置容量,克服了這個挑戰,實現了小規模開發商難以企及的規模經濟。由於原料價格波動和營運複雜性,貸款方通常要求15%至20%的股權。
細分市場分析
至2025年,畜禽糞便將佔原料供應的37.25%,並構成與農場簽訂長期供應合約的基礎。然而,都市區掩埋禁令政策的實施將使有機廢棄物轉向厭氧消化,食物廢棄物的複合年成長率將達到7.12%。這將為能源收入增加廢棄物處理費收入。農業殘餘物和污水污泥可作為靈活的共消化原料,緩解季節性供需波動。
由於碳氮比平衡,將牲畜糞便和食物廢棄物混合處理的厭氧消化廠通常能實現高達 827 公升/公斤的揮發性固態產量。在地方政府政策的支持下,市政廢棄物收集商正積極尋求與厭氧消化廠建立合作關係,透過簽訂多年期入廠費合約來增強自身的財務狀況。
到2025年,濕式厭氧消化器將佔總裝置容量的59.10%,這反映了其數十年來成熟的供應商系統和較低的資本投入。乾式厭氧消化器到2031年將以7.55%的複合年成長率成長,因為其能夠處理25-35%的固態,且用水量低,使其成為乾旱地區和高固態廢棄物處理的理想選擇。
技術選擇與原料特性密切相關:乾式雙級消化器越來越受青睞,尤其適用於處理家禽糞便、園林廢棄物和預包裝食品廢棄物,因為它可以減少預處理步驟並降低水費。兩級高溫系統可實現高達 43% 的更高能源回收,但只有經驗豐富的操作人員才能承擔先進控制系統帶來的額外成本。因此,沼氣市場正在圍繞各種適用的設計方案競爭,而非單一的主導製程。
沼氣市場報告按原料(農業殘餘物、牲畜糞便、食品和飲料廢棄物等)、製程技術(濕式厭氧消化、乾式厭氧消化、垃圾掩埋沼氣回收)、工廠容量(小於 0.5 MW、0.5-2 MW、大於 2 MW)、應用(發電、供熱、車用燃料/可再生
區域分析
2025年,歐洲將佔據全球65.10%的沼氣市場佔有率,傳統的上網電價補貼政策(FIT)和標準化的生物甲烷注入規範有助於降低貸款方的計劃風險。光是德國就擁有400多座沼氣廠,而歐盟再生能源計畫(REPowerEU)設定的到2030年生物甲烷產量達到350億立方公尺的目標,進一步推動了對管線輸送級天然氣的需求。丹麥是多角化發展的典範:六座沼氣船用燃料廠向航運航線供應液化生物液化天然氣(bio-LNG),在實現廢棄物資源化利用的同時,也符合國際海事組織(IMO)的碳排放法規。
南美洲將迎來最快的成長,到2031年複合年成長率將達到9.45%。巴西國營石油公司Petrobras已發布生物甲烷採購競標,阿根廷的農業廢棄物獎勵政策也促成了2024年82兆瓦生物甲烷計畫的興建。然而,管道連接和信貸風險仍然是規模化發展的障礙,開發商擴大聚集在甘蔗加工廠和肉類加工中心附近,因為這些地方廢棄物豐富且即時收集。
北美正處於一個關鍵的轉折點。到2024年,美國將有超過2500座設施生產每分鐘140萬標準立方英尺(scfm)的沼氣,農業沼氣計劃的產量將首次超過垃圾掩埋沼氣。加拿大效仿加州低碳燃料標準(LCFS)的無污染燃料法規,正在擴大對優質可再生天然氣的需求。在亞太地區,印度計劃在2030年建成5,000座壓縮沼氣廠,並為此設立了需求保障計畫。同時,中國正將沼氣納入農村發展規劃,將沼氣池與併網微電網結合,以促進鄉村電氣化。
其他福利:
- Excel格式的市場預測(ME)表
- 3個月的分析師支持
目錄
第1章 引言
- 研究假設和市場定義
- 調查範圍
第2章調查方法
第3章執行摘要
第4章 市場情勢
- 市場概覽
- 市場促進因素
- 政府支持和可再生能源強制規定
- 公共產業和企業脫碳目標
- 避免掩埋和循環經濟廢棄物指令
- 交通運輸領域對可再生天然氣(RNG)的需求不斷成長
- 將沼渣貨幣化為認證生物肥料
- 聯合消化與污水處理廠的綜效
- 市場限制
- 與太陽能和發電工程相比,資本投資更高
- 農村地區原料物流不完善
- 傳統天然氣價格的波動正在影響可再生天然氣(RNG)的消費。
- 新興市場缺乏電網連接基礎設施
- 供應鏈分析
- 監管環境
- 技術展望
- 波特五力模型
- 供應商的議價能力
- 消費者議價能力
- 新進入者的威脅
- 替代品的威脅
- 競爭對手之間的競爭
第5章 市場規模與成長預測
- 按原料
- 農業殘餘物
- 牲畜糞便
- 污水污泥
- 食物和飲料廢棄物
- 能源作物
- 透過工藝技術
- 濕式厭氧消化
- 乾式厭氧消化
- 掩埋氣回收
- 按工廠產能
- 小於0.5兆瓦
- 0.5~2 MW
- 2兆瓦或以上
- 透過使用
- 發電
- 火力發電
- 汽車燃料/可再生天然氣(RNG)
- 熱電聯產(CHP)
- 按地區
- 北美洲
- 美國
- 加拿大
- 北美其他地區
- 歐洲
- 德國
- 英國
- 義大利
- 法國
- 捷克共和國
- 其他歐洲地區
- 亞太地區
- 中國
- 日本
- 泰國
- 韓國
- 馬來西亞
- 印尼
- 澳洲
- 亞太其他地區
- 南美洲
- 巴西
- 阿根廷
- 智利
- 南美洲其他地區
- 中東和非洲
- 以色列
- 伊朗
- 南非
- 埃及
- 其他中東和非洲地區
- 北美洲
第6章 競爭情勢
- 市場集中度
- 策略性舉措(併購、夥伴關係、購電協議)
- 市場佔有率分析(主要企業的市場排名和佔有率)
- 公司簡介
- Engie SA
- DMT International
- IES Biogas
- EnviTec Biogas AG
- Weltec Biopower GmbH
- Hitachi Zosen Inova AG
- AEV Energy GmbH
- AAT Abwasser-und Abfalltechnik GmbH
- BEKON GmbH
- Nijhuis Saur Industries
- Xebec Adsorption Inc.
- Bright Renewables BV
- Scandinavian Biogas Fuels International AB
- Naskeo Environnement
- PlanET Biogas Group
- BTS Biogas SRL
- BioConstruct GmbH
- Wartsila Corporation
- Greenlane Renewables Inc.
- Clarke Energy
第7章 市場機會與未來展望
The Biogas Market was valued at 21.65 gigawatt in 2025 and estimated to grow from 22.64 gigawatt in 2026 to reach 28.34 gigawatt by 2031, at a CAGR of 4.59% during the forecast period (2026-2031).
Maturing policy incentives, a pivot from power-only plants to renewable natural gas (RNG) upgrading, and rising corporate decarbonization commitments are re-shaping investment criteria. Transport fuel mandates reward the negative-carbon attributes of dairy and food-waste gas, while utilities integrate dispatchable biogas to stabilize solar- and wind-heavy grids. Europe retains first-mover advantage because of feed-in tariffs and grid-ready biomethane infrastructure, but South America's 10% CAGR through 2030 underlines how fresh policy frameworks can accelerate late-entry regions. Mid-scale 0.5-2 MW facilities still dominate capacity additions, yet sub-0.5 MW community plants are scaling quickly where distributed-generation incentives cut connection queues. Competitive intensity remains high: established integrators such as EnviTec Biogas defend their share by self-funding capacity, whereas new entrants focus on modular upgrading and carbon capture add-ons to lift yields and secure premium offtake contracts.
Global Biogas Market Trends and Insights
Supportive Government Incentives & Renewable Energy Mandates
Production-based tax credits are replacing legacy feed-in tariffs, lengthening revenue visibility for developers. The 2025 U.S. biogas credit pivots projects toward RNG upgrading rather than electricity sales. India's Compressed Bio-Gas scheme backs 5,000 plants with fixed offtake, and Poland's FEnIKS program allocates USD 93 million, leveraging European Union funds to crowd-in further capital. These evolving instruments favor distributed plants that unlock rural income, close nutrient loops, and stabilize the grid.
Decarbonization Targets of Utilities & Corporates
Utilities now value biogas as a firming resource that fills evening demand gaps when solar output fades. Corporates procure RNG to cut Scope 3 emissions and lock in verifiable carbon credits. Negative-carbon intensity scores in California let dairy RNG trade at premiums 3-4 times fossil gas, raising project internal rates of return. Third-party verification frameworks elevate demand for plants with transparent methane-capture accounting.
High Capex Relative to Solar & Wind Projects
Installed costs of USD 3,000-5,000/kW outstrip utility-scale solar, complicating debt terms. EnviTec Biogas offsets this by self-funding EUR 100 million to add 300 GWh capacity, capturing economies of scale that smaller developers cannot. Because of feedstock volatility and operational complexity, lenders typically demand 15-20% equity.
Other drivers and restraints analyzed in the detailed report include:
- Landfill Diversion & Circular-Economy Waste Directives
- Rising Demand for Renewable Natural Gas in Transport
- Sub-optimal Feedstock Logistics in Rural Areas
For complete list of drivers and restraints, kindly check the Table Of Contents.
Segment Analysis
Livestock manure delivered 37.25% of feedstock input in 2025 and anchors long-term supply agreements with farms. Yet food-waste volumes expand 7.12% CAGR as cities adopt landfill bans that shift organics toward digesters, adding tipping-fee revenue to energy income. Agricultural residues and sewage sludge are flexible co-digestion recipes that smooth seasonal imbalances.
Digesters blending manure with food scraps regularly hit 827 L/kg volatile solids yields, thanks to balanced C:N ratios. Municipal policy support means urban waste haulers actively seek digester partners, letting operators lock multi-year gate-fee contracts that strengthen balance sheets.
Wet digestion systems owned 59.10% of 2025 installations, reflecting decades-long supplier ecosystems and lower capex. Dry digestion grows 7.55% CAGR to 2031 because it tolerates 25-35% solids and uses less water, ideal for arid locations or high-solids waste.
Technology selection correlates with feedstock profile: poultry litter, yard trimmings, or packaged food waste increasingly favors dry twin-digester lines that cut preprocessing steps and water bills. Two-stage thermophilic setups achieve up to 43% higher energy recovery, yet only sophisticated operators absorb the extra control-system costs. The biogas market, therefore, segments around fit-for-purpose designs rather than a single dominant process.
The Biogas Market Report is Segmented by Feedstock (Agri Residues, Livestock Manure, Food and Beverage Waste, and More), Process Technology (Wet Anaerobic, Dry Anaerobic Digestion, and Landfill Gas Recovery), Plant Capacity (Below 0. 5 MW, 0. 5 To 2 MW, Above 2 MW), Application (Electricity Generation, Heat Generation, Vehicle Fuel/RNG, and More), and Geography (North America, Europe, Asia-Pacific, South America, and More).
Geography Analysis
Europe held 65.10% of the biogas market share 2025 as legacy feed-in tariffs and standardized biomethane injection codes derisk projects for lenders. Germany alone hosts more than 400 plants, and the REPowerEU goal of 35 bcm of biomethane by 2030 further lifts pipeline-quality gas demand. Denmark illustrates diversification: six biogas-to-marine-fuel plants supply liquefied bio-LNG to shipping lanes, marrying waste valorization with IMO carbon rules.
South America records the fastest expansion at 9.45% CAGR through 2031 as Brazil's Petrobras issues biomethane tenders and Argentina adds 82 MW in 2024 under agricultural-waste incentives. However, pipeline access and credit risk still hamper scale-up, so developers often cluster near sugarcane mills or meat-packing hubs where waste is abundant and offtake immediate.
North America stands at an inflection point: over 2,500 U.S. sites generated 1.4 million scfm in 2024, and agricultural projects exceeded landfill gas for the first time. Canada's Clean Fuel Regulations mimic California's LCFS, widening premium RNG catchment. In Asia-Pacific, India targets 5,000 compressed biogas plants by 2030, supported by guaranteed offtake, while China embeds biogas within rural revitalization plans, pairing digesters with grid-connected micro-grids for village electrification.
- Engie SA
- DMT International
- IES Biogas
- EnviTec Biogas AG
- Weltec Biopower GmbH
- Hitachi Zosen Inova AG
- AEV Energy GmbH
- AAT Abwasser- und Abfalltechnik GmbH
- BEKON GmbH
- Nijhuis Saur Industries
- Xebec Adsorption Inc.
- Bright Renewables BV
- Scandinavian Biogas Fuels International AB
- Naskeo Environnement
- PlanET Biogas Group
- BTS Biogas SRL
- BioConstruct GmbH
- Wartsila Corporation
- Greenlane Renewables Inc.
- Clarke Energy
Additional Benefits:
- The market estimate (ME) sheet in Excel format
- 3 months of analyst support
TABLE OF CONTENTS
1 Introduction
- 1.1 Study Assumptions & Market Definition
- 1.2 Scope of the Study
2 Research Methodology
3 Executive Summary
4 Market Landscape
- 4.1 Market Overview
- 4.2 Market Drivers
- 4.2.1 Supportive government incentives & renewable energy mandates
- 4.2.2 Decarbonisation targets of utilities & corporates
- 4.2.3 Landfill diversion & circular-economy waste directives
- 4.2.4 Rising demand for renewable natural gas (RNG) in transport
- 4.2.5 Monetisation of digestate as certified bio-fertiliser
- 4.2.6 Co-digestion synergies with wastewater treatment plants
- 4.3 Market Restraints
- 4.3.1 High capex relative to solar & wind projects
- 4.3.2 Sub-optimal feedstock logistics in rural areas
- 4.3.3 Price volatility of conventional natural gas affecting RNG offtake
- 4.3.4 Limited grid-injection infrastructure in emerging markets
- 4.4 Supply-Chain Analysis
- 4.5 Regulatory Landscape
- 4.6 Technological Outlook
- 4.7 Porter's Five Forces
- 4.7.1 Bargaining Power of Suppliers
- 4.7.2 Bargaining Power of Consumers
- 4.7.3 Threat of New Entrants
- 4.7.4 Threat of Substitutes
- 4.7.5 Intensity of Competitive Rivalry
5 Market Size & Growth Forecasts
- 5.1 By Feedstock
- 5.1.1 Agricultural Residues
- 5.1.2 Livestock Manure
- 5.1.3 Sewage Sludge
- 5.1.4 Food and Beverage Waste
- 5.1.5 Energy Crops
- 5.2 By Process Technology
- 5.2.1 Wet Anaerobic Digestion
- 5.2.2 Dry Anaerobic Digestion
- 5.2.3 Landfill Gas Recovery
- 5.3 By Plant Capacity
- 5.3.1 Below 0.5 MW
- 5.3.2 0.5 to 2 MW
- 5.3.3 Above 2 MW
- 5.4 By Application
- 5.4.1 Electricity Generation
- 5.4.2 Heat Generation
- 5.4.3 Vehicle Fuel/RNG
- 5.4.4 Combined Heat and Power (CHP)
- 5.5 By Geography
- 5.5.1 North America
- 5.5.1.1 United States
- 5.5.1.2 Canada
- 5.5.1.3 Rest of North America
- 5.5.2 Europe
- 5.5.2.1 Germany
- 5.5.2.2 United Kingdom
- 5.5.2.3 Italy
- 5.5.2.4 France
- 5.5.2.5 Czech Republic
- 5.5.2.6 Rest of Europe
- 5.5.3 Asia Pacific
- 5.5.3.1 China
- 5.5.3.2 Japan
- 5.5.3.3 Thailand
- 5.5.3.4 South Korea
- 5.5.3.5 Malaysia
- 5.5.3.6 Indonesia
- 5.5.3.7 Australia
- 5.5.3.8 Rest of Asia Pacific
- 5.5.4 South America
- 5.5.4.1 Brazil
- 5.5.4.2 Argentina
- 5.5.4.3 Chile
- 5.5.4.4 Rest of South America
- 5.5.5 Middle East and Africa
- 5.5.5.1 Israel
- 5.5.5.2 Iran
- 5.5.5.3 South Africa
- 5.5.5.4 Egypt
- 5.5.5.5 Rest of Middle East and Africa
- 5.5.1 North America
6 Competitive Landscape
- 6.1 Market Concentration
- 6.2 Strategic Moves (M&A, Partnerships, PPAs)
- 6.3 Market Share Analysis (Market Rank/Share for key companies)
- 6.4 Company Profiles (includes Global level Overview, Market level overview, Core Segments, Financials as available, Strategic Information, Products & Services, and Recent Developments)
- 6.4.1 Engie SA
- 6.4.2 DMT International
- 6.4.3 IES Biogas
- 6.4.4 EnviTec Biogas AG
- 6.4.5 Weltec Biopower GmbH
- 6.4.6 Hitachi Zosen Inova AG
- 6.4.7 AEV Energy GmbH
- 6.4.8 AAT Abwasser- und Abfalltechnik GmbH
- 6.4.9 BEKON GmbH
- 6.4.10 Nijhuis Saur Industries
- 6.4.11 Xebec Adsorption Inc.
- 6.4.12 Bright Renewables BV
- 6.4.13 Scandinavian Biogas Fuels International AB
- 6.4.14 Naskeo Environnement
- 6.4.15 PlanET Biogas Group
- 6.4.16 BTS Biogas SRL
- 6.4.17 BioConstruct GmbH
- 6.4.18 Wartsila Corporation
- 6.4.19 Greenlane Renewables Inc.
- 6.4.20 Clarke Energy
7 Market Opportunities & Future Outlook
- 7.1 White-space & Unmet-need Assessment
 有機沼氣:市場佔有率分析、產業趨勢與統計、成長預測(2026-2031)
 沼氣提純設備市場-全球產業規模、佔有率、趨勢、機會、預測:按技術、應用、地區和競爭格局分類,2021-2031年
 沼氣發電市場預測至2034年:按原料、技術、應用、最終用戶和地區分類的全球分析
 沼氣市場:依原料、技術、應用和規模分類-2026-2032年全球市場預測沼氣改良市場:技術、解決方案、服務、原料、工廠產能、最終用途-2026-2032年全球預測
 2026年全球廢棄物衍生沼氣市場報告2026年全球沼氣市場報告生質氣化發電系統市場:按原料類型、技術、工廠容量、壓力和最終用戶分類的全球預測,2026-2032年
 2026-2030年全球沼氣市場
 沼氣市場規模、佔有率和成長分析(按原料、來源、技術、應用、最終用途和地區分類)-2026-2033年產業預測