


 |
市場調查報告書
商品編碼
1911470
北美垃圾袋:市佔率分析、產業趨勢與統計、成長預測(2026-2031)North America Trash Bags - Market Share Analysis, Industry Trends & Statistics, Growth Forecasts (2026 - 2031) |
||||||
※ 本網頁內容可能與最新版本有所差異。詳細情況請與我們聯繫。
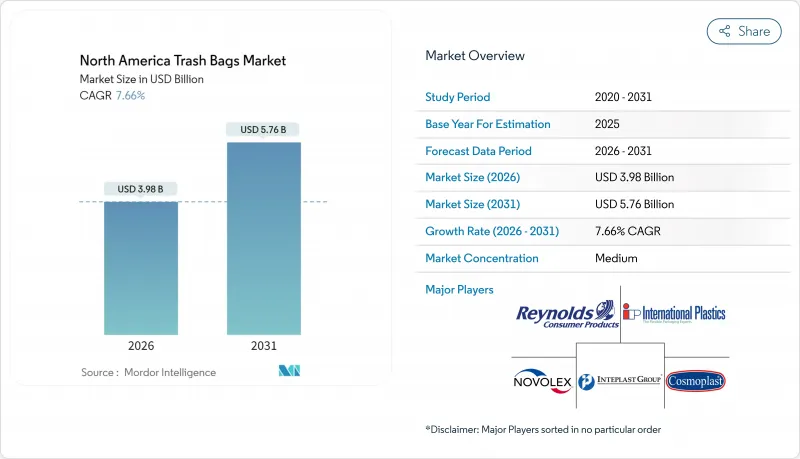
2025年北美垃圾袋市值為37億美元,預計到2031年將達到57.6億美元,高於2026年的39.8億美元。
預計在預測期(2026-2031 年)內,複合年成長率將達到 7.66%。
市政垃圾處理量的持續成長、鼓勵垃圾掩埋的監管獎勵以及企業的零廢棄政策,持續推動住宅、商業和工業領域對垃圾袋的需求。各州實行的按需計量型(PAYT)政策,尤其是在新英格蘭地區,進一步推高了人均垃圾袋購買量。隨著美國七個州實施生產者延伸責任制(EPR)法律,可生物分解和再生材料製成的產品在貨架商店的佔比不斷提高,這推動了消費後再生樹脂的應用。同時,聚乙烯價格的波動迫使生產商實現原料多元化,並透過新的機械回收業務(例如位於印第安納州的Nova-Novolex工廠)來確保供應。品牌商正尋求透過香味產品吸引消費者,而B2B買家則優先考慮能夠承受大量紙板類電商廢棄物的商用內襯袋。
北美垃圾袋市場趨勢與分析
擴大住宅垃圾處理和州立掩埋轉移目標
強制性廢棄物分流政策正在重塑廢棄物收集方式,鼓勵市政當局在公共採購中指定使用經認證的可堆肥或再生材料製成的垃圾袋。加州SB 1383法案使沙加緬度市的有機物回收率提高了14%,同時同期掩埋量減少了10%。加拿大擬議的甲烷排放法規旨在2030年將掩埋排放減少50%,這項目標正促使公共採用符合ASTM D6400標準的有機垃圾袋[CANADA.CA]。這些法規正在推動市政競標數量的成長,尤其是容量為13-30加侖、適合挨家挨戶收集的垃圾袋。
財富500強企業做出零浪費承諾
公司層級的廢棄物分流目標正促使多家門市的採購部門簽訂大型長期合約。 Cox Enterprises 已從掩埋轉移了 7.5 億磅(約 34 萬噸)垃圾,其廢棄物項目的經濟價值估計為 3.4 億美元。 Target 目前在美國 1,680 個地點處理有機廢棄物,營運廢棄物分流率已達 85%。這些項目需要統一的 SKU 規格、透明薄膜分揀袋以及可同時處理食物垃圾和紙板殘渣的工業可堆肥內襯。
聚乙烯和生質塑膠原料價格波動
受墨西哥灣沿岸颶風引發的停工影響,聚乙烯庫存緊張,生產商要求將合約價格提高每磅0.05至0.07美元。受此影響,買家隨即削減庫存至18天,使加工商面臨價格飆升的風險。類似的波動也影響生物聚合物市場。發酵槽的生產依賴玉米和醣類原料,而這些原料的價格也有波動。利潤率的不確定性可能會阻礙對新擠出生產線的資本投資,並延遲創新產品的商業化上市。
細分市場分析
到2025年,北美地區住宅垃圾袋市場仍將佔最大佔有率,達到45.65%。這主要得益於廚房垃圾袋在超市貨架上的持續銷售,而這又得益於上門垃圾收集和計量型(PAYT)定價模式的推廣。然而,從汽車工廠到資料中心園區,工業買家的採購量正以7.88%的複合年成長率持續成長,直到2031年。許多公司都設定了零掩埋目標,因此要求使用更厚的垃圾袋來裝金屬屑、樹脂顆粒和大型包裝材料。供應商合約通常會將顏色編碼的分類垃圾袋、防靜電桶內襯和55加侖的建築垃圾袋捆綁銷售,從而推高了工業垃圾袋的平均售價,使其高於住宅垃圾袋。
工業市場的擴張反映了強勁的建築支出和製造業回流。大型計劃會產生集中的廢棄物,並帶來可預測的托盤大小的訂單,從而降低加工商的物流成本。因此,隨著新工廠運作以及現有設施維修廢棄物分類區以符合環境、社會和治理 (ESG) 指標,預計到 2030 年,北美垃圾袋市場中工業用垃圾袋的佔有率將接近住宅用垃圾袋的佔有率。
由於低密度聚乙烯(LDPE)兼具抗撕裂性和成本效益,預計到2025年其市佔率將維持在41.05%。然而,監管支持正在推動符合ASTM D6400認證標準的塑膠袋的普及,使該細分市場以7.74%的複合年成長率成長。加州SB 1046法案規定,自2025年起,超市結帳前使用的可生物分解塑膠袋直徑必須為15英吋或更大。這促使超級市場連鎖店推出與廚房有機食品袋相容的可生物分解垃圾袋。同時,對機械回收的投資正在提高再生LDPE顆粒的透明度,這有助於在缺乏認證堆肥設施的地區維持消費者對傳統薄膜的接受度。
總體而言,北美垃圾袋市場正朝著雙軌制模式發展:主流的低密度聚乙烯(LDPE)或高密度聚乙烯(HDPE)垃圾袋用於城市廢棄物,而高階可生物分解垃圾袋則用於有機廢棄物,並帶有品牌主導的永續發展訊息。這種產品分化使加工商能夠柔軟性滿足區域監管要求,同時避免原料價格波動所帶來的風險。
其他福利:
- Excel格式的市場預測(ME)表
- 3個月的分析師支持
目錄
第1章 引言
- 研究假設和市場定義
- 調查範圍
第2章調查方法
第3章執行摘要
第4章 市場情勢
- 市場概覽
- 市場促進因素
- 擴大住宅垃圾處理和州立掩埋轉移目標
- 財富 500 強公司設施的零浪費聲明
- 電子商務包裝的快速周轉率導致商業垃圾增加。
- 市政計量型(PAYT)垃圾處理方案正在加速垃圾袋的使用。
- 由於高透明度和再生樹脂含量高(這一領域關注度較低),因此定價較高。
- 醫療保健和食品服務業採用抗菌襯墊(這一趨勢鮮為人知)
- 市場限制
- 揮發性聚乙烯和生質塑膠塑膠原料價格
- 一次性塑膠禁令及生產者延伸責任(EPR)法
- 可重複使用托特包的推出導致零售 SKU 蠶食。
- 透過加強對排放排放的監測,遏制低品質班輪的進口
- 價值/供應鏈分析
- 監管環境
- 技術展望
- 波特五力分析
- 供應商的議價能力
- 買方的議價能力
- 新進入者的威脅
- 替代品的威脅
- 競爭對手之間的競爭
- 調味劑和添加劑配方趨勢
第5章 市場規模與成長預測
- 最終用戶
- 住宅
- 商業
- 產業
- 依產品類型
- 低密度聚乙烯(LDPE)袋
- 高密度聚苯乙烯(HDPE)袋
- 可生物分解/可堆肥袋
- 以體積(加侖)
- 少於 8 加侖(浴室)
- 8至30加侖(廚房用)
- 30至55加侖(建設業)
- 55加侖以上(工業桶內襯)
- 按物質來源
- 原生塑膠
- 再生塑膠
- 混合型(再生+原生)
- 生物基樹脂
- 按銷售管道
- 線下零售(雜貨店、量販店)
- 線上零售
- 清潔及衛生用品/公共事業經銷
- 按國家/地區
- 美國
- 加拿大
第6章 競爭情勢
- 市場集中度
- 策略趨勢
- 市佔率分析
- 公司簡介
- Reynolds Consumer Products Inc.(Hefty)
- The Clorox Company(Glad Products Company)
- Novolex Holdings LLC
- Inteplast Group Corporation
- Riverside Paper Co. Inc.
- Cosmoplast Industrial Company LLC
- International Plastics Inc.
- Poly-America LP
- Four Star Plastics Inc.
- Neway Packaging Corporation
- All American Poly Corp.
- Aluf Plastics Inc.
- Petoskey Plastics Inc.
- Heritage Bag Company
- Crown Poly Inc.
- WasteZero Inc.
- Matrix Packaging LLC
- Elkay Plastics Co. Inc.
- Interplast Packaging LLC
- Super Bag Corp.
- RollPak Corp.
- Boulder Bag Company
第7章 市場機會與未來展望
The North America trash bags market was valued at USD 3.70 billion in 2025 and estimated to grow from USD 3.98 billion in 2026 to reach USD 5.76 billion by 2031, at a CAGR of 7.66% during the forecast period (2026-2031).
Sustained growth in the municipal waste stream, regulatory incentives for landfill diversion, and corporate zero-waste mandates continue to drive demand across residential, commercial, and industrial channels. State pay-as-you-throw (PAYT) schemes, most notably in New England, continue to lift per-capita bag purchase. Biodegradable and recycled-content products are gaining shelf space as seven U.S. states roll out extended producer responsibility (EPR) laws that incentivize the adoption of post-consumer resin. At the same time, polyethylene price volatility has forced producers to diversify their feedstocks and secure supply through new mechanical recycling ventures, including the Nova-Novolex plant in Indiana. Brand owners are courting consumers with scent-infused SKUs, while B2B buyers prioritize contractor-grade liners that withstand heavy, cardboard-rich e-commerce refuse.
North America Trash Bags Market Trends and Insights
Residential Waste-Stream Expansion and State Landfill-Diversion Targets
Mandatory diversion policies are reshaping waste collection norms, prompting municipalities to specify certified compostable or recycled-content liners in public procurement. California's SB 1383 has already increased organic recycling tonnage by 14% in Sacramento, while landfill inputs fell by 10% during the same period. Canada's draft methane rule aims for a 50% reduction in landfill emissions by 2030, a goal that encourages public facilities to adopt ASTM D6400-compliant organics bags [CANADA.CA]. Such rules keep municipal bid volumes growing, particularly for 13-30 gallon liners that fit curbside carts
Corporate Zero-Waste Pledges from Fortune 500 Facilities
Enterprise-wide diversion targets are converting multi-site buyers into large, long-term accounts. Cox Enterprises has diverted 750 million lb from landfill and credited waste programs with USD 340 million in financial value. Target now processes organics at 1,680 U.S. locations and has already reached 85% operational diversion. These programs demand consistent SKU specifications, clear-film sortation bags, and industrial compostable liners that can handle food scraps and corrugated offcuts simultaneously.
Volatile Polyethylene and Bioplastic Feedstock Prices
Polyethylene spot values fell 11.95% year-on-year in 2025 after hurricane-linked outages on the Gulf Coast squeezed inventories before producers pushed a USD 0.05-0.07-per-lb contract hike. Buyers responded by trimming stock cover to 18 days, leaving converters exposed to price spikes. Similar volatility affects biopolymer markets, where fermenter output depends on corn and sugar feedstocks, which have their own price fluctuations. Margin uncertainty hinders capital investment in new extrusion lines and can delay the commercial launch of innovative SKUs.
Other drivers and restraints analyzed in the detailed report include:
- Rapid E-Commerce Packaging Turnover Elevating Commercial Trash Volume
- Municipal Pay-As-You-Throw Programs Accelerating Bag Consumption
- Single-Use-Plastic Bans and Extended-Producer-Responsibility Laws
For complete list of drivers and restraints, kindly check the Table Of Contents.
Segment Analysis
The residential channel still accounts for the largest slice of the North America trash bags market size, posting 45.65% share in 2025 as curbside collection and PAYT schemes keep kitchen liners moving through grocery aisles. Yet, industrial buyers, from automotive plants to data center campuses, are ramping up purchases at a 7.88% CAGR through 2031. Many are locked into zero-landfill targets that necessitate heavier-gauge liners rated for metal shavings, resin pellets, or bulky packaging. Supplier contracts often bundle color-coded segregation bags, anti-static drum liners, and 55-gallon builders' sacks, boosting average selling price relative to household SKUs.
Industrial volume gains reflect healthy construction spending and the onshoring of manufacturing. Large projects generate concentrated waste nodes, creating predictable, pallet-level orders that shave logistics costs for converters. The North America trash bags market share for industrial applications is therefore expected to approach the residential share by decade-end as new plants come online and legacy facilities retrofit waste-sorting zones to meet ESG metrics.
LDPE retained 41.05% revenue share in 2025 thanks to its balance of tear resistance and cost efficiency. However, legislative tailwinds are sending ASTM D6400-certified bags up the adoption curve, with the sub-category tracking a 7.74% CAGR. California's SB 1046 requires compostable pre-checkout bags with a minimum 15-inch mouth width, effective starting in 2025. Echo effects include supermarket chains sourcing matching compostable trash liners for back-of-house organics totes. At the same time, mechanical-recycling investments are improving the clarity of recycled LDPE pellets, helping traditional film retain customer loyalty where certified composting facilities remain scarce.
Overall, the North America trash bags market is shifting toward a dual-portfolio model, featuring mainstream LDPE or HDPE for general refuse and premium-priced biodegradable options for organics, as well as brand-led sustainability messaging. This bifurcation provides converters with the flexibility to hedge against feedstock swings while meeting regional compliance requirements.
The North America Trash Bags Market Report is Segmented by End User (Residential, Commercial, Industrial), Product Type (LDPE Bags, HDPE Bags and More), Capacity (< 8 Gal, 8-30 Gal, 30-55 Gal, > 55 Gal), Material Source (Virgin Plastic, Post-Consumer Recycled Plastic, Hybrid, Bio-Based Resins), Sales Channel (Offline Retail, and More), and Geography (United States, Canada). The Market Forecasts are Provided in Terms of Value (USD).
List of Companies Covered in this Report:
- Reynolds Consumer Products Inc. (Hefty)
- The Clorox Company (Glad Products Company)
- Novolex Holdings LLC
- Inteplast Group Corporation
- Riverside Paper Co. Inc.
- Cosmoplast Industrial Company LLC
- International Plastics Inc.
- Poly-America L.P.
- Four Star Plastics Inc.
- Neway Packaging Corporation
- All American Poly Corp.
- Aluf Plastics Inc.
- Petoskey Plastics Inc.
- Heritage Bag Company
- Crown Poly Inc.
- WasteZero Inc.
- Matrix Packaging LLC
- Elkay Plastics Co. Inc.
- Interplast Packaging LLC
- Super Bag Corp.
- RollPak Corp.
- Boulder Bag Company
Additional Benefits:
- The market estimate (ME) sheet in Excel format
- 3 months of analyst support
TABLE OF CONTENTS
1 INTRODUCTION
- 1.1 Study Assumptions and Market Definition
- 1.2 Scope of the Study
2 RESEARCH METHODOLOGY
3 EXECUTIVE SUMMARY
4 MARKET LANDSCAPE
- 4.1 Market Overview
- 4.2 Market Drivers
- 4.2.1 Residential waste-stream expansion and state landfill-diversion targets
- 4.2.2 Corporate zero-waste pledges from Fortune 500 facilities
- 4.2.3 Rapid e-commerce packaging turnover elevating commercial trash volume
- 4.2.4 Municipal pay-as-you-throw (PAYT) programs accelerating bag consumption
- 4.2.5 High-clarity, recycled-content resins enabling premium pricing (under-the-radar)
- 4.2.6 Adoption of anti-microbial liners in healthcare and foodservice (under-the-radar)
- 4.3 Market Restraints
- 4.3.1 Volatile polyethylene and bioplastic feedstock prices
- 4.3.2 Single-use-plastic bans and extended-producer-responsibility (EPR) laws
- 4.3.3 Retail SKU cannibalization from reusable tote initiatives
- 4.3.4 Logistics emissions scrutiny curbing import of low-grade liners
- 4.4 Value / Supply-Chain Analysis
- 4.5 Regulatory Landscape
- 4.6 Technological Outlook
- 4.7 Porter's Five Forces Analysis
- 4.7.1 Bargaining Power of Suppliers
- 4.7.2 Bargaining Power of Buyers
- 4.7.3 Threat of New Entrants
- 4.7.4 Threat of Substitutes
- 4.7.5 Intensity of Competitive Rivalry
- 4.8 Fragrance and additive formulation trends
5 MARKET SIZE AND GROWTH FORECASTS (VALUE)
- 5.1 By End User
- 5.1.1 Residential
- 5.1.2 Commercial
- 5.1.3 Industrial
- 5.2 By Product Type
- 5.2.1 Low-Density Polyethylene (LDPE) Bags
- 5.2.2 High-Density Polyethylene (HDPE) Bags
- 5.2.3 Biodegradable / Compostable Bags
- 5.3 By Capacity (Gallons)
- 5.3.1 < 8 Gal (Bathroom)
- 5.3.2 8 - 30 Gal (Kitchen)
- 5.3.3 30 - 55 Gal (Contractor)
- 5.3.4 > 55 Gal (Industrial Drum Liners)
- 5.4 By Material Source
- 5.4.1 Virgin Plastic
- 5.4.2 Post-Consumer Recycled Plastic
- 5.4.3 Hybrid (Recycled + Virgin)
- 5.4.4 Bio-based Resins
- 5.5 By Sales Channel
- 5.5.1 Offline Retail (Grocery, Mass Merchandiser)
- 5.5.2 Online Retail
- 5.5.3 Jan-San / Institutional Distribution
- 5.6 By Country
- 5.6.1 United States
- 5.6.2 Canada
6 COMPETITIVE LANDSCAPE
- 6.1 Market Concentration
- 6.2 Strategic Moves
- 6.3 Market Share Analysis
- 6.4 Company Profiles (includes Global level Overview, Market level overview, Core Segments, Financials as available, Strategic Information, Market Rank/Share for key companies, Products and Services, and Recent Developments)
- 6.4.1 Reynolds Consumer Products Inc. (Hefty)
- 6.4.2 The Clorox Company (Glad Products Company)
- 6.4.3 Novolex Holdings LLC
- 6.4.4 Inteplast Group Corporation
- 6.4.5 Riverside Paper Co. Inc.
- 6.4.6 Cosmoplast Industrial Company LLC
- 6.4.7 International Plastics Inc.
- 6.4.8 Poly-America L.P.
- 6.4.9 Four Star Plastics Inc.
- 6.4.10 Neway Packaging Corporation
- 6.4.11 All American Poly Corp.
- 6.4.12 Aluf Plastics Inc.
- 6.4.13 Petoskey Plastics Inc.
- 6.4.14 Heritage Bag Company
- 6.4.15 Crown Poly Inc.
- 6.4.16 WasteZero Inc.
- 6.4.17 Matrix Packaging LLC
- 6.4.18 Elkay Plastics Co. Inc.
- 6.4.19 Interplast Packaging LLC
- 6.4.20 Super Bag Corp.
- 6.4.21 RollPak Corp.
- 6.4.22 Boulder Bag Company
7 MARKET OPPORTUNITIES AND FUTURE OUTLOOK
- 7.1 White-space and Unmet-Need Assessment
 一次性垃圾袋市場:依材質、厚度、尺寸、封口方式、應用和分銷管道分類-2026-2032年全球市場預測垃圾袋市場:產品類型、材質、厚度、顏色、通路、應用、最終用途-2026-2032年全球市場預測
 垃圾袋市場報告:按類型、材質、尺寸、分銷管道、最終用戶和地區分類(2026-2034 年)
 垃圾袋:市佔率分析、產業趨勢與統計、成長預測(2026-2031)
 全球垃圾袋市場規模、佔有率、趨勢和成長分析報告(2026-2034年)
 2026年全球垃圾袋市場報告汽車垃圾袋市場按類型、分銷管道、材料、最終用戶和銷售分類-全球預測(2026-2032 年)
 垃圾袋市場規模、佔有率和成長分析(按材料、類型和地區分類)-2026-2033年產業預測
 戶外垃圾桶市場-全球產業規模、佔有率、趨勢、機會和預測,按產品類型(腳踏式垃圾桶、感應式垃圾桶、其他)、應用領域(住宅、商業)、地區和競爭格局分類,2020-2030年預測
 垃圾袋的全球市場:材料類型·產品類型·容量·終端用戶產業·流通管道·各地區 (~2035年)