


 |
市場調查報告書
商品編碼
1939055
電信分析:市場佔有率分析、產業趨勢與統計、成長預測(2026-2031)Telecom Analytics - Market Share Analysis, Industry Trends & Statistics, Growth Forecasts (2026 - 2031) |
||||||
※ 本網頁內容可能與最新版本有所差異。詳細情況請與我們聯繫。
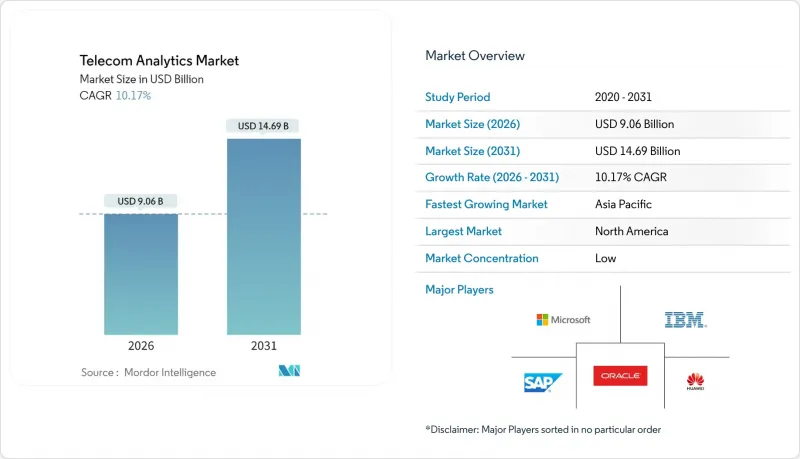
2025 年電信分析市場價值為 82.2 億美元,預計到 2031 年將達到 146.9 億美元,高於 2026 年的 90.6 億美元。
預計在預測期(2026-2031 年)內,複合年成長率將達到 10.17%。
這一強勁的成長勢頭得益於5G的穩步部署、人工智慧工具包的快速成熟以及詐欺成本的不斷攀升,這些因素都在推動通訊業者向預測性和即時分析轉型。雲端原生架構如今已成為大多數大規模部署的基礎,而邊緣節點在對延遲高度敏感的應用場景(例如私人5G和大規模物聯網)中發揮關鍵作用。網路供應商、超大規模資料中心超大規模資料中心業者和細分領域的專業廠商正在加劇競爭,力求將生成式人工智慧、自動化模型生命週期管理和基於切片的儀表板等功能整合到各自的產品中。同時,通訊業者正將重點從資本密集的軟體投資轉向以結果為導向的分析服務,這些服務有望帶來可衡量的解約率降低和收入保障。
全球電信分析市場趨勢與洞察
快速部署 5G 推動了網路分析技術的應用
獨立組網的5G部署正在推動資料量和效能變數的激增,迫使營運商部署頻譜、切片感知的分析引擎,以最佳化頻譜、功率和服務品質。預計到2028年,中國的5G普及率將達到88%,屆時該地區將成為全球最大的網路遙測資料來源地。切片專屬的儀錶板能夠確保企業應用場景的確定性延遲和吞吐量,釋放高達2000億美元的商業潛力。邊緣運算節點的出現帶來了新的複雜性,因為遙測資料現在來自多個層級,每個層級都需要毫秒級的洞察。在亞太地區,這些需求正推動電信分析市場以13.26%的複合年成長率快速成長,國營通訊業者競相為工業4.0提供超可靠的服務。
更容易遭受詐欺
到2024年,電信詐騙的損失將飆升至398.9億美元,佔全球通訊業者收入的2.22%。詐騙如今正利用人工智慧技術自動實施SIM卡交換、合約詐欺和漫遊漏洞利用,暴露了傳統規則引擎的限制。這通訊業者轉向基於圖的分析和自學習異常檢測系統,以近乎即時的方式融合通話詳細記錄(CDR)、信令數據和客戶畫像。在新興市場,用戶的快速成長超過了反詐騙投入,因此詐欺分析已成為採購計畫中的重中之重。產業研究表明,儘管數據標註仍然是一項挑戰,但83%的反詐騙團隊計劃在2025年前採用生成式人工智慧。
資料隱私和跨境傳輸限制
隨著資料保護法規網路的日益收窄,全球分析基礎設施正變得日益碎片化。 GDPR、印度的《數位個人資訊保護法》以及中國的《個人資訊保護法》均規定了本地處理義務,迫使營運商複製基礎設施並採用隱私納入設計控制措施。跨國通訊服務提供者(CSP)在跨境傳輸用戶記錄之前必須對其進行加密、令牌化或匿名化處理,這會增加延遲並降低模型準確性。合規負擔在亞太地區尤其沉重,因為不同的國家法律要求每個市場都必須制定客製化的安全方案。
細分市場分析
欺詐管理分析是成長最快的細分市場,複合年成長率高達16.90%,這主要受產業損失的影響,預計到2024年,詐欺造成的損失將超過398.9億美元。這些平台將圖分析與深度學習引擎結合,可在數秒內識別可疑的通話詳細記錄和漫遊模式,使營運商能夠在詐欺流量造成收入損失之前將其凍結。然而,客戶分析仍將保持主導地位,預計到2025年將佔據36.24%的市場佔有率,因為通訊業者正在加強個人化客戶維繫宣傳活動、客戶流失預測模型和客戶生命週期價值評分。
網路分析是自主切片編配的基礎,它將關鍵績效指標 (KPI) 預測結果回饋到封閉回路型控制設備,以避免網路擁塞並提升 5G 體驗的一致性。隨著通訊業者將即時體驗評分發佈到企業儀錶板,服務品質和體驗分析的重要性日益凸顯,這對於製造業、採礦業和醫療保健等行業實現服務等級協議 (SLA) 的貨幣化至關重要。行銷和銷售分析應用趨勢建模來提升宣傳活動報酬率 (ROI),而定價和收入管理分析則最佳化了套餐組合和動態折扣。應用層工具實現了全面的跨域視覺性,為零接觸營運奠定了基礎。
邊緣和混合配置將以 21.92% 的複合年成長率成長,主要受關鍵業務垂直行業(如港口、工廠和公共產業)的驅動,這些行業需要低於 10 毫秒的洞察循環。通訊業者現在將輕量級推理引擎嵌入基頻單元和本地邊緣節點,以執行延遲預算和資料主權規則。即使到了 2025 年,雲端模式仍將佔據電信分析市場 65.45% 的佔有率,用於託管 CPU 密集型訓練作業和長週期批量分析。
混合設計融合了兩者的優勢:雲爆發可以處理可變工作負載,而邊緣站點則執行異常警報等確定性任務。在監管嚴格的地區以及傳統BSS/OSS系統遷移困難的地區,本地部署仍將持續。隨著5G Advanced和6G藍圖的逐步成型,供應商正在將多叢集監控功能、聯合身分和自動化策略部署整合到配置範本中,以簡化計算域之間的遷移。
區域分析
北美將在2025年佔據電信分析市場34.55%的佔有率,這主要得益於5G早期商業化進程的推進以及企業對專用網路的需求。美國通訊業者正利用其在5G領域的私有投資(預計到2027年將超過37億美元),為製造業、醫療保健和國防等產業量身訂做網路即服務(NaaS)產品,並融入分析技術。此外,諸如T-Mobile收購光纖業務等整合舉措,也推動了分析技術的投資,以整合固定和行動網路的品質指標。
亞太地區是成長最快的地區,複合年成長率高達13.06%,這主要得益於中國積極的部署藍圖和印度的快速數位化。該地區的行動業務收益預計將從2023年的3,219億美元成長到2028年的3,887億美元,因此,將流量轉化為營收的關鍵在於運用分析技術。隨著世界各國政府大力推動本土人工智慧框架的建設,通訊業者被迫採用聯邦學習模型,雖然將原始資料保留在本地,但模型權重在全球共用。
在歐洲,GDPR持續推動對隱私增強技術和混合部署的需求,並保持穩定成長。通訊業者被要求證明審核和即時違規檢測能力,這促使分析供應商將同意管理和資料沿襲追蹤功能整合到系統中。
中東/非洲和南美洲的絕對交易量落後,但隨著新的 5G 部署繞過傳統的 OSS 並直接轉向雲原生分析堆疊,這些地區展現出成長潛力。
其他福利:
- Excel格式的市場預測(ME)表
- 分析師支持(3個月)
目錄
第1章 引言
- 研究假設和市場定義
- 調查範圍
第2章調查方法
第3章執行摘要
第4章 市場情勢
- 市場概覽
- 市場促進因素
- 降低客戶流失率的需求日益成長。
- 更容易遭受詐欺
- 快速部署 5G 推動了網路分析技術的應用
- 通訊業者加速採用雲端原生分析技術
- 私有 5G 網路的網路切片分析的興起
- 人工智慧驅動的零接觸操作催生了對封閉回路型分析的需求。
- 市場限制
- 通訊業者缺乏意識
- 資料隱私和跨境傳輸限制
- 頻譜競標會增加營運成本 (OPEX) 並抑制現場投資。
- 缺乏針對特定通訊業者的AI模型標註資料集
- 產業價值鏈分析
- 監管環境
- 技術展望
- 波特五力分析
- 新進入者的威脅
- 買方的議價能力
- 供應商的議價能力
- 替代品的威脅
- 競爭對手之間的競爭
- 疫情影響評估
第5章 市場規模與成長預測
- 透過使用
- 客戶分析
- 網路分析
- 行銷與銷售分析
- 定價和收益管理分析
- 服務品質與客戶體驗分析
- 欺詐管理分析
- 其他用途
- 透過部署
- 雲
- 本地部署
- 邊緣/混合
- 按組件
- 軟體
- 服務
- 專業服務
- 託管服務
- 最終用戶公司規模
- 中小企業
- 主要企業
- 通訊業者類型
- 行動網路營運商(MNO)
- 固定通訊業者
- 網際服務供應商(ISP)
- 行動虛擬網路營運商(MVNO)
- 綜合通訊業者
- 按地區
- 北美洲
- 美國
- 加拿大
- 墨西哥
- 南美洲
- 巴西
- 阿根廷
- 哥倫比亞
- 其他南美洲
- 歐洲
- 英國
- 德國
- 法國
- 西班牙
- 義大利
- 俄羅斯
- 其他歐洲地區
- 亞太地區
- 中國
- 印度
- 日本
- 韓國
- 澳洲
- 東南亞
- 亞太其他地區
- 中東和非洲
- 中東
- 沙烏地阿拉伯
- 阿拉伯聯合大公國
- 土耳其
- 其他中東地區
- 非洲
- 南非
- 奈及利亞
- 肯亞
- 其他非洲地區
- 中東
- 北美洲
第6章 競爭情勢
- 市場集中度
- 策略趨勢
- 市佔率分析
- 公司簡介
- Accenture plc
- Amdocs Inc.
- Cisco Systems, Inc.
- Dell Inc.
- Ericsson AB
- Guavus, Inc.
- Huawei Technologies Co., Ltd.
- IBM Corporation
- InfoFaces, Inc.
- Microsoft Corporation
- Nokia Corporation
- Oracle Corporation
- SAS Institute Inc.
- SAP SE
- Subex Limited
- TEOCO Corporation
- Teradata Corporation
- Wipro Limited
- ZTE Corporation
- Mu Sigma, Inc.
第7章 市場機會與未來展望
The telecom analytics market was valued at USD 8.22 billion in 2025 and estimated to grow from USD 9.06 billion in 2026 to reach USD 14.69 billion by 2031, at a CAGR of 10.17% during the forecast period (2026-2031).
This robust trajectory is propelled by relentless 5G roll-outs, fast-maturing AI toolkits, and the rising cost of fraud, each of which is nudging operators toward predictive, real-time analytics. Cloud-native architectures now underpin most large deployments, while edge nodes are assuming a pivotal role in latency-sensitive use cases such as private 5G and massive IoT. Competition is intensifying as network vendors, hyperscalers, and niche specialists race to embed generative AI, automated model lifecycle management, and slice-aware dashboards into their offers. At the same time, operators are shifting focus from capital-intensive software investments to outcome-based analytics services that guarantee measurable churn reduction and revenue assurance
Global Telecom Analytics Market Trends and Insights
Rapid 5G Deployment Spurring Network Analytics Adoption
Standalone 5G roll-outs are magnifying data volumes and performance variables, compelling operators to adopt real-time slice-aware analytics engines that optimize spectrum, power, and quality of service. China is on track for 88% 5G penetration by 2028, turning the region into the largest single source of network telemetry. Slice-specific dashboards unlock a USD 200 billion monetization pool by guaranteeing deterministic latency and throughput for enterprise use cases. Edge compute nodes add fresh complexity because telemetry now arrives from multiple hierarchy layers, each demanding millisecond-level insight. In Asia-Pacific, these requirements underpin a 13.26% CAGR in Telecom Analytics market adoption as state-owned carriers race to deliver ultra-reliable services for Industry 4.0.
Increasing Vulnerability to Fraudulent Activities
Telecom fraud losses ballooned to USD 39.89 billion in 2024, equivalent to 2.22% of global operator revenue . Fraud rings now weaponize AI to automate SIM-swap, subscription, and roaming exploits, exhausting the cAsia Pacificity of legacy rule engines. Operators therefore pivot to graph-based analytics and self-learning anomaly detectors that fuse CDRs, signaling data, and customer profiles in near real time. Emerging markets bear the brunt because rapid subscriber growth outpaces fraud-mitigation investment, pushing fraud-centric analytics to the top of procurement roadmaps. A recent industry poll shows 83% of fraud teams intend to deploy generative AI by 2025, even though poor data labeling remains a hurdle.
Data Privacy and Cross-Border Transfer Restrictions
A tightening web of data-protection rules is splintering global analytics footprints. GDPR, India's Digital Personal Data Protection Act, and China's PIPL each impose local-processing mandates that force operators to duplicate infrastructure and embed privacy-by-design controls. Multinational CSPs must encrypt, tokenize, or anonymize subscriber records before moving them across borders, adding latency and diluting model accuracy. The compliance burden is most acute in Asia Pacific, where divergent national laws require bespoke security blueprints for every market.
Other drivers and restraints analyzed in the detailed report include:
- AI-Driven Zero-Touch Operations Creating Closed-Loop Analytics Demand
- Accelerated Adoption of Cloud-Native Analytics by Telcos
- Scarcity of Telco-Specific Labeled Datasets for AI Models
For complete list of drivers and restraints, kindly check the Table Of Contents.
Segment Analysis
Fraud Management Analytics has become the fastest-expanding segment, growing at a 16.90% CAGR on the back of industry losses that exceeded USD 39.89 billion in 2024. These platforms blend graph analytics and deep-learning engines to pinpoint suspicious call-detail records and roaming patterns within seconds, enabling operators to freeze illicit traffic before revenue leakage occurs. Customer Analytics nevertheless retains leadership with 36.24% of the Telecom Analytics market in 2025 as carriers intensify personalized retention campaigns, churn-prediction models, and lifetime-value scoring.
Network Analytics underpins autonomous slice orchestration, feeding closed-loop controllers with KPI forecasts that avert congestion and improve 5G experience consistency. Service-Quality and Experience Analytics is gaining ground as operators publish real-time experience scores to enterprise dashboards, a prerequisite for monetizing SLAs in manufacturing, mining, and healthcare. Marketing and Sales Analytics applies propensity modeling to boost campaign ROI, while Pricing and Revenue-Management Analytics optimizes tariff bundling and dynamic discounting. Collectively, application-layer tools propel cross-domain visibility, a prerequisite for zero-touch operations.
Edge and hybrid configurations are registering a 21.92% CAGR due to mission-critical verticals ports, factories, and utilities demanding sub-10 millisecond insight loops. Operators now embed lightweight inference engines at base-band units and on-prem edge nodes to enforce latency budgets and data-sovereignty rules. The cloud model still controlled 65.45% of the Telecom Analytics market in 2025 by hosting CPU-hungry training jobs and long-cycle batch analytics.
Hybrid blueprints marry the two worlds: cloud bursting handles volatile workloads, while edge sites execute deterministic tasks like anomaly alarms. On-prem deployments persist in heavily regulated jurisdictions or where legacy BSS/OSS systems resist migration. As 5G Advanced and 6G roadmaps unfold, vendors are baking multi-cluster observability, federated identity, and automated policy rollout into deployment templates, making it easier to pivot between compute domains.
The Telecom Analytics Market Report is Segmented by Application (Customer, Network Analytics, and More), Deployment (Cloud and More), Component (Software, Services), End-User Enterprise Size (Small and Medium Enterprises, Large Enterprises), Telecom Operator Type (Mobile Network Operators, Fixed-Line Operators, and More), and Geography (North America, Europe, and More). The Market Forecasts are Provided in Terms of Value (USD).
Geography Analysis
North America dominated the Telecom Analytics market with 34.55% share in 2025, buoyed by early 5G monetization and enterprise-grade private-network demand. The U.S. carriers are leveraging analytics to orchestrate network-as-a-service offers for manufacturing, healthcare, and defense, capitalizing on a private-5G spend that will surpass USD 3.7 billion by 2027. Consolidation moves such as T-Mobile's fiber acquisitions are also stoking analytics investment to integrate fixed and mobile quality metrics.
Asia-Pacific is the fastest-growing region at 13.06% CAGR, led by China's aggressive deployment roadmap and India's rapid digitalization. The region's mobile-services revenue could climb from USD 321.9 billion in 2023 to USD 388.7 billion in 2028, and analytics is crucial for converting that traffic into profit. Governments are championing indigenous AI frameworks, prompting operators to adopt federated-learning models that keep raw data local while sharing model weights globally.
Europe maintains steady expansion as GDPR drives demand for privacy-enhancing technologies and hybrid deployments. Operators must demonstrate auditability and real-time breach detection, pushing analytics vendors to incorporate consent management and lineage tracking.
Middle East and Africa and South America trail in absolute size but show upside as green-field 5G launches bypass legacy OSS and leapfrog directly to cloud-native analytics stacks.
- Accenture plc
- Amdocs Inc.
- Cisco Systems, Inc.
- Dell Inc.
- Ericsson AB
- Guavus, Inc.
- Huawei Technologies Co., Ltd.
- IBM Corporation
- InfoFaces, Inc.
- Microsoft Corporation
- Nokia Corporation
- Oracle Corporation
- SAS Institute Inc.
- SAP SE
- Subex Limited
- TEOCO Corporation
- Teradata Corporation
- Wipro Limited
- ZTE Corporation
- Mu Sigma, Inc.
Additional Benefits:
- The market estimate (ME) sheet in Excel format
- 3 months of analyst support
TABLE OF CONTENTS
1 INTRODUCTION
- 1.1 Study Assumptions and Market Definition
- 1.2 Scope of the Study
2 RESEARCH METHODOLOGY
3 EXECUTIVE SUMMARY
4 MARKET LANDSCAPE
- 4.1 Market Overview
- 4.2 Market Drivers
- 4.2.1 Surge in need for churn reduction
- 4.2.2 Increasing vulnerability to fraudulent activities
- 4.2.3 Rapid 5G deployment spurring network analytics adoption
- 4.2.4 Accelerated adoption of cloud-native analytics by telcos
- 4.2.5 Emergence of network slicing analytics for private 5G networks
- 4.2.6 AI-driven zero-touch operations creating closed-loop analytics demand
- 4.3 Market Restraints
- 4.3.1 Lack of awareness among telecom operators
- 4.3.2 Data privacy and cross-border transfer restrictions
- 4.3.3 OPEX strain from spectrum auctions curbing on-prem investments
- 4.3.4 Scarcity of telco-specific labelled datasets for AI models
- 4.4 Industry Value-Chain Analysis
- 4.5 Regulatory Landscape
- 4.6 Technological Outlook
- 4.7 Porter's Five Forces Analysis
- 4.7.1 Threat of New Entrants
- 4.7.2 Bargaining Power of Buyers
- 4.7.3 Bargaining Power of Suppliers
- 4.7.4 Threat of Substitutes
- 4.7.5 Competitive Rivalry
- 4.8 Pandemic Impact Review
5 MARKET SIZE AND GROWTH FORECASTS (VALUE)
- 5.1 By Application
- 5.1.1 Customer Analytics
- 5.1.2 Network Analytics
- 5.1.3 Marketing and Sales Analytics
- 5.1.4 Pricing and Revenue-Management Analytics
- 5.1.5 Service Quality and Experience Analytics
- 5.1.6 Fraud Management Analytics
- 5.1.7 Other Application
- 5.2 By Deployment
- 5.2.1 Cloud
- 5.2.2 On-premises
- 5.2.3 Edge / Hybrid
- 5.3 By Component
- 5.3.1 Software
- 5.3.2 Services
- 5.3.2.1 Professional Services
- 5.3.2.2 Managed Services
- 5.4 By End-User Enterprise Size
- 5.4.1 Small and Medium Enterprises (SMEs)
- 5.4.2 Large Enterprises
- 5.5 By Telecom Operator Type
- 5.5.1 Mobile Network Operators (MNOs)
- 5.5.2 Fixed-line Operators
- 5.5.3 Internet Service Providers (ISPs)
- 5.5.4 Mobile Virtual Network Operators (MVNOs)
- 5.5.5 Converged Operators
- 5.6 By Geography
- 5.6.1 North America
- 5.6.1.1 United States
- 5.6.1.2 Canada
- 5.6.1.3 Mexico
- 5.6.2 South America
- 5.6.2.1 Brazil
- 5.6.2.2 Argentina
- 5.6.2.3 Colombia
- 5.6.2.4 Rest of South America
- 5.6.3 Europe
- 5.6.3.1 United Kingdom
- 5.6.3.2 Germany
- 5.6.3.3 France
- 5.6.3.4 Spain
- 5.6.3.5 Italy
- 5.6.3.6 Russia
- 5.6.3.7 Rest of Europe
- 5.6.4 Asia Pacific
- 5.6.4.1 China
- 5.6.4.2 India
- 5.6.4.3 Japan
- 5.6.4.4 South Korea
- 5.6.4.5 Australia
- 5.6.4.6 Southeast Asia
- 5.6.4.7 Rest of Asia Pacific
- 5.6.5 Middle East and Africa
- 5.6.5.1 Middle East
- 5.6.5.1.1 Saudi Arabia
- 5.6.5.1.2 United Arab Emirates
- 5.6.5.1.3 Turkey
- 5.6.5.1.4 Rest of Middle East
- 5.6.5.2 Africa
- 5.6.5.2.1 South Africa
- 5.6.5.2.2 Nigeria
- 5.6.5.2.3 Kenya
- 5.6.5.2.4 Rest of Africa
- 5.6.5.1 Middle East
- 5.6.1 North America
6 COMPETITIVE LANDSCAPE
- 6.1 Market Concentration
- 6.2 Strategic Moves
- 6.3 Market Share Analysis
- 6.4 Company Profiles {(includes Global level Overview, Market level overview, Core Segments, Financials as available, Strategic Information, Market Rank/Share for key companies, Products and Services, and Recent Developments)}
- 6.4.1 Accenture plc
- 6.4.2 Amdocs Inc.
- 6.4.3 Cisco Systems, Inc.
- 6.4.4 Dell Inc.
- 6.4.5 Ericsson AB
- 6.4.6 Guavus, Inc.
- 6.4.7 Huawei Technologies Co., Ltd.
- 6.4.8 IBM Corporation
- 6.4.9 InfoFaces, Inc.
- 6.4.10 Microsoft Corporation
- 6.4.11 Nokia Corporation
- 6.4.12 Oracle Corporation
- 6.4.13 SAS Institute Inc.
- 6.4.14 SAP SE
- 6.4.15 Subex Limited
- 6.4.16 TEOCO Corporation
- 6.4.17 Teradata Corporation
- 6.4.18 Wipro Limited
- 6.4.19 ZTE Corporation
- 6.4.20 Mu Sigma, Inc.
7 MARKET OPPORTUNITIES AND FUTURE OUTLOOK
- 7.1 White-space and Unmet-need Assessment
 2026年全球電信分析市場報告
 通訊分析市場規模、佔有率、趨勢和預測:按組件、部署類型、組織規模、應用和地區分類,2026-2034 年日本電信分析市場報告:按組件、部署類型、組織規模、應用和地區分類(2026-2034 年)
 電信分析市場規模、佔有率和成長分析(按組件、部署模式、組織規模和地區分類)-2026-2033年產業預測
 電信人工智慧和分析市場預測至2032年:按組件、公司規模、營運商類型、部署類型、應用和地區分類的全球分析
 通訊分析全球市場規模、佔有率、趨勢分析報告:按部署模式、組織規模、組件、應用、地區、展望和預測,2024-2031 年
 全球通訊分析市場:市場規模、佔有率和趨勢分析(按組件、部署方法、組織規模、應用、地區和細分市場,2025-2030 年)到 2030 年的通訊分析市場預測:按組件、部署、公司規模、應用程式、最終用戶和區域進行的全球分析