


 |
市場調查報告書
商品編碼
1939038
生物表面活性劑:市場佔有率分析、產業趨勢與統計、成長預測(2026-2031)Biosurfactants - Market Share Analysis, Industry Trends & Statistics, Growth Forecasts (2026 - 2031) |
||||||
※ 本網頁內容可能與最新版本有所差異。詳細情況請與我們聯繫。
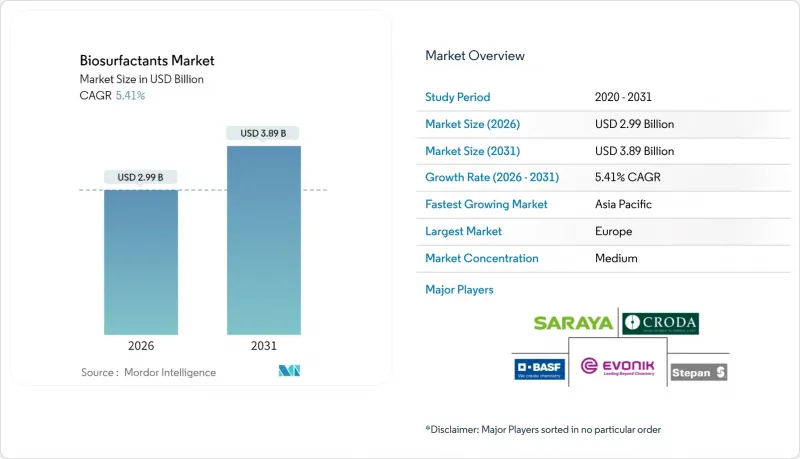
預計生物界面活性劑市場將從 2025 年的 28.4 億美元成長到 2026 年的 29.9 億美元,到 2031 年將達到 38.9 億美元,2026 年至 2031 年的複合年成長率為 5.41%。
對可生物分解原料的強力政策要求、大規模發酵技術的持續創新以及個人護理和油田化學品應用領域日益成長的需求,共同支撐著這一成長趨勢。隨著生產商整合成本更低的廢棄物基材,生產經濟效益正向微生物合成方向轉變,而蓬勃發展的亞太地區供應基地正在改變全球貿易格局。如今,競爭策略的重點在於控制上游原料供應和下游精煉工藝,這種轉變有利於擁有垂直整合營運模式的公司。
全球生物界面活性劑市場趨勢與洞察
亞太地區對個人護理和化妝品的需求不斷成長
區域收入的成長以及消費者對「潔淨標示」成分日益成長的偏好,正在推動對天然來源的溫和表面活性劑的需求。醣脂分子具有優異的皮膚相容性,能夠滿足此需求,使其成為配方者取代合成乙氧基化物的理想選擇。BASF順應這一趨勢,推出了Dehyton PK45 GA/RA,這是一款獲得雨林聯盟認證的椰子油衍生表面活性劑,專為溫和護膚產品而設計。本地製造商正利用其與棕櫚仁油和椰子供應鏈的地理接近性,進一步降低成本並縮短交貨時間。消費者期望的不斷提高,加上供應鏈的結構性優勢,正在加速生物界面活性劑市場在個人護理領域的普及。預計這一轉變將緩解亞太地區對歐洲特種界面活性劑的進口依賴,並從長遠來看重塑全球貿易格局。
歐盟和美國對可生物分解表面活性劑的監管
歐盟修訂後的清潔劑法規引入了數位產品護照、嚴格的生物分解性標準和磷含量上限,這增加了化石基界面活性劑重新配製的成本。同時,美國環保署 (EPA) 將《有毒物質控制法》(TSCA) 的註冊範圍擴大到 Locus Ingredients 的整個 Amphi 生物表面活性劑產品線,這表明微生物衍生表面活性劑在工業應用中得到了明確的認可。這些同步的政策發展形成了一個跨大西洋的合規走廊,生物表面活性劑在該走廊中展現出固有的優勢。符合新標準的公司可以快速獲得產品核可,並在主要零售商處獲得貨架空間,因為在這些零售商處,永續性評分除了價格和性能之外,也受到優先考慮。因此,監管的確定性直接轉化為生物表面活性劑市場滲透率的提高。
食品級和醫藥級原料的純度有嚴格的規定。
食品和製藥應用對內毒素含量和批次間一致性要求極高,因此需要多道下游純化步驟。每道步驟都需要資金投入並產量比率產品產量,進而推高產品成本。監管機構要求在核准新的生物界面活性劑活性劑添加劑之前提供安全數據和過敏原測試結果,這延緩了商業化。小規模公司往往缺乏資金投入這類研究,只有資金雄厚的成熟公司才能涉足這些高階市場。結果是市場兩極化,大宗商品的需求穩定成長,而超高純度細分市場則因進入障礙而受到保護。
細分市場分析
2025年,醣脂佔據生物界面活性劑市場68.87%的佔有率,鞏固了其在銷售和收入方面的結構性優勢。到2031年,年複合成長率(CAGR)也高達5.78%,顯示圍繞這一單分子類別的規模經濟效益正在持續成長。贏創在其斯洛伐克工廠成功實現鼠李醣脂的商業化,證明最佳化的假單胞菌發酵製程能夠維持大宗商品等級的產量並降低轉換成本。槐醣脂是目前最先進的醣脂變體,吸引了像HoliPharma這樣的新進者,該公司於2025年運作了一條中試生產線。如今,競爭差異化正轉向廣泛的智慧財產權,包括菌株設計和整合純化技術。
脂肽類化合物,例如界面活性素,在農業生物防治領域正佔據越來越大的市場佔有率,其抗菌特性使其兼具界面活性劑和活性成分的雙重功效。磷脂類化合物雖然體積較小,但由於親和性,被用於創傷治療膏和靜脈注射製劑中,因此能夠獲得更高的定價和利潤率。生物界面活性劑和地衣素則佔據了工業脫脂和高溫油萃取等需要耐熱性的技術領域。不斷豐富的產品系列表明,隨著生物界面活性劑市場的擴張,產品多樣性能夠支撐多種價格點,使供應商能夠在批量生產大宗商品和實現特種產品盈利之間取得平衡。
生物界面活性劑報告按產品類型(醣脂、磷脂質、界面活性素、地衣素等)、原料(植物油、工業廢甘油、農業殘渣等)、應用(清潔劑/工業清潔劑、化妝品、食品加工、油田化學品等)和地區(亞太地區、北美、歐洲、南美、中東和非洲)進行分析。
區域分析
到2025年,歐洲將佔全球收入的51.62%,這主要得益於其成熟的生物技術基礎和有利於植物來源原料的嚴格環保政策。清潔劑指令的修訂提高了生物分解性基準值,擴大了歐洲製造商的產能,並增強了市場需求。例如,贏創的工業鼠李醣脂工廠和BASF的RSPO認證界面活性劑生產線等設施,都體現了旨在維持其所在地區主導的資本投資。
預計亞太地區將成為主要需求中心,到2031年將以5.98%的複合年成長率成長。中國正大力投資精準發酵技術和產業生物園區基礎設施,以建立國內大規模生產生物界面活性劑的能力。印度不斷壯大的中階正在推動個人護理支出,接近性植物油人工林的地理優勢也有助於高效的原料物流。日本化妝品製造商正在尋求用於藥妝的高純度醣脂,並利用日本先進的監管體系來獲取溢價。
北美仍然是強勁的市場基礎,這得益於有利的政策支持,包括美國環保署的核准和聯邦生物經濟津貼。工業清潔劑和油田化學品仍然是最強勁的推動要素,這主要得益於該地區龐大的製造業和能源產業。南美洲豐富的原料資源使其生產成本具有競爭力,但由於發酵基礎設施有限,產量仍小規模。中東和非洲的細分市場機會正在擴大,海灣產油國正在進行使用鼠李醣脂進行儲存增產的初步試驗,而非洲消費品公司正在測試面向城市市場的植物來源清潔劑。
其他福利:
- Excel格式的市場預測(ME)表
- 3個月的分析師支持
目錄
第1章 引言
- 研究假設和市場定義
- 調查範圍
第2章調查方法
第3章執行摘要
第4章 市場情勢
- 市場概覽
- 市場促進因素
- 亞太地區對個人護理和化妝品的需求不斷成長
- 歐盟和美國對可生物分解表面活性劑的監管
- 主要企業推出的品牌層面永續性舉措
- 透過發酵規模化降低成本曲線
- 生物界面活性劑活性劑產品碳抵消額度
- 市場限制
- 與石油基界面活性劑相比,生產成本較高
- 食品級和醫藥級原料的純度有嚴格的規定。
- 專利堵塞對生產造成壓力
- 價值鏈分析
- 波特五力模型
- 供應商的議價能力
- 買方的議價能力
- 新進入者的威脅
- 替代品的威脅
- 競爭對手之間的競爭
第5章 市場規模與成長預測
- 依產品類型
- 醣脂
- 磷脂
- 表面活性素
- 地衣鯡魚
- 聚合物生物界面活性劑
- 其他產品類型
- 按原料
- 植物油(大豆油、棕櫚油、芥花油)
- 工業廢甘油
- 農業殘渣(糖蜜、乳清)
- 其他(動物脂肪和油脂、合成糖)
- 透過使用
- 清潔劑和工業清潔劑
- 化妝品(個人護理)
- 食品加工
- 油田化學品
- 農業化學品
- 纖維
- 其他用途
- 按地區
- 亞太地區
- 中國
- 印度
- 日本
- 韓國
- ASEAN
- 亞太其他地區
- 北美洲
- 美國
- 加拿大
- 墨西哥
- 歐洲
- 德國
- 英國
- 法國
- 義大利
- 西班牙
- 俄羅斯
- 其他歐洲地區
- 南美洲
- 巴西
- 阿根廷
- 其他南美洲
- 中東和非洲
- 沙烏地阿拉伯
- 南非
- 其他中東和非洲地區
- 亞太地區
第6章 競爭情勢
- 市場集中度
- 策略趨勢
- 市佔率(%)/排名分析
- 公司簡介
- AGAE Technologies, LLC
- AmphiStar Biosurfactants
- BASF
- Biotensidon GmbH
- Croda International Plc
- Dispersa Inc.
- Ecover
- Evonik Industries AG
- Givaudan
- GlycoSurf
- Jeneil Biotech
- Kaneka Corporation
- Saraya.Co.Ltd
- Stepan Company
- Syensqo
- TeeGene Biotech
- TensioGreen
- WHEATOLEO
第7章 市場機會與未來展望
The Biosurfactants market is expected to grow from USD 2.84 billion in 2025 to USD 2.99 billion in 2026 and is forecast to reach USD 3.89 billion by 2031 at 5.41% CAGR over 2026-2031.
Robust policy mandates for biodegradable ingredients, steady breakthroughs in large-scale fermentation, and rising demand from personal care and oilfield chemicals applications collectively anchor this trajectory. Production economics have begun tilting toward microbial synthesis as producers integrate low-cost waste substrates, while fast-growing Asia-Pacific supply hubs reshape global trade flows. Competitive strategies now revolve around controlling both upstream feedstock and downstream purification, a shift that favors companies with vertically integrated operations.
Global Biosurfactants Market Trends and Insights
Expansion of Personal-Care and Cosmetics Demand in APAC
Regional income growth and a consumer pivot toward "clean label" ingredients have intensified demand for mild surfactants that are naturally derived. Glycolipid molecules meet this need through excellent dermatological compatibility, giving formulators a clear alternative to synthetic ethoxylates. BASF responded by unveiling Dehyton PK45 GA/RA, a Rainforest Alliance-certified coconut-oil surfactant that targets gentle skin-care products. Local manufacturers leverage proximity to palm kernel and coconut supply chains to further compress costs and shorten delivery cycles. This combination of rising consumer expectations and structural supply advantages accelerates the biosurfactants market toward mainstream personal-care adoption. Over time the shift is expected to rebalance global trade patterns by lowering Asia-Pacific's import dependence on European specialty surfactants.
Regulatory Push for Biodegradable Surfactants in EU and US
The European Union's updated detergent regulation introduces digital product passports, stringent biodegradability metrics, and phosphorus ceilings, measures that make fossil-based surfactants costlier to reformulate. In parallel, the U.S. Environmental Protection Agency expanded Toxic Substances Control Act registration to cover Locus Ingredients' full Amphi biosurfactant line, sending a clear acceptance signal for microbial surfactants across industrial uses. These synchronized policy moves create a trans-Atlantic compliance corridor in which biosurfactants hold an intrinsic advantage. Companies meeting the new criteria secure faster product approvals, protecting shelf space at major retailers that now rank sustainability scores alongside price and performance. Regulatory certainty, therefore, translates directly into rising biosurfactants market penetration.
Tight Purity Specs for Food and Pharma-Grade Material
Food and pharmaceutical end uses require low endotoxin levels and batch-to-batch consistency, which demand multistep downstream polishing. Each step adds capital expense and yield losses, inflating cost of goods. Regulatory bodies insist on safety dossiers and allergen studies before approving new biosurfactant excipients, slowing commercial timelines. Small firms often lack resources to fund these studies, allowing only well-capitalized incumbents to pursue these premium segments. The result is a bifurcated market in which bulk commodity demand grows steadily but ultra-high-purity niches remain protected by entry barriers.
Other drivers and restraints analyzed in the detailed report include:
- Brand-Level Sustainability Commitments by FMCG Majors
- Fermentation Scale-Up Lowering Cost Curves
- Patent Thickets Around Production Strains
For complete list of drivers and restraints, kindly check the Table Of Contents.
Segment Analysis
Glycolipids captured 68.87% of the biosurfactants market share in 2025, confirming their structural dominance in both volume and revenue terms. They also deliver the fastest 5.78% CAGR to 2031, underscoring how economies of scale continue to build around a single molecular class. Rhamnolipid commercialization at Evonik's Slovak plant shows that optimized Pseudomonas fermentation can sustain commodity output and drive down conversion costs. Sophorolipids represent the most advanced glycolipid variant and attract new entrants like Holiferm that commission pilot lines in 2025. Competitive differentiation now shifts toward intellectual-property breadth, covering strain engineering and integrated purification.
Lipopeptides such as surfactin gain share in agricultural biocontrol, where antimicrobial action offers dual utility as a surfactant and active ingredient. Phospholipids remain small but deliver outsized margins in wound-healing creams and intravenous formulations where their human-cell compatibility commands premium pricing. Polymeric biosurfactants and lichenysin occupy technical niches, industrial degreasing and high-temperature oil extraction, requiring thermal resilience. The evolving portfolio demonstrates that as the biosurfactants market size broadens, product diversity supports multiple price ladders, enabling suppliers to balance commodity volumes with specialty profits.
The Biosurfactants Report is Segmented by Product Type (Glycolipids, Phospholipids, Surfactin, Lichenysin, and More), Feedstock (Vegetable Oils, Industrial Waste Glycerol, Agricultural Residues, Others), Application (Detergents and Industrial Cleaners, Cosmetics, Food Processing, Oilfield Chemicals, and More), and Geography (Asia-Pacific, North America, Europe, South America, and Middle-East and Africa).
Geography Analysis
Europe anchored 51.62% of 2025 revenue through entrenched biotechnology infrastructure and stringent environmental policy that favors plant-based inputs. Updated detergent directives strengthen demand by mandating higher biodegradability thresholds, thereby expanding addressable volumes for European producers. Facilities such as Evonik's industrial rhamnolipid plant and BASF's RSPO-certified surfactant lines reflect capital commitment to maintaining home-region leadership.
Asia-Pacific is forecast to grow at 5.98% CAGR to 2031, turning into the primary demand center. China directs considerable state investment toward precision fermentation and industrial bio-park infrastructure, creating domestic capacity for large-volume biosurfactant output. India's expanding middle class drives personal-care spending, while proximity to vegetable-oil plantations keeps raw-material logistics efficient. Japanese formulators seek high-purity glycolipids for cosmeceuticals, leveraging the country's advanced regulatory system to command price premiums.
North America maintains a sizable base that benefits from favorable policy signals, including EPA approvals and federal bio-economy grants. Given the region's large manufacturing and energy sectors, industrial cleaning and oilfield chemicals remain the strongest pull factors. South America's feedstock abundance offers competitive manufacturing costs, but limited fermentation infrastructure keeps output small. Middle East and Africa develop niche opportunities; Gulf oil producers run pilot trials using rhamnolipids for reservoir stimulation, while African consumer goods companies test plant-based cleaners for urban markets.
- AGAE Technologies, LLC
- AmphiStar Biosurfactants
- BASF
- Biotensidon GmbH
- Croda International Plc
- Dispersa Inc.
- Ecover
- Evonik Industries AG
- Givaudan
- GlycoSurf
- Jeneil Biotech
- Kaneka Corporation
- Saraya.Co.Ltd
- Stepan Company
- Syensqo
- TeeGene Biotech
- TensioGreen
- WHEATOLEO
Additional Benefits:
- The market estimate (ME) sheet in Excel format
- 3 months of analyst support
TABLE OF CONTENTS
1 Introduction
- 1.1 Study Assumptions and Market Definition
- 1.2 Scope of the Study
2 Research Methodology
3 Executive Summary
4 Market Landscape
- 4.1 Market Overview
- 4.2 Market Drivers
- 4.2.1 Expansion of Personal-Care and Cosmetics Demand In APAC
- 4.2.2 Regulatory Push for Biodegradable Surfactants in EU and US
- 4.2.3 Brand-Level Sustainability Commitments by FMCG Majors
- 4.2.4 Fermentation Scale-Up Lowering Cost Curves
- 4.2.5 Carbon-Offset Credits for Biosurfactant-Based SKUs
- 4.3 Market Restraints
- 4.3.1 High Production Cost Vs Petro-Surfactants
- 4.3.2 Tight Purity Specs for Food and Pharma-Grade Material
- 4.3.3 Patent Thickets around Production Strains
- 4.4 Value Chain Analysis
- 4.5 Porter's Five Forces
- 4.5.1 Bargaining Power of Suppliers
- 4.5.2 Bargaining Power of Buyers
- 4.5.3 Threat of New Entrants
- 4.5.4 Threat of Substitutes
- 4.5.5 Competitive Rivalry
5 Market Size and Growth Forecasts (Value)
- 5.1 By Product Type
- 5.1.1 Glycolipids
- 5.1.2 Phospholipids
- 5.1.3 Surfactin
- 5.1.4 Lichenysin
- 5.1.5 Polymeric Bio-surfactants
- 5.1.6 Other Product Types
- 5.2 By Feedstock
- 5.2.1 Vegetable Oils (soy, palm, rapeseed)
- 5.2.2 Industrial Waste Glycerol
- 5.2.3 Agricultural Residues (molasses, whey)
- 5.2.4 Others (Animal Fat, Synthesised Sugars)
- 5.3 By Application
- 5.3.1 Detergents and Industrial Cleaners
- 5.3.2 Cosmetics (Personal Care)
- 5.3.3 Food Processing
- 5.3.4 Oilfield Chemicals
- 5.3.5 Agricultural Chemicals
- 5.3.6 Textiles
- 5.3.7 Other Applications
- 5.4 By Geography
- 5.4.1 Asia-Pacific
- 5.4.1.1 China
- 5.4.1.2 India
- 5.4.1.3 Japan
- 5.4.1.4 South Korea
- 5.4.1.5 ASEAN
- 5.4.1.6 Rest of Asia-Pacific
- 5.4.2 North America
- 5.4.2.1 United States
- 5.4.2.2 Canada
- 5.4.2.3 Mexico
- 5.4.3 Europe
- 5.4.3.1 Germany
- 5.4.3.2 United Kingdom
- 5.4.3.3 France
- 5.4.3.4 Italy
- 5.4.3.5 Spain
- 5.4.3.6 Russia
- 5.4.3.7 Rest of Europe
- 5.4.4 South America
- 5.4.4.1 Brazil
- 5.4.4.2 Argentina
- 5.4.4.3 Rest of South America
- 5.4.5 Middle-East and Africa
- 5.4.5.1 Saudi Arabia
- 5.4.5.2 South Africa
- 5.4.5.3 Rest of Middle-East and Africa
- 5.4.1 Asia-Pacific
6 Competitive Landscape
- 6.1 Market Concentration
- 6.2 Strategic Moves
- 6.3 Market Share (%)/Ranking Analysis
- 6.4 Company Profiles (includes Global level Overview, Market level overview, Core Segments, Financials as available, Strategic Information, Market Rank/Share for key companies, Products and Services, Recent Developments)
- 6.4.1 AGAE Technologies, LLC
- 6.4.2 AmphiStar Biosurfactants
- 6.4.3 BASF
- 6.4.4 Biotensidon GmbH
- 6.4.5 Croda International Plc
- 6.4.6 Dispersa Inc.
- 6.4.7 Ecover
- 6.4.8 Evonik Industries AG
- 6.4.9 Givaudan
- 6.4.10 GlycoSurf
- 6.4.11 Jeneil Biotech
- 6.4.12 Kaneka Corporation
- 6.4.13 Saraya.Co.Ltd
- 6.4.14 Stepan Company
- 6.4.15 Syensqo
- 6.4.16 TeeGene Biotech
- 6.4.17 TensioGreen
- 6.4.18 WHEATOLEO
7 Market Opportunities and Future Outlook
- 7.1 White-space and Unmet-Need Assessment
 微生物生物界面活性劑市場:按類型、原料、形態、通路和應用分類-2026-2032年全球市場預測
 生物界面活性劑市場:依類型(醣脂、脂肽、磷脂質、聚合物生物界面活性劑)、應用和來源(微生物來源、植物來源) - 全球預測(~2036年)
 全球生物表面活性劑市場規模、佔有率、趨勢和成長分析報告(2026-2034年)
 2026年全球植物來源生物界面活性劑市場報告2026年全球生物界面活性劑市場報告
 生物界面活性劑市場機會、成長要素、產業趨勢分析及預測(2026-2035年)
 生物界面活性劑市場-全球產業規模、佔有率、趨勢、機會及按類型、應用、地區和競爭格局分類的預測(2021-2031年)
 生物界面活性劑市場規模、佔有率及成長分析(按產品類型、原料、應用及地區分類)-2026-2033年產業預測
 全球可生物分解界面活性劑市場預測(至2032年):依產品類型、原料、應用、最終用戶及地區分類
 日本生物界面活性劑市場報告:按產品、原料、應用和地區分類(2026-2034年)