


 |
市場調查報告書
商品編碼
1937366
非洲電信塔及相關產業:市場佔有率分析、產業趨勢與統計、成長預測(2026-2031)Africa Telecom Towers And Allied - Market Share Analysis, Industry Trends & Statistics, Growth Forecasts (2026 - 2031) |
||||||
※ 本網頁內容可能與最新版本有所差異。詳細情況請與我們聯繫。
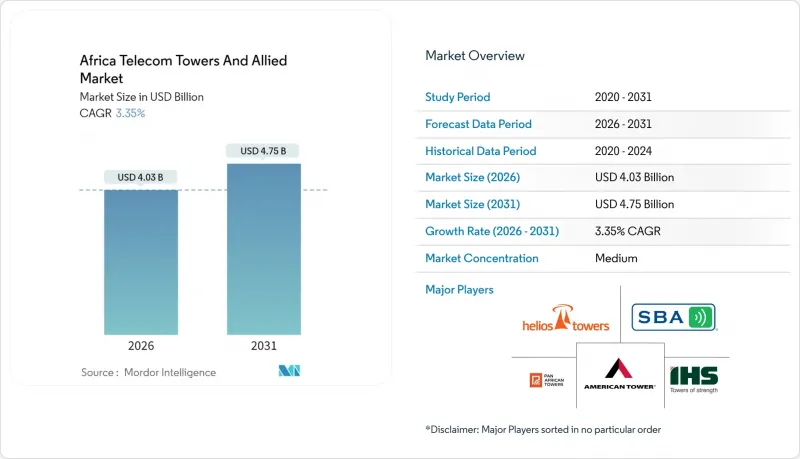
預計到 2026 年,非洲電信塔及相關市場的規模將達到 40.3 億美元。
這代表著從 2025 年的 39 億美元成長到 2031 年的 47.5 億美元,2026 年至 2031 年的複合年成長率為 3.35%。
這項穩定擴張的驅動力來自4G和新推出的5G服務的加速發展、數據消費的成長以及政府主導的擴大遍遠地區網路覆蓋的政策。獨立鐵塔公司持續贏得泛非行動網路營運商簽訂的大規模多年合約,這一趨勢提高了租賃率並改善了營運現金流。隨著綠色金融激勵措施抵消柴油燃料成本的波動,可再生能源系統正蓬勃發展。同時,阿爾及利亞的光纖到戶(FTTH)部署和肯亞的數位經濟計畫等國別項目,正在擴大非洲電信鐵塔市場對地面和屋頂基地台的需求範圍。
非洲電信鐵塔及相關市場趨勢與洞察
泛非行動通訊業者加速4G/5G部署
2024 年和 2025 年初,泛非行動通訊業者新增了數百個 5G基地台,推動撒哈拉以南非洲地區朝著愛立信預測的 2030 年 4.2 億 5G 用戶的目標邁進。僅 MTN 集團就將其 5G基地台擴展至 3000 多個地點,從而推動了整個非洲電信鐵塔市場對共址託管的需求激增。由於 5G 中頻段頻譜的密集部署,拉各斯、內羅畢和約翰尼斯堡尤其需要更多的基地台。鑑於這種緊迫性,獨立鐵塔公司(鐵塔公司)正在提供承包式客製化建設方案,以加快通訊業者從現有 4G 網路遷移到 5G 網路的上市速度。突尼斯 5G 的商用進一步推動了這一趨勢,凸顯了全部區域對下一代通訊基礎設施的投入。
數據消耗量不斷成長,智慧型手機普及率持續提高。
影片串流媒體、社群媒體和行動支付的興起正推動北非和西非地區每位用戶的數據使用量以兩位數GB的速度成長。年輕化人口和價格親民的智慧型手機的進口進一步刺激了這一需求,迫使通訊業者以超出原計劃的速度擴容。不斷成長的數據量導致每個站點可租用天線的數量增加,非洲電信鐵塔市場的租戶比例在主要都市區正從1.5上升到2。這獎勵鐵塔公司建造面向未來的、具有更強承載能力和光纖回程傳輸的鐵塔,隨著數據密集型服務的日益普及,這有望提升其收入。
外匯外匯波動劇烈,主權風險高企
儘管大部分收入以該地貨幣,但債務和資本支出卻與美元掛鉤,這使得鐵塔公司在貨幣貶值期間面臨巨大的外匯折算損失。 IHS Towers 的報告顯示,2024 年非洲多個市場將面臨顯著的外匯逆風,顯示這些市場對宏觀經濟週期高度敏感。主權信用評級等下調可能導致利率上升,從而削弱新建設的獲利能力或延緩再融資進程。營運商和鐵塔公司正擴大探索自然對沖機制,例如逐步提高與美元掛鉤的租賃費率,但由於監管機構對以外幣計價的發票金額設有上限,這些機制的應用仍然有限。
細分市場分析
預計到2025年,獨立鐵塔業者將佔據非洲電信鐵塔市場45.18%的佔有率,並在2031年之前維持6.53%的複合年成長率。其高盈利得益於92.4%的鐵塔利用率以及分散外匯和監管風險的跨國投資組合。在基礎設施共用受限的市場,營運商自有資產仍然存在,但隨著資產負債表精簡策略的演變,資產變現壓力日益增加。如果目前的資產剝離計畫按期完成,到2031年,由獨立鐵塔營運商主導的非洲電信鐵塔市場規模,其年租賃收入可能超過20.7億美元。
在網路控制至關重要的政治敏感地區,行動網路營運商(MNO)擁有的基地台仍然非常重要,但融資緊張的營運商越來越傾向於採用售後回租的方式來為5G頻譜使用資金籌措。合資鐵塔公司提供了一個折衷方案,讓競爭對手共同投資被動資產,同時在主動層保持差異化優勢。美國鐵塔公司(American Tower)的選擇性參與策略證實了全球專業公司在複雜都市地區的利潤優勢,這一趨勢可能會加速非洲電信鐵塔產業的整合。
到2025年,地面塔將佔非洲電信塔市場規模的76.20%,證明其在郊區和農村宏觀覆蓋方面的成本效益。屋頂安裝雖然面積較小,但隨著5G中頻段在人口密集的商業區需要更緊湊的網格間距,其年頻寬成長率正以7.34%的速度成長。在內羅畢、卡薩布蘭卡和約翰尼斯堡等城市中心,都市區景觀規劃和不斷上漲的地價使得屋頂成為唯一可行的選擇。
由於地面塔架天線容量優勢以及易於維修以連接可再生能源,其單站絕對收益依然很高。然而,屋頂塔架的安裝核准速度更快,土木工程成本更低,這使得塔架業者能夠在現有覆蓋區域內獲得額外收益。這種站點類型的多樣化組合,使得非洲電信塔架市場能夠隨著資料流量模式的變化而保持柔軟性。
《非洲電信鐵塔及相關市場報告》按所有權類型(通訊業者擁有、獨立鐵塔公司等)、安裝類型(屋頂安裝、地面安裝)、燃料類型(可再生能源供電、電網/柴油混合供電)、鐵塔類型(單極塔、格構塔、拉線塔、隱蔽式/暗裝塔)和國家/地區進行細分。市場預測以價值(美元)和數量(已安裝基數)為單位。
其他福利:
- Excel格式的市場預測(ME)表
- 3個月的分析師支持
目錄
第1章 引言
- 研究假設和市場定義
- 調查範圍
- 分類系統
第2章調查方法
第3章執行摘要
- 電信鐵塔數量預測(單位數量,2023-2030 年)
- 電信鐵塔租賃收入預測(美元,2023-2030 年)
- 電信鐵塔建設收入預測(美元,2023-2030 年)
第4章 市場情勢
- 市場概覽
- 市場促進因素
- 非洲行動通訊業者加速部署4G/5G網路
- 數據消耗量不斷成長,智慧型手機普及率持續提高。
- 政府主導的農村覆蓋率目標和普及服務基金
- 行動通訊業者(MNO) 的輕資產網路策略推動了基地台外包
- 綠色金融獎勵措施促進可再生能源維修
- 對中立託管的室內DAS和小型基地台回程傳輸的需求日益成長
- 市場限制
- 外匯匯率波動劇烈,主權風險高企
- 冗長的許可證辦理和土地徵用流程導致的瓶頸
- 柴油供應中斷會增加離網站點的營運成本。
- 二線城市缺乏光纖回程回程傳輸限制了租戶比例
- 生態系分析
- 電訊基礎設施相關法規
- 技術展望
- 波特五力分析
- 供應商的議價能力
- 買方的議價能力
- 新進入者的威脅
- 替代品的威脅
- 競爭對手之間的競爭
- 宏觀經濟因素如何影響市場
第5章 市場規模與成長預測
- 所有權
- 企業所有
- 獨立鐵塔公司
- 合資塔樓公司
- 僅限行動網路營運商
- 透過安裝
- 屋頂安裝類型
- 地面安裝
- 按燃料類型
- 可再生能源
- 電網/柴油混合動力
- 按塔類型
- 單極子
- 格子
- 拉線類型
- 隱蔽型/隱藏型
- 按國家/地區
- 阿爾及利亞
- 肯亞
- 摩洛哥
- 南非
- 奈及利亞
- 迦納
- 埃及
- 坦尚尼亞
- 其他非洲國家(突尼斯、烏干達、尚比亞、塞內加爾等)
第6章 競爭情勢
- 市場集中度
- 重大併購詳情
- 主要供應商市佔率分析
- 公司簡介
- TowerCos
- American Tower Corporation
- IHS Towers(IHS Holding Limited)
- Helios Towers Plc
- SBA Communications Corporation
- Pan African Towers
- Atlas Tower Group Limited
- Eastcastle Infrastructure
- Paradigm Infrastructure Limited
- Hotspot Network Ltd
- Mobile Network Operator
- MTN Group
- Vodacom Group
- Airtel Africa plc
- Orange Middle East and Africa
- e& misr company
- Safaricom PLC
- Telkom SA SOC Limited
- Globacom Limited(Glo)
- Maroc Telecom SA
- WE(Telecom Egypt)
- Unitel Angola(Unitel SA)
- Econet Wireless Zimbabwe Ltd.
- Ethio Telecom
- Movitel Mozambique(Movitel SA)
- Moov Africa
- Sonatel Senegal(Sonatel SA)
- Yas Madagascar
- TowerCos
第7章 市場機會與未來展望
The Africa Telecom Towers And Allied Market size in 2026 is estimated at USD 4.03 billion, growing from 2025 value of USD 3.9 billion with 2031 projections showing USD 4.75 billion, growing at 3.35% CAGR over 2026-2031.
Accelerated 4G and newly launched 5G rollouts, rising data consumption, and government-backed rural coverage mandates underpin this steady expansion. Independent TowerCos continue to win large multi-year outsourcing contracts from pan-African mobile network operators, a trend that lifts tenancy ratios and improves operating cash flows. Renewable-powered systems are gaining momentum as green financing incentives offset the volatility of diesel fuel costs. Meanwhile, country-specific programs, such as Algeria's fiber-to-the-home build-out and Kenya's digital-economy blueprint, add geographic depth to overall demand for ground-based and rooftop sites across the Africa telecom tower market.
Africa Telecom Towers And Allied Market Trends and Insights
Accelerated 4G/5G rollout by pan-African MNOs
Pan-African mobile network operators added hundreds of 5G sites in 2024 and early 2025, lifting total 5G subscriptions in Sub-Saharan Africa toward Ericsson's 420 million projection for 2030 . MTN Group alone expanded its 5G footprint to more than 3,000 sites, prompting a surge in colocation requests across the Africa telecom tower market . The densification imperative is especially acute in Lagos, Nairobi, and Johannesburg, where 5G mid-band spectrum requires closer site spacing. Independent TowerCos capitalize on this urgency by offering turnkey build-to-suit programs that shorten time-to-market for operators migrating from legacy 4G networks. The momentum is reinforced by the recent commercial 5G launch in Tunisia, underscoring the broad regional commitment to next-generation connectivity .
Rising data consumption and smartphone penetration
Video streaming, social media, and mobile payments are elevating per-subscriber data use into double-digit gigabyte ranges across North and West Africa. Young demographics and low-cost smartphone imports sustain this demand curve, compelling operators to add capacity faster than originally budgeted. Higher data volumes translate into larger leaseable antenna counts per site, pushing tenancy ratios across the Africa telecom tower market from 1.5x toward 2x in core metros. TowerCos are therefore incentivized to future-proof structures with stronger load capacities and fiber-ready backhaul, ensuring revenue upside as data-heavy services proliferate.
Volatile foreign-exchange and high sovereign risk
Revenue is largely denominated in local currencies, but debt and capex remain USD-linked, exposing TowerCos to material conversion losses during currency depreciations. IHS Towers reported notable FX headwinds in several African markets during 2024, underscoring sensitivity to macroeconomic cycles. Sovereign credit downgrades trigger higher interest rates that can render new builds unviable or slow refinancing efforts. Operators and TowerCos are increasingly exploring natural hedges such as USD-indexed lease escalators, but uptake remains limited by regulatory caps on foreign-currency billing.
Other drivers and restraints analyzed in the detailed report include:
- Government-led rural coverage mandates and universal service funds
- Asset-light network strategies by MNOs boosting tower outsourcing
- Lengthy permitting and land-acquisition bottlenecks
For complete list of drivers and restraints, kindly check the Table Of Contents.
Segment Analysis
Independent TowerCos commanded 45.18% of the Africa telecom tower market share in 2025 and are on track for a 6.53% CAGR through 2031. The superior returns stem from 92.4% utilization rates and diversified country portfolios that smooth FX and regulatory risk. Operator-owned assets persist in markets with infrastructure-sharing constraints, but monetization pressure is rising as balance-sheet light strategies take hold. The Africa telecom tower market size for Independent TowerCos could exceed USD 2.07 billion in annual lease revenue by 2031 if current divestiture pipelines close on schedule.
MNO captive sites remain critical in politically sensitive geographies where network control is paramount; however, cash-strapped operators increasingly favor sale-leasebacks to fund 5G spectrum fees. Joint-venture TowerCos offer a middle path, letting rivals co-invest in passive plant without sacrificing active-layer differentiation. American Tower's selective entry strategy validates the margin advantage enjoyed by global specialists in complex metros, a dynamic likely to accelerate consolidation across the Africa telecom tower industry.
Ground-based towers held 76.20% of the Africa telecom tower market size in 2025, proving cost-effective for suburban and rural macro coverage. Rooftop installations, though smaller in absolute footprint, are gaining a 7.34% CAGR as 5G mid-band frequencies demand tighter grid spacing in densely populated business districts. Municipal aesthetic guidelines and mounting land prices make rooftops the only viable option in central Nairobi, Casablanca, and Johannesburg.
Ground-based towers still deliver higher absolute revenue per site thanks to greater antenna load capacity and ease of renewable-power retrofits. Yet rooftops promise faster permitting and reduced civil works expenditure, allowing TowerCos to capture incremental revenue within established coverage zones. This nuanced mix of site types ensures the Africa telecom tower market remains flexible as data-traffic patterns evolve.
The Africa Telecom Towers and Allied Market Report is Segmented by Ownership (Operator-Owned, Independent TowerCo, and More), Installation (Rooftop, Ground-Based), Fuel Type (Renewable-Powered, Grid/Diesel Hybrid), Tower Type (Monopole, Lattice, Guyed, Stealth/Concealed), and Country. The Market Forecasts are Provided in Terms of Value (USD) and Volume (Installed Base).
List of Companies Covered in this Report:
- TowerCos
- Mobile Network Operator
Additional Benefits:
- The market estimate (ME) sheet in Excel format
- 3 months of analyst support
TABLE OF CONTENTS
1 INTRODUCTION
- 1.1 Study Assumptions and Market Definition
- 1.2 Scope of the Study
- 1.3 Taxonomy
2 RESEARCH METHODOLOGY
3 EXECUTIVE SUMMARY
- 3.1 Telecom Tower Volume Estimates (Units, 2023-2030)
- 3.2 Telecom Tower Leasing Revenue Estimates (USD, 2023-2030)
- 3.3 Telecom Tower Construction Revenue Estimates (USD, 2023-2030)
4 MARKET LANDSCAPE
- 4.1 Market Overview
- 4.2 Market Drivers
- 4.2.1 Accelerated 4G/5G rollout by pan-African MNOs
- 4.2.2 Rising data consumption and smartphone penetration
- 4.2.3 Government-led rural coverage mandates and universal service funds
- 4.2.4 Asset-light network strategies by MNOs boosting tower outsourcing
- 4.2.5 Green financing incentives for renewable power retrofits
- 4.2.6 Expansion of neutral-host indoor DAS and small-cell backhaul demand
- 4.3 Market Restraints
- 4.3.1 Volatile foreign-exchange and high sovereign risk
- 4.3.2 Lengthy permitting and land-acquisition bottlenecks
- 4.3.3 Diesel supply disruptions raising opex at off-grid sites
- 4.3.4 Fiber backhaul deficits limiting tenancy ratios in secondary cities
- 4.4 Ecosystem Analysis
- 4.5 Regulatory Landscape Related to Telecom Infrastructure
- 4.6 Technological Outlook
- 4.7 Porter's Five Forces Analysis
- 4.7.1 Bargaining Power of Suppliers
- 4.7.2 Bargaining Power of Buyers
- 4.7.3 Threat of New Entrants
- 4.7.4 Threat of Substitutes
- 4.7.5 Intensity of Competitive Rivalry
- 4.8 Impact of Macroeconomic Factors on the Market
5 MARKET SIZE AND GROWTH FORECASTS (VALUE AND VOLUME)
- 5.1 By Ownership
- 5.1.1 Operator-owned
- 5.1.2 Independent TowerCo
- 5.1.3 Joint-Venture TowerCo
- 5.1.4 MNO Captive
- 5.2 By Installation
- 5.2.1 Rooftop
- 5.2.2 Ground-based
- 5.3 By Fuel Type
- 5.3.1 Renewable-powered
- 5.3.2 Grid/Diesel Hybrid
- 5.4 By Tower Type
- 5.4.1 Monopole
- 5.4.2 Lattice
- 5.4.3 Guyed
- 5.4.4 Stealth / Concealed
- 5.5 By Country
- 5.5.1 Algeria
- 5.5.2 Kenya
- 5.5.3 Morocco
- 5.5.4 South Africa
- 5.5.5 Nigeria
- 5.5.6 Ghana
- 5.5.7 Egypt
- 5.5.8 Tanzania
- 5.5.9 Rest of Africa (Tunisia, Uganda, Zambia, Senegal, and Others)
6 COMPETITIVE LANDSCAPE
- 6.1 Market Concentration
- 6.2 Details of Major Mergers and Acquisitions
- 6.3 Market Share Analysis for top vendors
- 6.4 Company Profiles (includes Global level Overview, Market level overview, Core Segments, Financials, Strategic Information, Products and Services, Recent Developments)
- 6.4.1 TowerCos
- 6.4.1.1 American Tower Corporation
- 6.4.1.2 IHS Towers (IHS Holding Limited)
- 6.4.1.3 Helios Towers Plc
- 6.4.1.4 SBA Communications Corporation
- 6.4.1.5 Pan African Towers
- 6.4.1.6 Atlas Tower Group Limited
- 6.4.1.7 Eastcastle Infrastructure
- 6.4.1.8 Paradigm Infrastructure Limited
- 6.4.1.9 Hotspot Network Ltd
- 6.4.2 Mobile Network Operator
- 6.4.2.1 MTN Group
- 6.4.2.2 Vodacom Group
- 6.4.2.3 Airtel Africa plc
- 6.4.2.4 Orange Middle East and Africa
- 6.4.2.5 e& misr company
- 6.4.2.6 Safaricom PLC
- 6.4.2.7 Telkom SA SOC Limited
- 6.4.2.8 Globacom Limited (Glo)
- 6.4.2.9 Maroc Telecom SA
- 6.4.2.10 WE (Telecom Egypt)
- 6.4.2.11 Unitel Angola (Unitel SA)
- 6.4.2.12 Econet Wireless Zimbabwe Ltd.
- 6.4.2.13 Ethio Telecom
- 6.4.2.14 Movitel Mozambique (Movitel S.A.)
- 6.4.2.15 Moov Africa
- 6.4.2.16 Sonatel Senegal (Sonatel SA)
- 6.4.2.17 Yas Madagascar
- 6.4.1 TowerCos
7 MARKET OPPORTUNITIES AND FUTURE OUTLOOK
- 7.1 White-space and Unmet-need Assessment
- 7.2 Investment Analysis
- 7.3 Analyst Suggestions and Recommendations
 通訊塔市場規模、佔有率、趨勢和預測:按塔型、燃料類型、安裝方式、所有權方式和地區分類,2026-2034 年
 隱蔽通訊塔市場規模、佔有率和成長分析:按偽裝設計/類型、塔架結構、頻率/頻段相容性、安裝位置和地區分類-2026-2033年產業預測
 行動電話基地台管理市場:依接取技術、塔型、安裝方式、服務類型、高度等級、組件類型及最終用戶產業分類-2026-2032年全球市場預測
 2026年全球數位雙胞胎市場報告
 2026-2030年全球電信塔市場2026年全球通訊塔市場報告
 美國電信鐵塔:市場佔有率分析、產業趨勢與統計、成長預測(2026-2031)電信塔:市場佔有率分析、產業趨勢與統計資料、成長預測(2026-2031 年)
 塔架管理軟體市場 - 全球產業規模、佔有率、趨勢、機會及預測(按部署類型、塔架類型、功能、最終用戶、地區和競爭格局分類,2021-2031 年)電信塔供電系統市場-全球產業規模、佔有率、趨勢、機會與預測:電源、電網、組件、區域和競爭格局,2021-2031年